[Preprint]. 2024 Sep 9:2024.09.04.611333.
doi: 10.1101/2024.09.04.611333.

Mast cells promote pathology and susceptibility in tuberculosis

Affiliations

Mast cells promote pathology and susceptibility in tuberculosis

Ananya Gupta et al. bioRxiv. .

Abstract

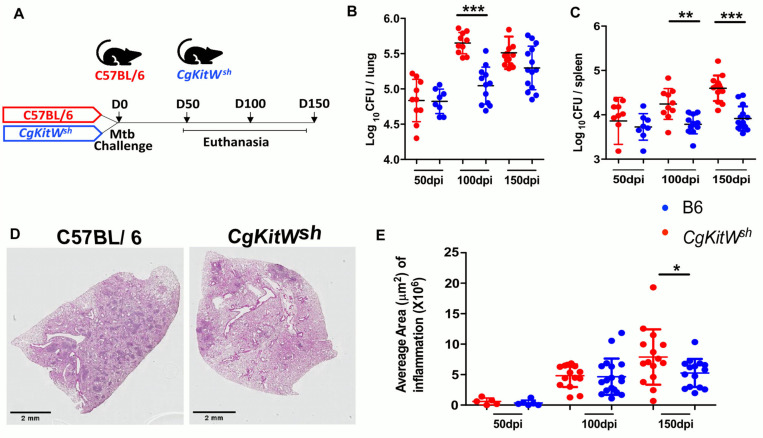
Tuberculosis (TB), caused by the bacterium Mycobacterium tuberculosis (Mtb), infects approximately one-fourth of the world's population. While most infected individuals are asymptomatic, latent TB infection (LTBI) can progress to cause pulmonary TB (PTB). We recently reported an increased accumulation of mast cells (MCs) in lungs of macaques with PTB, compared with LTBI in macaques. MCs respond in vitro to Mtb exposure via degranulation and by inducing proinflammatory cytokines. In the current study, we show the dominant production of chymase by MCs in granulomas of humans and macaques with PTB. Using scRNA seq analysis, we show that MCs found in LTBI and healthy lungs in macaques are enriched in genes involved in tumor necrosis factor alpha, cholesterol and transforming growth factor beta signaling. In contrast, MCs clusters found in PTB express transcriptional signatures associated with interferon gamma, oxidative phosphorylation, and MYC signaling. Additionally, MC deficiency in the mouse model showed improved control of Mtb infection that coincided with reduced accumulation of lung myeloid cells and diminished inflammation at chronic stages. Thus, these collective results provide novel evidence for the pathological contribution of MCs during Mtb infection and may represent a novel target for host directive therapy for TB.

Keywords: Mast cells; Tuberculosis; inflammation; innate cell; lung.


Conflict of interest statement

Competing interests. The authors declare no competing interests.

Figures

Figure 1.
Figure 1.. Chymase positive mast cells are predominant in TB infected human and macaque lung tissue.
Lung biopsies from healthy individuals (n = 4) or patients with PTB (n = 5) were stained for tryptase MCT (green) or chymase MCC (red). (A) Immunofluorescence microscopy shows MCTS (green) in healthy lung biopsies (HC). MCTCS (red and green merge) are located around the early granulomas, while MCCS (red) surround the late granulomas in TB infected lung biopsies. (B) Predominance of MCTS in healthy lungs transitioning to MCTCS in early granuloma and becoming MCCS in late granulomas in TB infected lungs. (C) Immunofluorescence microscopy shows MCTS (green) and MCTCS (merge) in lungs of healthy (HC), LTBI and PTB macaques. (D) Predominance of MCTS (green) and MCTCS (merge) in PTB compared to LTBI and HC. Statistical analysis was performed using unpaired, 2-tailed Student’s t test, **** p < 0.0001, *** p < 0.001, * p< 0.05.
Figure 2.
Figure 2.. Mast cells in lung in active TB show an inflammatory and metabolically active transcriptome as compared to HC or LTBI.
Single-cell (sc) RNA-seq Data was re-analyzed from the lung of non-human primates (Esauolva et al). (A) UMAP embedding of the FCER1A+ mast cells, revealed four transcriptionally distinct clusters; the distribution of the MCs across disease condition is indicated by the color PTB (pink), HC (green) and LTBI (blue). (B) Showing the average expression of MCs specific marker genes (FCER1A, MS4A2 and CD48) and a macrophage gene ITGAX in contrast. (C) Dot plot indicating expression of top differentially expressed genes detected for each cell cluster identified. The dot color represents the expression level, and the dot size represents the percentage of cells in each cluster expressing a particular gene. (D) Hallmark Pathway analysis of the differential genes, only top pathways with highest FDR in each cluster is plotted. The color indicates the –log10 FDR; E-H) UMAP plots with the U cell module score (averaged score of all genes) of the pathways and their corresponding violin plots. Cluster 2 from LTBI/HC were compared to the rest of the PTB groups using a Kruskal-Wallis test with Dunn’s multiple correction. **** p < 0.0001, *** p < 0.001, ns: not significant.
Figure 3:
Figure 3:. MC deficient mice are resistant to Mtb chronic infection.
(A) C57BL/6 and CgKitWsh mice were infected with a low aerosol dose (~100CFU) of Mtb HN878 and mice were sacrificed at 50, 100 and 150 dpi. (B) Bacterial burden was assessed in lungs and spleens by plating. (C) Lungs were harvested, fixed in formalin and embedded in paraffin. H&E staining was caried out for blinded and unbiased analysis of histopathology. (D) Representative images and the area of inflammation measured in each lobe is shown. Scale bars: 2mm. Original magnification: ×20. Data points represent the mean ± SD of two experiments (n = 8–15 per time point per group). Statistical analysis was performed using unpaired, 2-tailed Student’s t test between C57BL/6 and CgKitWsh mice, **** p < 0.0001, *** p < 0.001, * p< 0.05.
Figure 4:
Figure 4:. MC deficient mice have dysregulated immune profile after Mtb infection.
C57BL/6 and CgKitWsh mice were infected with a low aerosol dose (~100CFU) of Mtb HN878 and mice were sacrificed at 50, 100 and 150 dpi. Number of (A) mast cells, (B) dendritic cells, (C) recruited macrophages, (D) alveolar macrophages, (E) neutrophils and (F) monocytes were enumerated in the lungs of Mtb infected mice. (G) Cytokine and chemokines production in lung homogenates from mice, collected at 150dpi, was assessed by multiplex cytokine analysis. Data points represent the mean ± SD of 1 of 2 individual experiments (n = 5–8 per time point per group). Statistical analysis was performed using unpaired, 2-tailed Student’s t test for (A) to (F) and Two-way ANOVA Sidak’s multiple comparison test for (G) between C57BL/6 and CgKitWsh mice, *** p < 0.0001, ** p < 0.001, * p< 0.05. Outliers were removed from the 616 subsets using Grubb’s outlier test.

References

    1. Ardain A, Domingo-Gonzalez R, Das S, Kazer S W, Howard NC, Singh A, Khader SA. 2019. Group 3 innate lymphoid cells mediate early protective immunity against tuberculosis. Nature 570: 528–532. DOI: 10.1038/s41586-019-1276-2 - DOI - PMC - PubMed
    1. Bian G, Gu Y, Xu C, Yang W, Pan X, Chen Y, Ma F. 2021. Early development and functional properties of tryptase/chymase double-positive mast cells from human pluripotent stem cells. Journal of Molecular Cell Biology 13: 104–115. DOI: 10.1093/jmcb/mjaa059 - DOI - PMC - PubMed
    1. Bohrer AC, Castro E, Hu Z, Queiroz ATL, Tocheny CE, Assmann M, Mayer-Barbe KD. 2021. Eosinophils are part of the granulocyte response in tuberculosis and promote host resistance in mice. Journal of Experimental Medicine 218. DOI: 10.1084/jem.20210469 - DOI - PMC - PubMed
    1. Carlos D, de Souza Junior DA, de Paula L, Jamur MC, Oliver C, Ramos SG, Faccioli LH. 2007. Mast cells modulate pulmonary acute inflammation and host defense in a murine model of tuberculosis. Journal of Infectious Diseases 196: 1361–1368. DOI: 10.1086/521830 - DOI - PubMed
    1. Carlos D, Fremond C, Samarina A, Vasseur V, Maillet I, Ramos SG, Ryffel B. 2009. Histamine plays an essential regulatory role in lung inflammation and protective immunity in the acute phase of Mycobacterium tuberculosis infection. Infection and Immunity 77: 5359–5368. DOI: 10.1128/IAI.01497-08 - DOI - PMC - PubMed

Publication types

LinkOut - more resources