[Preprint]. 2024 Sep 13:2024.09.12.612761.
doi: 10.1101/2024.09.12.612761.

The mitochondrial dicarboxylate carrier mediates in vivo hepatic gluconeogenesis

Affiliations

The mitochondrial dicarboxylate carrier mediates in vivo hepatic gluconeogenesis

Daniel J Pape et al. bioRxiv. .

Abstract

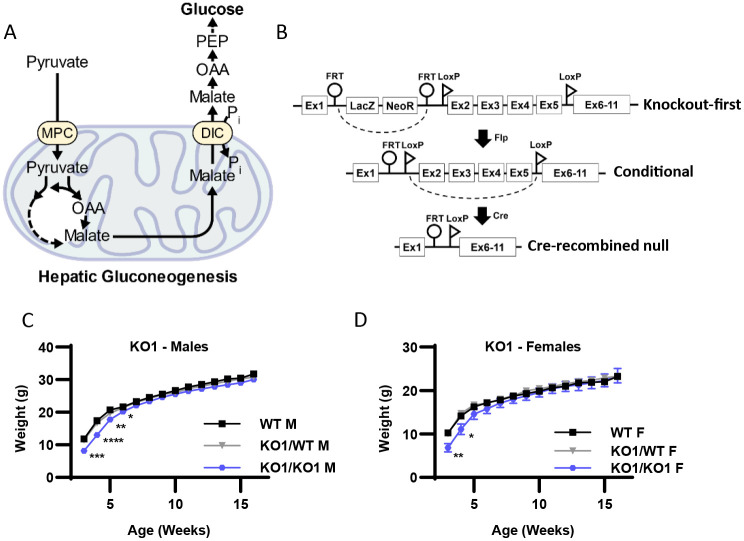
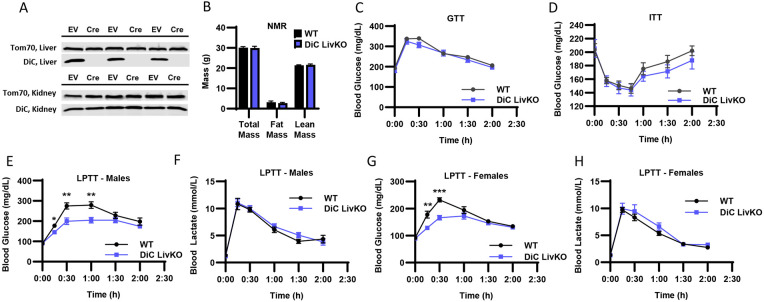
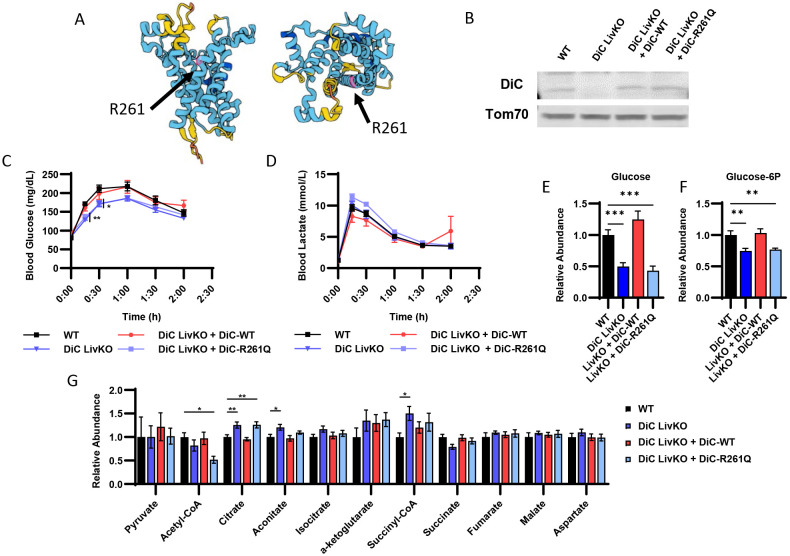
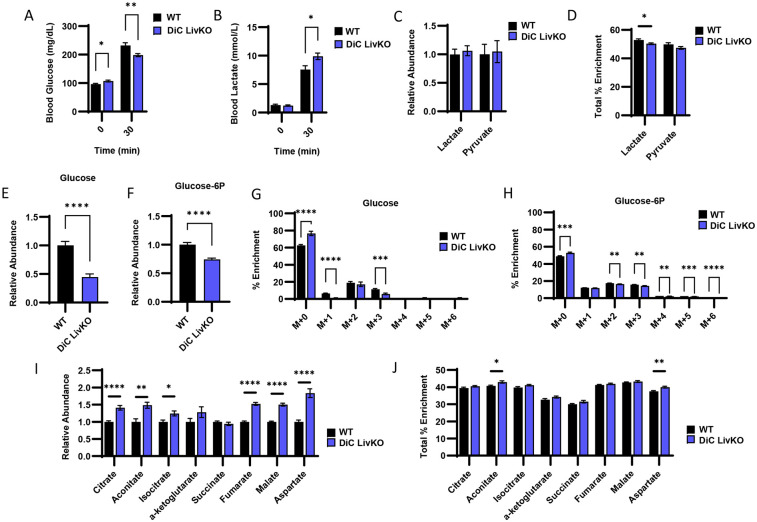
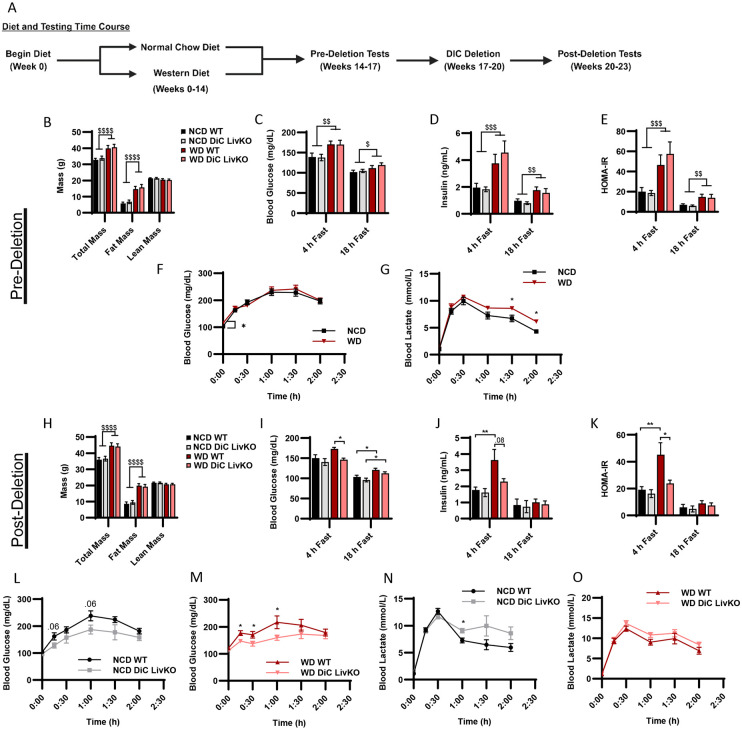
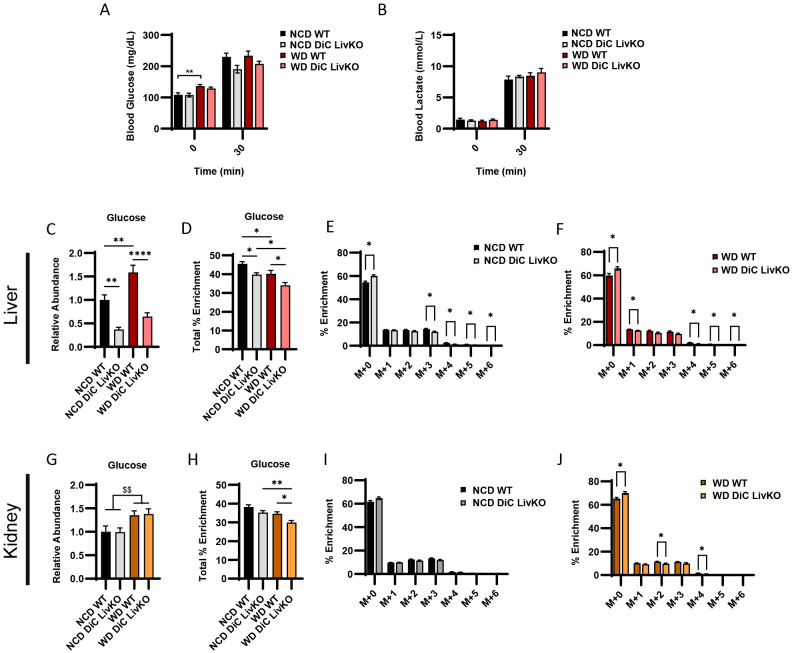
Hepatic gluconeogenesis (GNG) is essential for maintaining euglycemia during prolonged fasting. However, GNG becomes pathologically elevated and drives chronic hyperglycemia in type 2 diabetes (T2D). Lactate/pyruvate is a major GNG substrate known to be imported into mitochondria for GNG. Yet, the subsequent mitochondrial carbon export mechanisms required to supply the extra-mitochondrial canonical GNG pathway have not been genetically delineated. Here, we evaluated the role of the mitochondrial dicarboxylate carrier (DiC) in mediating GNG from lactate/pyruvate. We generated liver-specific DiC knockout (DiC LivKO) mice. During lactate/pyruvate tolerance tests, DiC LivKO decreased plasma glucose excursion and 13C-lactate/-pyruvate flux into hepatic and plasma glucose. In a Western diet (WD) feeding model of T2D, acute DiC LivKO after induction of obesity decreased lactate/pyruvate-driven GNG, hyperglycemia, and hyperinsulinemia. Our results show that mitochondrial carbon export through the DiC mediates GNG and that the DiC contributes to impaired glucose homeostasis in a mouse model of T2D.

Keywords: Diabetes; Gluconeogenesis (GNG); Liver; Metabolomics; Mitochondrial dicarboxylate carrier (DiC).


Conflict of interest statement

DECLARATION OF INTERESTS EBT has consulted with BioGenerator Ventures for work unrelated to this manuscript.

Figures

Figure 1:
Figure 1:. Whole-body DiC knockout-first (KO1) mice have decreased body weight at weaning but grow normally.
A. Schematic illustrating the role of the mitochondrial dicarboxylate carrier (DiC) in gluconeogenesis. MPC, mitochondrial pyruvate carrier; OAA, oxaloacetate; PEP, phosphoenolpyruvate. B. Schematic illustrating Slc25a10Tm1a knockout-first allele (KO1), the conditional (DiCfl/fl) allele, and the AAV-TBG-Cre mediated, liver-specific null allele (DiC LivKO). C-D. Body weight of wild type (WT), heterozygous (KO1/WT) and knockout-first (KO1/KO1) male (C) and female (D) mice, beginning on the day of weaning (3 weeks of age). Data are presented as mean ± SEM. Statistical significance evaluated by one-way ANOVA within each time point denoted as * p<0.05, ** p<0.01, *** p<0.001, **** p<0.0001. N for male mice = 11-18 WT, 26-39 KO1/WT, and 13-15 KO1/KO1. N for female mice = 13-17 WT, 15-34 KO1/WT, and 8-9 KO1/KO1.
Figure 2:
Figure 2:. DiC LivKO decreases glucose excursion during lactate/pyruvate tolerance tests.
A. Western blot of isolated liver and kidney mitochondria from AAV-TBG-NULL (WT) or AAV-TBG-Cre (DiC LivKO) injected DiCfl/fl mice, 10 weeks post-injection. B. Total body, fat, and lean mass determined by Nuclear Magnetic Resonance (NMR) of 17-18 week old WT and DiC LivKO mice, 9 weeks post-AAV EV/Cre injection. C. Blood glucose measured before and during an Intraperitoneal Glucose Tolerance Test (GTT, 1.25 g/kg body weight) performed on 11-12 week old WT and DiC LivKO mice, 3 weeks post-AAV EV/Cre injection. D. Blood glucose measured before and during an Insulin Tolerance Test (ITT, 0.75 U/kg body weight) performed on 12-13 week old WT and DiC LivKO mice, 4 weeks post-AAV EV/Cre injection. E-F. Blood glucose (E) and lactate (F) measured before and during a Lactate/Pyruvate Tolerance Test (L/PTT, 3.0 g/kg lean mass, 10:1 lactate/pyruvate) performed on 18-19 week old male WT and DiC LivKO mice, 10 weeks post-AAV EV/Cre injection. G-H. Blood glucose (G) and lactate (H) measured before and during a L/PTT (2.2 g/kg body weight, 10:1 lactate/pyruvate) performed on 13-14 week old female WT and DiC LivKO mice, 4 weeks post-AAV EV/Cre injection. Data are presented as mean ± SEM. Statistical significance evaluated by t-test at each time point denoted as * p<0.05, ** p<0.01, is *** p<0.001. N = 10 per group.
Figure 3:
Figure 3:. Complementing DiC LivKO with ectopically expressed WT but not transport null R261Q DiC rescues glucose excursion during lactate/pyruvate tolerance tests.
A. AlphaFold structure of DiC protein denoting the expected location of R261 in the pore region. B. Western blot of isolated liver mitochondria from WT, DiC LivKO, DiC LivKO + DiC-WT, or DiC LivKO + DiC-R261Q mice. C-D. Blood glucose (C) and lactate (D) measured before and during a Lactate/Pyruvate Tolerance Test (L/PTT, 2.2 g/kg body weight, 10:1 lactate/pyruvate) performed on 10-11 week old WT, DiC LivKO, DiC LivKO + DiC-WT, or DiC LivKO + DiC-R261Q mice, 3 weeks post-AAV EV/Cre injection. E-G. Liver glucose (E), glucose-6P (F), and TCA cycle intermediates (G) levels were measured by LC-MS metabolomic profiling of 12-13 week old WT, DiC LivKO, DiC LivKO + DiC-WT, or DiC LivKO + DiC-R261Q mice, 6 weeks post-AAV EV/Cre injection. Data are presented as mean ± SEM. Statistical testing by one-way ANOVA and the Holm-Sidak post-hoc multiple comparison test within each time point compared to WT (L/PTT) and for each metabolite (LC-MS metabolomics). Significance denoted by * p<0.05, ** p<0.01, *** p<0.001. N = 10 per group.
Figure 4:
Figure 4:. DiC LivKO decreases gluconeogenesis from 13C-lactate/-pyruvate.
13-14 week old WT and DiC LivKO mice were administered 13C-lactate/pyruvate tracer (2.2 g/kg body weight, 9:1 lactate/pyruvate) and euthanized 30 minutes later, 5 weeks post-AAV EV/Cre injection. A-B. Blood glucose (A) and lactate (B) measured by strip meter before tracer administration and at euthanasia. C-D. Terminal liver lactate and pyruvate levels (C) determined as the sum of all isotopologue peak areas and total percent enrichment (D) determined as the sum of all 13C labeled isotopologues) measured by LC-MS. E-H. Terminal liver glucose (E and G) and glucose-6P (F and H) levels (E and F) and mass isotopologue distribution analysis (G and H) measured by LC-MS. I-J. Terminal liver TCA cycle intermediate levels (I) and total percent enrichment (J) measured by LC-MS. Data are presented as mean ± SEM. Statistical analysis by t-test for each time point (blood glucose and lactate), metabolite (LC-MS analysis), or isotopologue (MID analysis). Significance denoted as * p<0.05, ** p<0.01, *** p<0.001, **** p<0.0001. N = 10 for each group.
Figure 5:
Figure 5:. DiC LivKO normalizes blood glucose and insulin levels in Western Diet (WD) treated mice.
A. Schematic illustrating the diet treatment and testing time course for DiCfl/fl mice. B. Total body, fat, and lean mass determined by Nuclear Magnetic Resonance (NMR) of 20-21 week old DiCfl/fl mice, fed normal chow (NCD) or western diet (WD) for 14 weeks. C-E. Blood glucose (C) and plasma insulin (D) measured in 4- and 18-hour fasted, 20-22 week old DiCfl/fl mice, fed NCD or WD for 14-15 weeks. The Homeostatic Model Assessment for Insulin Resistance (HOMA-IR, E) calculated from values shown in C and D. F-G. Blood glucose (F) and lactate (G) measured before and during a Lactate/Pyruvate Tolerance Test (L/PTT, 3.0 g/kg lean mass, 10:1 lactate/pyruvate) performed on 21-22 week old DiCfl/fl mice, fed NCD or WD for 15 weeks. H. Total body, fat, and lean mass determined by NMR of 26-27 week old WT and DiC LivKO mice, 3 weeks post-AAV EV/Cre injection, fed NCD or WD for 20 weeks. I-K. Blood glucose (I) and plasma insulin (J) measured in 4- and 18-hour fasted, 26-28 week old WT and DiC LivKO mice, 3-4 weeks post-AAV EV/Cre injection, fed NCD or WD for 20-21 weeks. HOMA-IR (K) calculated from values shown in I and J. L-O. Blood glucose (L and M) and lactate (N and O) measured before and during a Lactate/Pyruvate Tolerance Test (L/PTT, 3.0 g/kg lean mass, 10:1 lactate/pyruvate) performed on 27-28 week old WT and DiC LivKO mice, 4 weeks post-AAV EV/Cre injection, fed NCD (L, N) or WD (M and O) for 21 weeks. Data are presented as mean ± SEM. Statistical analysis of NMR, blood glucose, insulin, and HOMA-IR results performed by two-way ANOVA with Holm-Sidak post-hoc multiple comparison test within 4- and 18-hour fasting groups with significance denoted as $ p<0.05, $$ p<0.01, $$$ p<0.001, $$$ p<0.0001 for main effects and * p<0.05, ** p<0.01, *** p<0.001, **** p<0.0001 for multiple comparisons. Statistical analysis of L/PTT results performed by t-test for each time point denoted as * p<0.05. N = 9-10 for each group.
Figure 6:
Figure 6:. DiC LivKO decreases glucose production from 13C-lactate/-pyruvate in NCD and WD fed mice with no apparent compensation by the kidney.
29-30 week old WT and DiC LivKO mice fed normal chow (NCD) or western diet (WD) for 23 weeks were administered 13C-lactate/pyruvate tracer (3.0 g/kg lean mass, 9:1 lactate/pyruvate) and euthanized 30 minutes later, 6 weeks post-AAV EV/Cre injection. A-B. Blood glucose (A) and lactate (B) measured by strip meter before tracer administration and at euthanasia. C-J. Terminal liver (C-F) and kidney (G-J) glucose abundance (C and G) total percent 13C enrichment (F and H) and mass isotopologue distribution (MID) analysis for NCD (G and I) and WD (H and J) fed groups measured by LC-MS. Data are presented as mean ± SEM. Statistical analysis of blood glucose and lactate, glucose abundance, percent total enrichment by two-way ANOVA with Holm-Sidak post-hoc multiple comparison test within NCD and WD groups with significance denoted as $$ p<0.01 for main effects and * p<0.05, ** p<0.01, **** p<0.0001 for multiple comparisons. Statistical analysis of MIDs by t-test for each time point denoted as * p<0.05. N = 9-10 for each group.

References

    1. Mithieux G., Bady I., Gautier A., Croset M., Rajas F., and Zitoun C. (2004). Induction of control genes in intestinal gluconeogenesis is sequential during fasting and maximal in diabetes. Am J Physiol Endocrinol Metab 286, E370–375. 10.1152/ajpendo.00299.2003. - DOI - PubMed
    1. Ekberg K., Landau B.R., Wajngot A., Chandramouli V., Efendic S., Brunengraber H., and Wahren J. (1999). Contributions by kidney and liver to glucose production in the postabsorptive state and after 60 h of fasting. Diabetes 48, 292–298. 10.2337/diabetes.48.2.292. - DOI - PubMed
    1. Zoungas S., Arima H., Gerstein H.C., Holman R.R., Woodward M., Reaven P., Hayward R.A., Craven T., Coleman R.L., Chalmers J., and Collaborators on Trials of Lowering Glucose, g. (2017). Effects of intensive glucose control on microvascular outcomes in patients with type 2 diabetes: a meta-analysis of individual participant data from randomised controlled trials. Lancet Diabetes Endocrinol 5, 431–437. 10.1016/S2213-8587(17)30104-3. - DOI - PubMed
    1. Zoungas S., Chalmers J., Ninomiya T., Li Q., Cooper M.E., Colagiuri S., Fulcher G., de Galan B.E., Harrap S., Hamet P., et al. (2012). Association of HbA1c levels with vascular complications and death in patients with type 2 diabetes: evidence of glycaemic thresholds. Diabetologia 55, 636–643. 10.1007/s00125-011-2404-1. - DOI - PubMed
    1. Visaria J., Iyer N.N., Raval A., Kong S., Hobbs T., Bouchard J., Kern D.M., and Willey V. (2019). Incidence and Prevalence of Microvascular and Macrovascular Diseases and All-cause Mortality in Type 2 Diabetes Mellitus: A 10-year Study in a US Commercially Insured and Medicare Advantage Population. Clin Ther 41, 1522–1536 e1521. 10.1016/j.clinthera.2019.05.012. - DOI - PubMed

Publication types

LinkOut - more resources