[Preprint]. 2024 Sep 14:2024.09.10.612119.
doi: 10.1101/2024.09.10.612119.

Longitudinal Multi-omic Immune Profiling Reveals Age-Related Immune Cell Dynamics in Healthy Adults

Affiliations

Longitudinal Multi-omic Immune Profiling Reveals Age-Related Immune Cell Dynamics in Healthy Adults

Qiuyu Gong et al. bioRxiv. .

Abstract

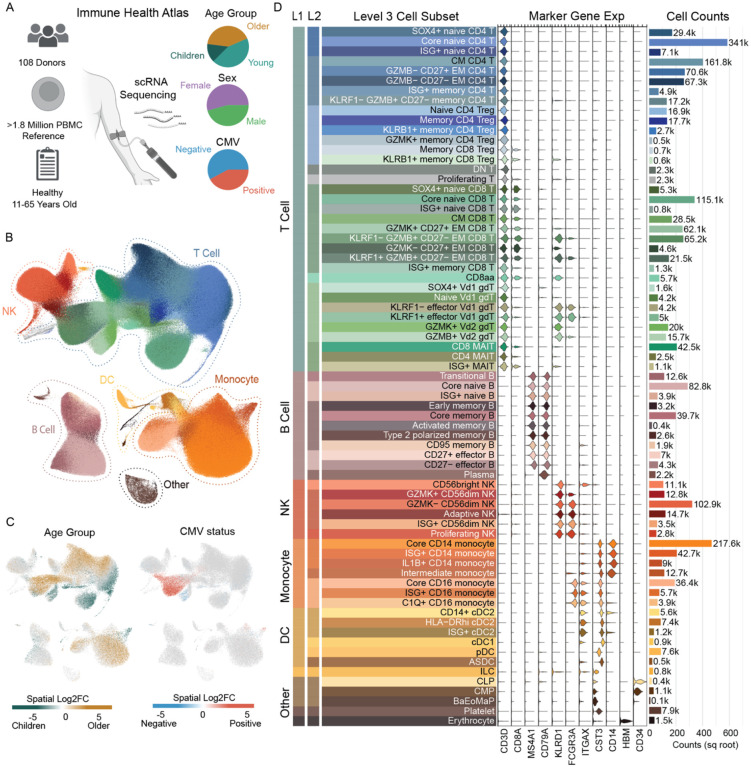
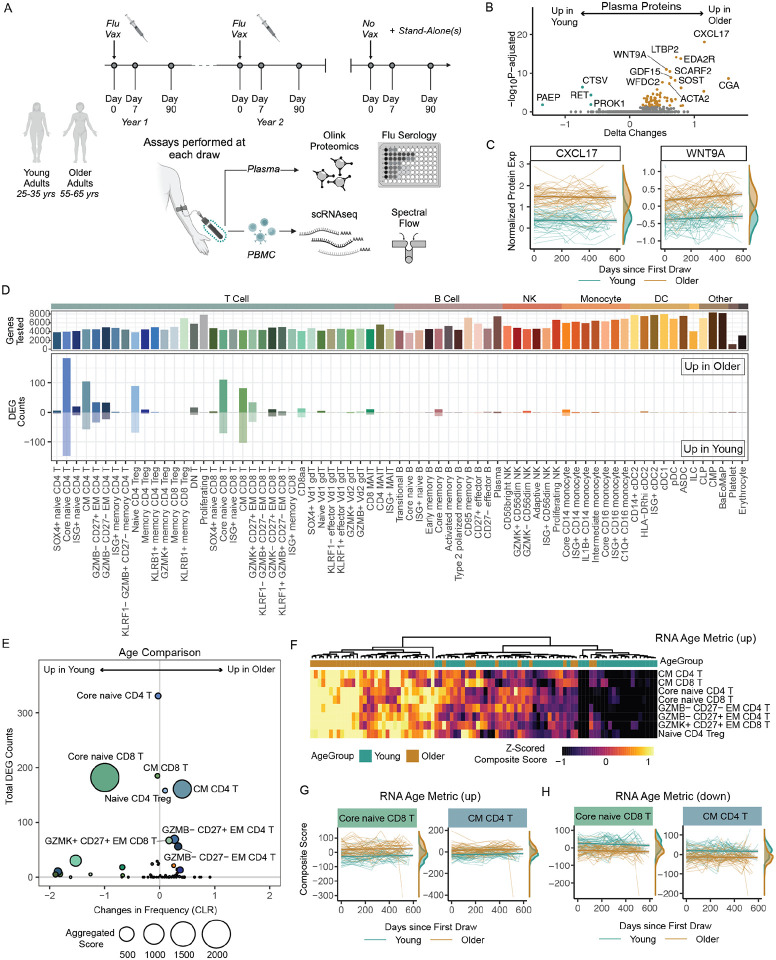
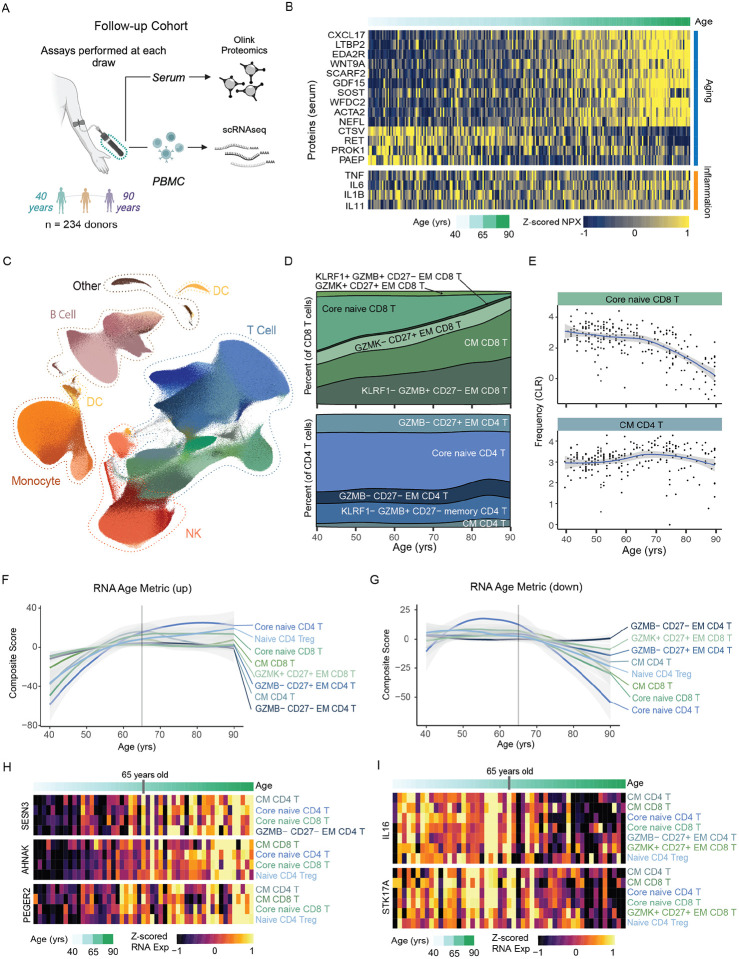
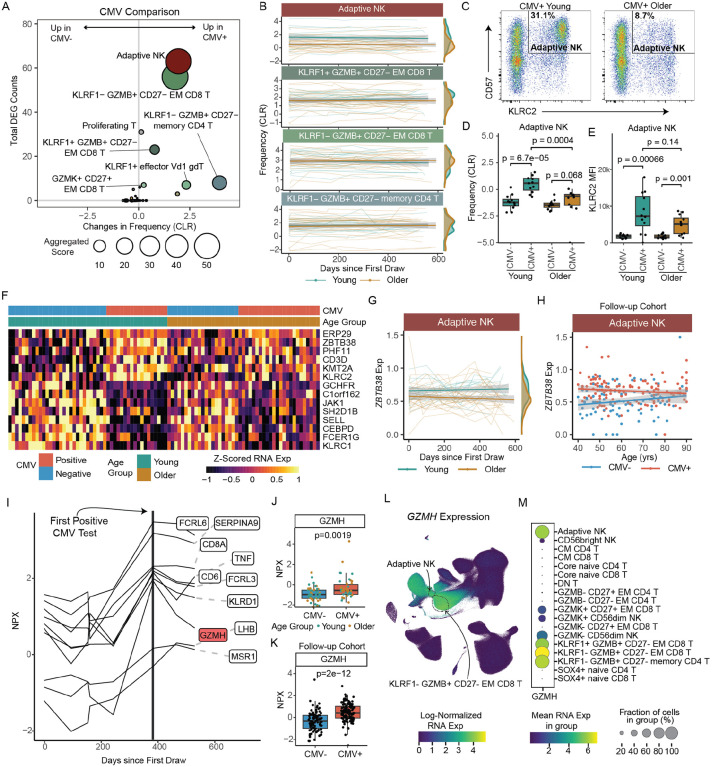
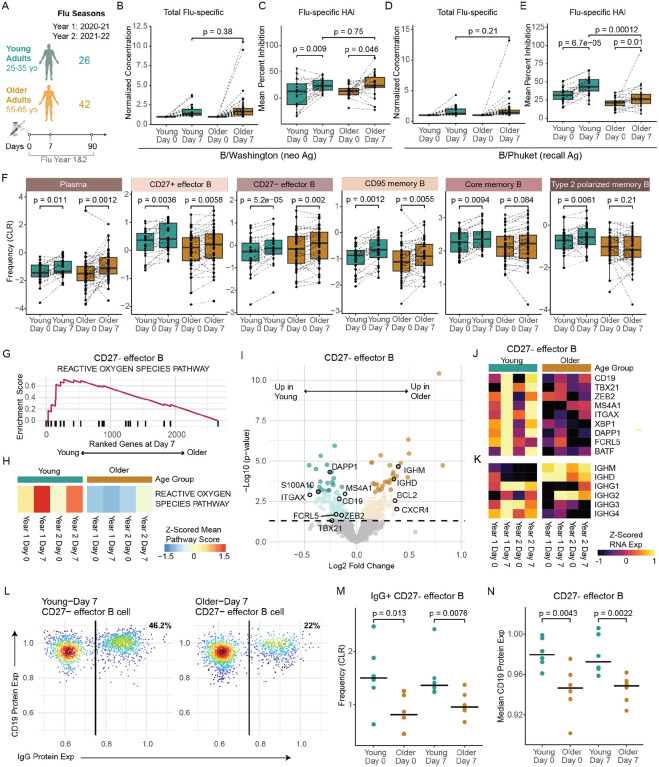
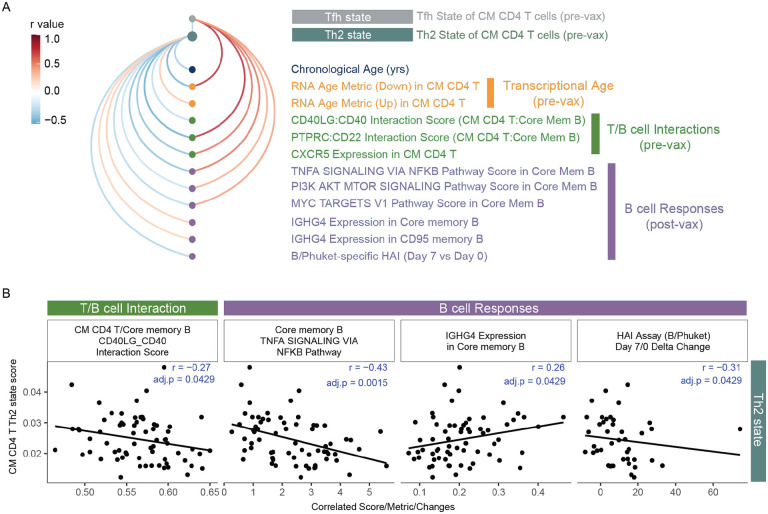
The generation and maintenance of protective immunity is a dynamic interplay between host and environment that is impacted by age. Understanding fundamental changes in the healthy immune system that occur over a lifespan is critical in developing interventions for age-related susceptibility to infections and diseases. Here, we use multi-omic profiling (scRNA-seq, proteomics, flow cytometry) to examined human peripheral immunity in over 300 healthy adults, with 96 young and older adults followed over two years with yearly vaccination. The resulting resource includes scRNA-seq datasets of >16 million PBMCs, interrogating 71 immune cell subsets from our new Immune Health Atlas. This study allows unique insights into the composition and transcriptional state of immune cells at homeostasis, with vaccine perturbation, and across age. We find that T cells specifically accumulate age-related transcriptional changes more than other immune cells, independent from inflammation and chronic perturbation. Moreover, impaired memory B cell responses to vaccination are linked to a Th2-like state shift in older adults' memory CD4 T cells, revealing possible mechanisms of immune dysregulation during healthy human aging. This extensive resource is provided with a suite of exploration tools at https://apps.allenimmunology.org/aifi/insights/dynamics-imm-health-age/ to enhance data accessibility and further the understanding of immune health across age.


Conflict of interest statement

Conflicts of Interest. A.W.G. serves on the scientific advisory boards of ArsenalBio and Foundery Innovations and is a cofounder of TCura. All other authors declare no conflict of interest.

Figures

Figure 1.
Figure 1.. Generation of a high-resolution scRNA-seq atlas of peripheral immune cells from healthy children and adults.
A. Overview of the Human Immune Health Atlas cohort (age range: 11–65 yrs; n=108) and final reference dataset. B. UMAP of immune cell subsets within the Atlas, highlighting major immune cell populations. C. Log2 fold change of clinical metadata features of age and CMV infection status compared using Milo differential abundance testing. Bronze is higher in older adults and Teal is higher in young adults. Red is higher in CMV+ people and blue is higher in CMV people. D. Marker gene expression and cell counts of the 71 immune cell subsets in level 3 of the Atlas. More details about this Atlas can be found at https://apps.allenimmunology.org/aifi/resources/imm-health-atlas/.
Figure 2.
Figure 2.. Maintenance of age-related alterations in the healthy human immune landscape over time.
A. Overview of the longitudinal Sound Life cohort of healthy young (n=49) and older (n=47) adults. B. Volcano plot of the age-related protein expression differences in circulating plasma proteome at baseline (Flu Vax Year 1 Day 0). C. CXCL17 and WNT9A normalized protein expression (NPX) over time in young (teal) and older (bronze) adult plasma. Each donors’ samples are connected by a line. D. The number of differential expressed genes (DEGs) from DEseq2 analysis (log2fc >0.1 and p.adj<0.05) of immune cells subsets from young and older adults at ‘Flu Vax Year 1 Day 0’. E. Bubble plot comparison of the change in frequency (using centered log-ratio (CLR) transformation) and number of DEGs at ‘Flu Vax year 1 day 0’ between young and older adults. Bubble size shows a combined metric of change defined as -log10(p.adj from CLR freq comparison) x DEG_Counts. P.adj for CLR freq was determined using Wilcoxon rank-sum test with Benjamini–Hochberg correction. F. The RNA age metric, calculated as a composite score of the top upregulated DEGs for each subset with >20 DEGs, shown across each donor at Flu Vax Year 1 Day 0. G. RNA age metric (upregulated genes) in select subsets over time in young and older adults. Each donors’ samples are connected with a thin line. H. RNA age metric (downregulated genes) in select subsets over time in young and older adults. Each donors’ samples are connected with a thin line.
Figure 3.
Figure 3.. Dynamics of the healthy human immune landscape across age.
A. Overview of our follow-up cohort of healthy adults (n=234) ranging from 40 – 90 years of age. B. Normalized protein expression (NPX) of select age- and inflammation-related serum proteins in our follow-up cohort, with donors ordered by age. C. UMAP of scRNAseq data generated from our follow-up cohort, totaling a final reference dataset of 3.2 million PBMCs. C. Distribution of immune cells by sex and CMV infection status with the UMAP. D. Composition of CD8 and CD4 T cell compartment across age. E. Frequencies (using centered log-ratio (CLR) transformation) of select T cell subsets within PBMCs across age. Regression line shown with 95% confidence intervals in gray. F. The average RNA Age Metric (upregulated genes) for the top age-impacted immune cell subset, shown across age. Regression line shown with 95% confidence intervals in gray. G. The average RNA Age Metric (downregulated genes) for the top age-impacted immune cell subset, shown across age. Regression line shown with 95% confidence intervals in gray. H-I. Heatmap of mean RNA expression by age in the follow-up cohort for select H. up-regulated and I. down-regulated genes identified from initial DEG analysis.
Figure 4.
Figure 4.. Distinct impact of CMV infection and age on the immune landscape.
A. Bubble plot comparison of the change in frequency (using centered log-ratio (CLR) transformation) and number of DEGs at ‘Flu Vax year 1 day 0’ between CMV+ (n=44) and CMV (n=52) adults. Bubble size shows a combined metric of change defined as −log10(p.adj from CLR freq comparison) x DEG_Counts. B. Select subset frequencies in PBMCs shown over time. Teal dots are young adults. Bronze dots are older adults. Regression line shown. C. Representative flow plots of CD57 and NKG2C (KLRC2 gene) expression within NK cells. Adaptive NKs cells are defined as CD57+NKG2C+ NK cells. D. Adaptive NK cell frequencies and E. NKG2C (KLRC2) MFI expression on adaptive NKs comparing young CMV (n=12), young CMV+ (n=12), older CMV (n=12) and older CMV+ (n=12) adults from spectral flow cytometry analysis. P-values calculated using unpaired Wilcoxon test. F. Heatmap of mean RNA expression levels from upregulated DEGs in adaptive NKs of CMV+ young adults across all individuals in longitudinal cohort (n=96). G. ZBTB38 expression in adaptive NKs (left panel) CMV+ young (n=18) and older (n=24) adults, shown over time (up to 600 days after first blood draw). Teal dots are CMV+ young adults. Bronze dots are CMV+ older adults. Regression line shown. H. ZBTB38 expression in adaptive NKs (right panel) CMV+ (red, n=136) and CMV (blue, n=98) adults across age in our follow-up cohort. I. Normalized expression (NPX-bridged) of plasma proteins in one young adult who converted from CMV to CMV+ over the course of our study. Proteins were considered significant if they had a 1.5 or greater fold change pre- to post-conversion. J. Normalized expression of GZMH protein in plasma of CMV and CMV+ individuals from our longitudinal cohort. Young and older adults are delineated by circle and squares, respectively. K. Normalized expression of GZMH protein in serum of CMV and CMV+ individuals from our follow-up cohort. P-value for J and K were determined by Wilcoxon rank-sum test. L. UMAP of GZMH RNA expression in PBMCs from all individuals in our longitudinal cohort. M. Dot plot of GZMH RNA expression in NK, CD4 T cell and CD8 T cell subsets.
Figure 5.
Figure 5.. Age-associated B cell responses to the influenza vaccine.
A. Number of samples and sampling timepoints across 2 flu seasons in the young and older adult cohorts that received the same seasonal vaccines. B-C. B/Washington and D-E. B/Phuket flu-specific total IgG antibody expression (B, D) in plasma compared to expression at baseline (Day 0) for both young (n=26) and older (n=42) adult cohorts in Flu Vax Year 1 and Mean percent inhibition of flu hemagglutinin (HA) antigen as determined by the HAI assay (C, E) for both young (n=21) and older (n=22) adult cohorts at days 0 and 7 in Flu Vax Year 1. P-values were calculated using Wilcoxon’s signed-rank test (paired) for the comparison between Day 0 and Day 7, and using the Wilcoxon rank-sum test for all other comparisons. F. Peripheral memory and antibody-secreting B cell population frequency changes in young (teal) and older adult (bronze) cohorts pre-vaccination (Day 0), and post-vaccination (Day 7). P-vals determined by Wilcoxon’s signed-rank test (paired). G. Enrichment plot for the top Hallmark pathway in CD27- effector B cells when comparing Day 7 transcriptome between young and older adults after gene set enrichment analysis. H. Sample level enrichment analysis scores for the Hallmark Reactive Oxygen Species Pathway at each timepoint for CD27- effector B cells in young and older adults. I. Volcano plot of DEGs for CD27- Effector B cells between the age cohorts at Day 7 post-vaccination. Highlighted genes are those previously shown to define a flu-specific effector B cell subset in a vaccinated adult cohort. Dark teal and bronze dots signify significantly different genes, and light-colored dots indicate nominal significance, while gray dots indicate no significance between age cohorts. J-K. Longitudinal expression of selected genes by CD27- effector B cell subset, averaged for each age cohort at each timepoint. L. Representative flow cytometry plot of CD19 and IgG protein expression on CD27- effector B cells in young and older adults at day 7 post-vaccination, based on flow cytometry analysis of 6 young and 6 older adult subjects that overlap with the scRNA data cohort. M. CLR-transformed frequency comparison of surface IgG+ CD27- effector B cells pre- and post-vaccination in young and older adults, as determined by flow cytometry. P-values were determined by Wilcoxon rank sum test with the alternative hypothesis ‘less’. N. Median surface CD19 protein expression comparison on CD27- effector B cells pre- and post-vaccination in young and older adults, as determined by flow cytometry. P-values were determined by Wilcoxon rank sum test with the alternative hypothesis ‘less’.
Figure 6.
Figure 6.. Accumulation of an altered transcriptional state in central memory T cells with age.
A. Graphical representation of T cell and B cell interactions. B. Receptor-ligand interaction prediction between CM CD4 T cells and core memory B cells in young (n=47) and older (n=49) adults from a single time point (Flu Year 1 Day 0). C. CD40LG in CM CD4 T cells and CD40 in core memory B cells across age in our follow-up cohort (n=234). Regression line shown with 95% confidence intervals in gray. D. Triangle plots of Th1-, Th2- and Th17- cell state scores in CM CD4 T cells from young (teal) and older (bronze) adults. E. Th2 cell state scores in CM CD4 T cells over time in young (teal) and older (bronze) adults. Regression line shown with 95% confidence intervals in gray. F. Triangle plots of Th1-, Th2- and Th17- cell state scores in CM CD4 T cells from our follow-up cohort (n=234). G. GATA3 and TBX21 transcription factor (TF) activity based on Chromvar analysis of TEA-seq data in CM CD4 T cells from children (n=8) and older adults (n=8). H. Spearman correlation between GATA3 TF activity and Th2 cell state score in CM CD4 T cells from the TEA-seq dataset (n=16). I. Chromatin accessibility tracks of the IL4 gene region in CM CD4 T cell subsets, showing normalized read coverage.
Figure 7.
Figure 7.. Age-related transcriptional states of central memory CD4 T associated with memory B cell response to influenza vaccination.
A. Arc plot of Th2 and Tfh cell states in CM CD4 T cells correlations with features of age, T cell - B cell interactions and B cell responses to flu vaccination. Only correlations with pval <0.05 are shown. B. Select Spearman correlations of Th2 state with T-B interactions and B cell responses.

References

    1. Akondy Rama S., Fitch Mark, Edupuganti Srilatha, Yang Shu, Kissick Haydn T., Li Kelvin W., Youngblood Ben A., et al. 2017. “Origin and Differentiation of Human Memory CD8 T Cells after Vaccination.” Nature 552 (7685): 362–67. - PMC - PubMed
    1. Alpert Ayelet, Pickman Yishai, Leipold Michael, Rosenberg-Hasson Yael, Ji Xuhuai, Gaujoux Renaud, Rabani Hadas, et al. 2019. “A Clinically Meaningful Metric of Immune Age Derived from High-Dimensional Longitudinal Monitoring.” Nature Medicine 25 (3): 487–95. - PMC - PubMed
    1. Argentieri M. Austin, Xiao Sihao, Bennett Derrick, Winchester Laura, Nevado-Holgado Alejo J., Albukhari Ashwag, Yao Pang, et al. 2023. “Proteomic Aging Clock Predicts Mortality and Risk of Common Age-Related Diseases in Diverse Populations.” BioRxiv. 10.1101/2023.09.13.23295486. - DOI - PMC - PubMed
    1. Bates Douglas, Martin Mächler Ben Bolker, and Walker Steve. 2014. “Fitting Linear Mixed-Effects Models Using Lme4.” ArXiv [Stat.CO]. arXiv. http://arxiv.org/abs/1406.5823.
    1. Bayard Charles, Lepetitcorps Hélène, Roux Antoine, Larsen Martin, Fastenackels Solène, Salle Virginie, Vieillard Vincent, et al. 2016. “Coordinated Expansion of Both Memory T Cells and NK Cells in Response to CMV Infection in Humans.” European Journal of Immunology 46 (5): 1168–79. - PubMed

Publication types