[Preprint]. 2024 Sep 10:2024.09.10.612343.
doi: 10.1101/2024.09.10.612343.

Hypoxia and loss of GCM1 expression prevents differentiation and contact inhibition in human trophoblast stem cells

Affiliations

Hypoxia and loss of GCM1 expression prevents differentiation and contact inhibition in human trophoblast stem cells

Jessica K Cinkornpumin et al. bioRxiv. .

Update in

Abstract

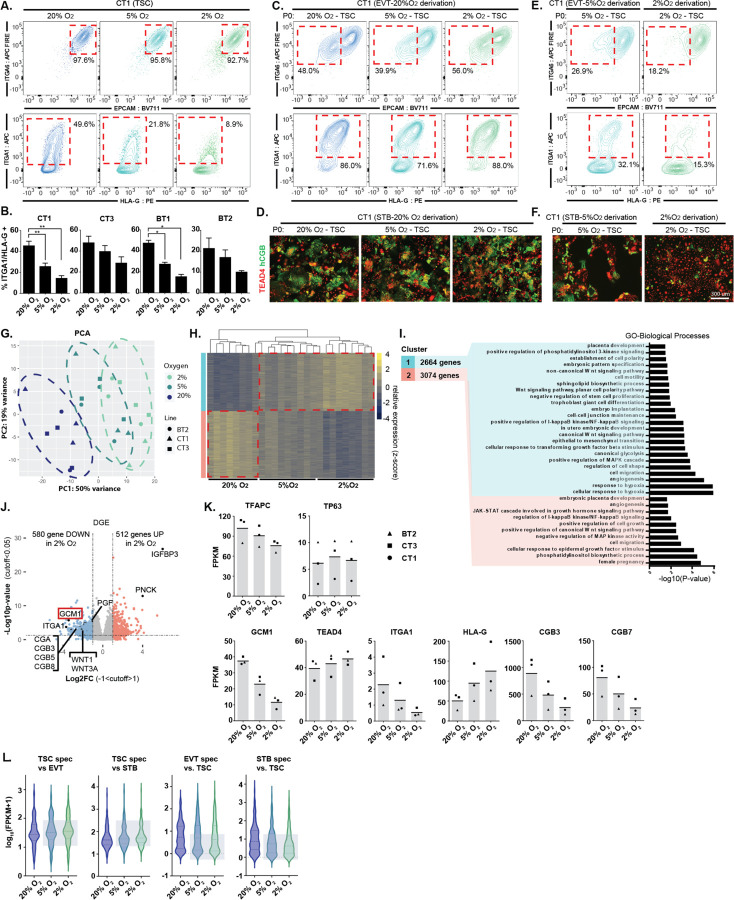
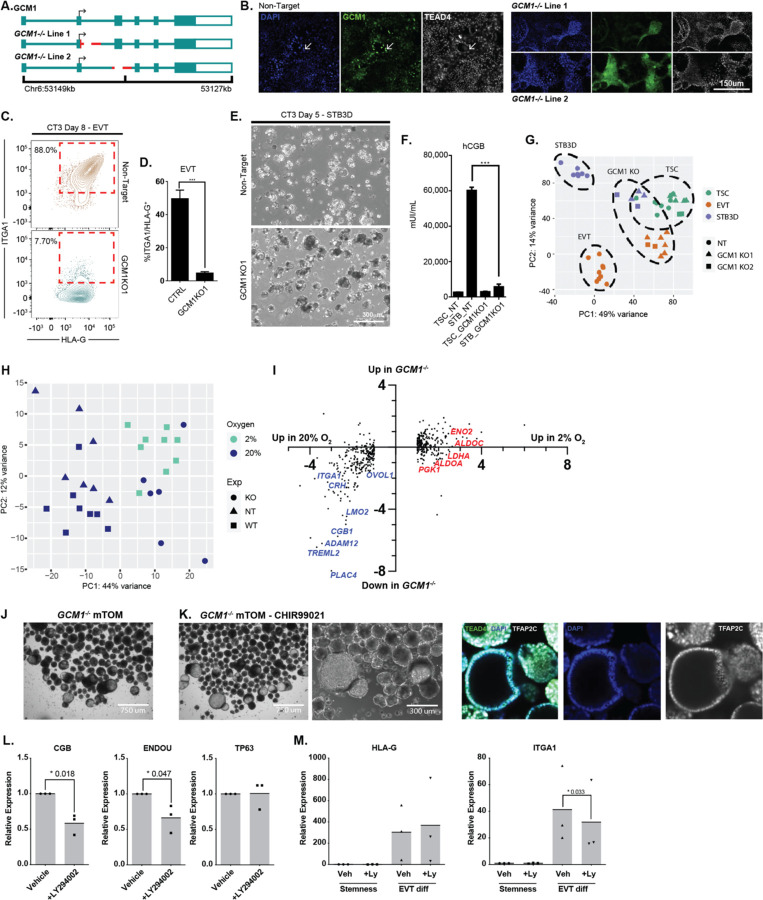
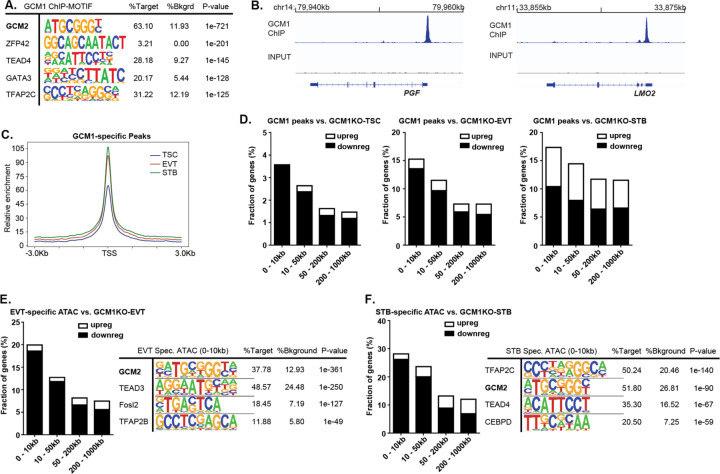
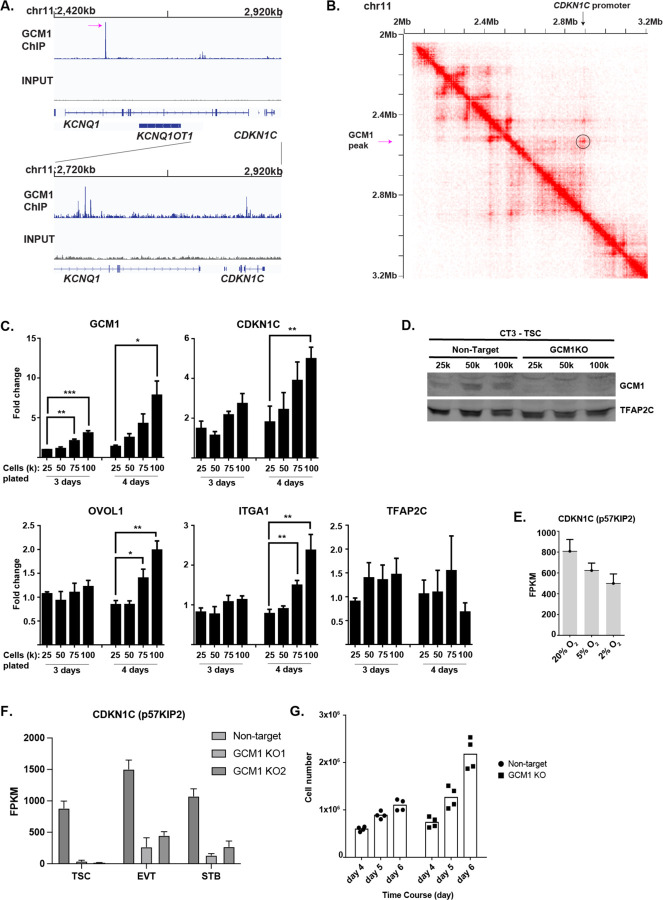
The placenta develops alongside the embryo and nurtures fetal development to term. During the first stages of embryonic development, due to low blood circulation, the blood and ambient oxygen supply is very low (~1-2% O2) and gradually increases upon placental invasion. While a hypoxic environment is associated with stem cell self-renewal and proliferation, persistent hypoxia may have severe effects on differentiating cells and could be the underlying cause of placental disorders. We find that human trophoblast stem cells (hTSC) thrive in low oxygen, whereas differentiation of hTSC to trophoblast to syncytiotrophoblast (STB) and extravillous trophoblast (EVT) is negatively affected by hypoxic conditions. The pro-differentiation factor GCM1 (human Glial Cell Missing-1) is downregulated in low oxygen, and concordantly there is substantial reduction of GCM1-regulated genes in hypoxic conditions. Knockout of GCM1 in hTSC caused impaired EVT and STB formation and function, reduced expression of differentiation-responsive genes, and resulted in maintenance of self-renewal genes. Treatment with a PI3K inhibitor reported to reduce GCM1 protein levels likewise counteracts spontaneous or directed differentiation. Additionally, chromatin immunoprecipitation of GCM1 showed enrichment of GCM1-specific binding near key transcription factors upregulated upon differentiation including the contact inhibition factor CDKN1C. Loss of GCM1 resulted in downregulation of CDKN1C and corresponding loss of contact inhibition, implicating GCM1 in regulation of this critical process.

Keywords: CDKN1C; GCM1; cell column; cytotrophoblast; differentiation; extravillous trophoblast; hypoxia; placenta; placental villi; syncytiotrophoblast; trophoblast stem cell.


Figures

Figure 1.
Figure 1.. Reduced and impaired hTSC differentiation in hypoxic conditions.
A. Trophoblast stem cells were cultured for 72hrs in varying levels of oxygen (20%, 5%, 2% O2). Flow cytometry plots indicate levels of hTSC (ITGA6, EPCAM) and EVT (ITGA1, HLA-G) markers. Note reduction in ITGA1+ population in low O2. B. ITGA1+ HLA-G+ population in O2 and cell line indicated (n=3 replicates for each cell line). C. EVT differentiation in 20% O2 starting with hTSC in oxygen concentration indicated. Successful differentiation is indicated by the upregulation of surface markers ITGA1 and HLA-G and downregulation of EPCAM and ITGA6. D. STB differentiation in 20% O2 starting with hTSC in oxygen concentration indicated. STB formation is indicated by loss of TEAD4 and increase in hCGB staining in a cell. E. EVT differentiation undertaken at oxygen level indicated. F. STB differentiation undertaken at oxygen level indicated. G. Principle component analysis (PCA) showing gene expression from hTSC cultured in varying oxygen concentrations. (3 cell lines; BT2, CT1, CT3; n=3 replicates for each line in each condition, except BT2 at 20% O2 n=2). H. Hierarchical gene clustering of RNA-seq samples in (G). Red dotted lines indication the shift in gene expression from 20% O2 and 2% O2 labeled as Cluster 1 and Cluster 2. I. GSEA analysis of Cluster 1 and Cluster 2. J. Volcano plot showing gene expression differences between TSCs cultured in 20% O2 to TSCs cultured in 2% O2. Dashed lines indicate significance and Log2 fold-change cutoff. K. Bar graphs showing FPKM of specific genes of interest (same samples as in G). L. Violin plot showing expression of genes specific to hTSC, EVT or STB for hTSCs grown in the indicated oxygen concentration.
Figure 2.
Figure 2.. Impaired differentiation upon genetic or chemical reduction in GCM1 level.
A. Strategies for mutation of GCM1 using a two sgRNA CRISPR approach. Lines were generated by deletion of the exon2/intron2 boundary, and by ablation of exon 3, either of which should disrupt the DBD of GCM1. B. Immunofluorescence staining of GCM1 and TEAD4 in control (Non-target, NT sgRNA) and GCM1−/− hTSC. Sporadic GCM1+ TEAD4lo hTSCs are present only in NT control hTSCs. C. Flow cytometric analysis from EVT differentiation of GCM1−/− Line 1 and NT control TSC. NT hTSC differentiation produced ITGA1hi/HLA-Ghi cells whereas GCM1−/− TSC did not. D. Bar graphs showing formation of ITGA1hi/HLA-Ghi population from control and GCM1−/− TSC (n=5 replicates). E. 3D-STB formation of NT and GCM1−/− hTSC. Control hTSCs form a fluid-filled syncytium while GCM1−/− form a cluster of cells. F. hCGB ELISA was performed using supernatant from GCM1−/− and control hTSC (n=5 replicates). G. PCA comparing NT and GCM1−/− hTSC, EVT, and STB3D. Note that GCM1−/− cells regardless of differentiation state cluster closer to the hTSC population, and similarity of GCM1−/− lines 1 and 2 (n=8 replicates for EVT, n= for STB3D). H. PCA of control (NT) and GCM1−/− hTSCs, compared with WT hTSCs grown at different O2 concentrations. Note that GCM1−/− hTSCs cluster on PC axis 1 with WT hTSCs grown at 2% O2. I. Scatterplot of genes differentially regulated in hypoxia (same set as Figure 1J) showing their relative expression in 2% and 20% O2 and their relative expression in GCM1−/− hTSC and control cells. Examples of placental differentiation genes are shown in blue, while genes involved in glycolysis are shown in red. J. Brightfield images of GCM1−/− TB-ORG cultured in mTOM media. K. (left) Brightfield images of GCM1−/− TB-ORG culture in mTOM media-CHIR99021 (right) Immunofluorescent staining for trophoblast markrers in GCM1−/− TB-ORG. K. Expression of genes associated with differnetiation (CGB, ENDOU) or stemness (TP63), normalized to the housekeeping gene TBP, in steady state conditions with 5μM LY294002 inhibitor or vehicle control (n=3 replicates). L. Expression of EVT genes upon differntiation to EVT with 5μM LY294002 inhibitor or vehicle control (n=3 replicates).
Figure 3.
Figure 3.. GCM1 positively regulates differentiation-associated genes.
A. Motif analysis of GCM1 binding sites shows very strong enrichment for GCM motif, indicating successful and specific ChIP. B. GCM1 enrichment over PGF (left) and LMO2 (right). C. ATAC-seq enrichment in TSC, EVT and STB over GCM1 binding sites. D. Plot showing the percentage of genes whose promoters are within a given distance of a GCM1 binding site that show upregulation or downregulation in GCM1−/− cells. E. Plot showing the percentage of genes whose promoters are within a given distance of an EVT-specific ATAC-seq site that show upregulation or downregulation in GCM1−/− cells (left), motif analysis for EVT-specific peaks (right) F. Plot showing the percentage of genes whose promoters are within a given distance of an STB-specific ATAC-seq site that show upregulation or downregulation in GCM1−/− cells (left), motif analysis for STB-specific peaks (right).
Figure 4.
Figure 4.. GCM1 positively regulates CDKN1C and contact inhibition.
A. GCM1 enrichment over imprinted KCNQ locus. B. HiC interaction data over the GCM1 locus. Note physical association between GCM1 binding site and CDKN1C promoter. In B and C, the highest GCM1 peaks is indicated with a magenta arrow. C. Expression of genes indicated in plating conditions (cell number and growth time) indicated. Note that plating at higher densities leads to higher expression of GCM1 and CDKN1C. D. GCM1 protein levels increase with higher confluence. E. Expression of CDKN1C in oxygen concentration indicated. F. Expression of CDKN1C in control and GCM1−/− Line 1 and Line 2 hTSC and differentiated cells. G. Cell number after plating 50k cells and allowing cells to grow for indicated number of days. Note a leveling off in non-targeting cells as cell lines reach confluence, but continued growth in GCM1−/− hTSCs.

References

    1. Huppertz B. (2007). The feto-maternal interface: setting the stage for potential immune interactions. Semin Immunopathol 29, 83–94. 10.1007/s00281-007-0070-7. - DOI - PubMed
    1. Chazaud C., and Yamanaka Y. (2016). Lineage specification in the mouse preimplantation embryo. Development 143, 1063–1074. 10.1242/dev.128314. - DOI - PubMed
    1. Lyall F., Bulmer J.N., Kelly H., Duffie E., and Robson S.C. (1999). Human trophoblast invasion and spiral artery transformation: the role of nitric oxide. Am J Pathol 154, 1105–1114. 10.1016/S0002-9440(10)65363-1. - DOI - PMC - PubMed
    1. Hamilton W.J., and Boyd J.D. (1960). Development of the human placenta in the first three months of gestation. J Anat 94, 297–328. - PMC - PubMed
    1. Hemberger M., Hanna C.W., and Dean W. (2020). Mechanisms of early placental development in mouse and humans. Nat Rev Genet 21, 27–43. 10.1038/s41576-019-0169-4. - DOI - PubMed

Publication types