[Preprint]. 2024 Sep 13:2024.09.13.612863.
doi: 10.1101/2024.09.13.612863.

Cytoplasmic ribosomes hitchhike on mitochondria to dendrites

Affiliations

Cytoplasmic ribosomes hitchhike on mitochondria to dendrites

Corbin J Renken et al. bioRxiv. .

Abstract

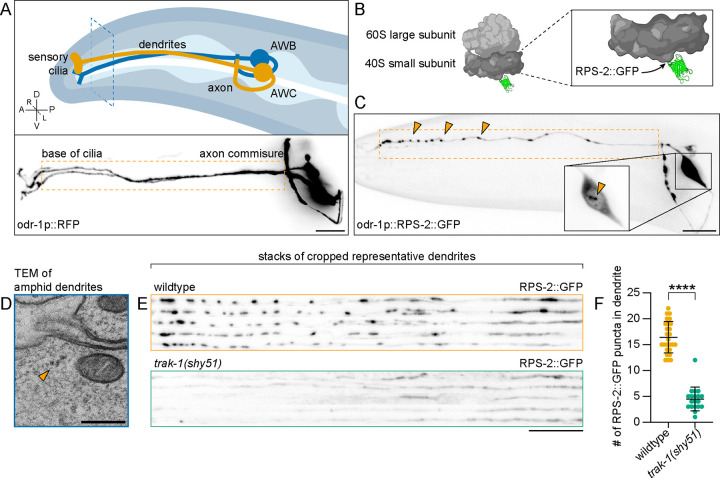
Neurons rely on local protein synthesis to rapidly modify the proteome of neurites distant from the cell body. A prerequisite for local protein synthesis is the presence of ribosomes in the neurite, but the mechanisms of ribosome transport in neurons remain poorly defined. Here, we find that ribosomes hitchhike on mitochondria for their delivery to the dendrite of a sensory neuron in C. elegans. Ribosomes co-transport with dendritic mitochondria, and their association requires the atypical Rho GTPase MIRO-1. Disrupting mitochondrial transport prevents ribosomes from reaching the dendrite, whereas ectopic re-localization of mitochondria results in a concomitant re-localization of ribosomes, demonstrating that mitochondria are required and sufficient for instructing ribosome distribution in dendrites. Endolysosomal organelles that are involved in mRNA transport and translation can associate with mitochondria and ribosomes but do not play a significant role in ribosome transport. These results reveal a mechanism for dendritic ribosome delivery, which is a critical upstream requirement for local protein synthesis.


Figures

Figure 1.
Figure 1.. Ribosomes are stereotypically positioned in the dendrites of AWB and AWC
(A) Top: schematic of the chemosensory neurons AWB and AWC. Dashed blue lines indicate region presented in (D). Compass rose: D = dorsal, V = ventral, A = anterior, P = posterior, R = right, L = left. Bottom: cytosolic RFP expression in AWB and AWC driven by the odr-1p promoter. Dashed orange lines indicate the dendritic region presented throughout this study. Scale bar, 10 μm. (B) Schematic of RPS-2::GFP incorporation into the ribosome. (C) Representative confocal image (maximum intensity z-projection) of RPS-2::GFP localization in AWB and AWC neurons at larval stage L4. Dashed orange lines mark the dendrite, and orange arrowheads indicate dendritic RPS-2 puncta. Inset shows cell body, and orange arrowhead indicates nucleoli. Image is linearly adjusted for brightness and contrast and grayscale inverted. Scale bar, 10 μm. (D) Transmission electron micrograph of an amphid dendrite. Orange arrowhead indicates a polysome. Scale bar, 200 nm. (E) Representative images of RPS-2::GFP expression in wildtype animals compared to trak-1(shy51). For each genotype, a stack of five representative dendrites is shown. Dendrites are straightened and cropped to the first 80 μm of the dendrite beginning from the base of the cilium. Scale bar, 10 μm. (F) Quantification of (E). Number of RPS-2::GFP puncta per dendrite in wildtype versus trak-1(shy51) mutants. Student’s t-test; n = 26 and 19 animals. Bars indicate mean and SD. ****p < 0.0001
Figure 2.
Figure 2.. Ribosomes colocalize with mitochondria in the dendrite.
(A) Confocal images of mitoRFP and RPS-2::GFP colocalization in the dendrite. Yellow arrow indicates region of linescan in (C) The linescan was measured exactly 1 μm beneath the yellow arrow. Scale bar, 10 μm. (B) Confocal images of mitoRFP and RPS-2::GFP localization in a single focal plane of the AWB cell body. Yellow arrow indicates region of linescan in (D). Scale bar, 2 μm. (C-D) Linescans of normalized fluorescence intensity across the dendrite (C) or AWB cell body (D) indicated by yellow arrows in (A) and (B). (E) Pearson’s Correlation Coefficient quantifying (A) and (B). Student’s t-test; n = 32 and 16 measurements. Soma measurements taken from subset of animals with dendrite measurements. Bars indicate mean and SD. (F) Representative scanning electron microscopy images of mitochondria with associated polysomes in oblique cross sections through the amphid dendrites. Magenta arrowheads indicate mitochondria; green arrowheads indicate polysomes. Data from Witvliet et al. (2021). Scale bar, 200 nm. (G) Quantification of (F). n = 18 mitochondria from 1 animal; bars indicate mean and SD. ****p < 0.0001
Figure 3.
Figure 3.. Mitochondria are necessary and instructive for dendritic ribosome positioning.
(A) Model of adaptor complex for microtubule minus-end-directed mitochondria transport in C. elegans, as proposed by Zhao et al. (2021). (B-H) Representative confocal images demonstrating localization of mitoRFP and RPS-2::GFP in the dendrites of wildtype (B), dli-1 (C), trak-1 (D), miro-1 (E), mtx-2 (F), miro-1; mtx-2 (G), and ric-7 (H) worms. Scale bar, 10 μm. (I and J) Quantification of (B-H). n = 29–39 animals. One-way ANOVA with Dunnett’s multiple comparisons test. Bars indicate mean and SD. Comparison of dendritic mitochondria counts (I) or RPS-2 puncta (J) in the dendrite in each genetic background tested. (K) Same data from (I) and (J) plotted against each other to compare the numbers of dendritic mitochondria and RPS-2 puncta. Pearson’s Correlation Coefficient; r(230)=0.9676, p<0.0001. (L and M) Representative transmission electron microscopy images of cross-sections through the AWC dendrite in a wildtype (L) and miro-1; mtx-2 double mutant (M) worm. Magenta arrowheads indicate mitochondria; green arrowheads indicate polysomes. Scale bar, 200 nm. (N and O) Quantification of (L) and (M). The number of mitochondria profiles (N) or polysomes (O) observed per 55 nm cross-section through the left amphid bundle (comprised of twelve dendrites). Nonparametric Mann-Whitney test, n = 36 serial sections at 55 nm thickness (~2 μm total depth). Bars indicate mean and SD. (P) Schematic of chimeric MitoTruck construct. (Q and R) Representative confocal images of dendritic mitoRFP and RPS-2::GFP localization in indicated genotypes. (S) Quantification of (Q) and (R). n = 14–30 animals. Student’s t-test; n = 30 and 28 animals. Bars indicate mean and SD. ****p < 0.0001; **p < 0.01
Figure 4.
Figure 4.. miro-1 dependent co-transport of ribosomes with mitochondria.
(A) Representative kymographs of mitoRFP and RPS-2::GFP movements in the proximal dendrite, generated from a 10 min movie with a 10 sec framerate. White arrowheads indicate examples of co-transport between RPS-2::GFP and mitoRFP. Magenta arrowheads indicate example of a motile mitochondrion lacking associated RPS-2::GFP. Horizontal scale bar, 10 μm; vertical scale bar, 2 min. (B-C) Quantification of (A), n=36 animals.. (B) Fisher’s exact test comparing the relationship between motility and RPS-2 association amongst mitochondria (two-tailed p <0.0001). (C) Quantification of wildtype mitochondrion length grouped by motility and presence of RPS-2. n = 631, null, 146, and 123 mitochondria from 36 animals. One-way ANOVA with Tukey’s post-hoc test. Bars indicate mean and SD. (D) Representative kymographs of dendritic mitoRFP and RPS-2::GFP movement in a miro-1 mutant background. Magenta arrowheads indicate example of a motile mitochondrion lacking associated RPS-2::GFP. Horizontal scale bar, 10 μm; vertical scale bar, 2 min. (E) Quantification of (D). Fisher’s exact test as in (B). (F) Quantification of the number of mitochondria per dendrite in wildtype versus miro-1 mutants, grouped by motility and presence of RPS-2. Student’s t-tests; n = 35 animals for wildtype and 27 animals for miro-1. ns = not significant; ****p < 0.0001
Figure 5.
Figure 5.. RAB-7 colocalizes with RPS-2 and mitochondria in the dendrite.
(A) Confocal images of RPS-2::GFP and BFP::RAB-5 localization in the dendrite. Scale bar, 10 μm. (B) Quantification of (A). Number of BFP::RAB-5 puncta in the dendrite, and percentage of BFP::RAB-5 puncta with “(+)” and without “(−)” associated RPS-2::GFP signal. n = 15 animals. (C) Confocal images of RPS-2::GFP and LMP-2::BFP localization in the dendrite. Above: scale of images is the same as (A). White box indicates region of inset. Below, inset: high-magnification view of RPS-2::GFP and LMP-2::BFP in the distal dendrite. White scale bar, 2 μm. (D) Quantification of (C). Number of LMP-2::BFP puncta in the dendrite, and percentage of LMP-2::BFP puncta with and without associated RPS-2::GFP signal. n = 40 animals. (E) Confocal images of RPS-2::GFP and BFP::RAB-7 localization in the dendrite. Scale bar, 10 μm. (F) Quantification of (E). Number of BFP::RAB-7 puncta in the dendrite, and percentage of BFP::RAB-7 puncta with and without associated RPS-2::GFP signal. n = 20 animals. (G) Confocal images of GFP::RAB-7 and mitoRFP localization in the dendrite. Scale bar, 10 μm. (H) Quantification of (G). Percentage of GFP::RAB-7 puncta with and without associated mitochondria, and percentage of mitochondria with and without associated GFP::RAB-7 signal. n = 31 animals.
Figure 6.
Figure 6.. Ribosome localization to mitochondria is independent of RAB-7 enrichment.
(A and B) Confocal images of dendritic RPS-2::GFP, mitoRFP, and BFP::RAB-7 localization in wildtype (A) and miro-1 (B) genetic backgrounds. (C) Quantification of (A) and (B). Number of BFP::RAB-7 puncta per dendrite in wildtype versus miro-1 mutants. Student’s t-test; n = 20 and 35 animals. Bars indicate mean and SD. The puncta counts for wildtype animals are the same as those displayed in Figure 5 F. (D) As in (A), with additional MitoTruck expression. (E) Quantification of (D). Percentage of MitoTruck-expressing worms with and without an accumulation of BFP::RAB-7 at the tip of the dendrite. n = 25 animals. (F) Confocal images of RPS-2::GFP, mitoRFP and BFP::RAB-7 in the unc-16 mutant background. White box indicates region of inset. Right, inset: high-magnification view of all three markers in the distal dendrite. Hollow magenta arrowheads indicate mitochondria with associated RPS-2::GFP that lack enrichment of BFP::RAB-7 signal. White scale bar, 5 μm. (G) Quantification of (F). Of mitochondria in unc-16 mutants that lack BFP::RAB-7 enrichment, percentage with and without associated RPS-2. n = 10 animals. ****p < 0.0001. Black scale bars, 10 μm.

References

    1. Arimoto M., Koushika S.P., Choudhary B.C., Li C., Matsumoto K., and Hisamoto N.. 2011. The Caenorhabditis elegans JIP3 Protein UNC-16 Functions As an Adaptor to Link Kinesin-1 with Cytoplasmic Dynein. J. Neurosci. 31:2216–2224. doi:10.1523/JNEUROSCI.2653-10.2011. - DOI - PMC - PubMed
    1. Arslan M., Karadag M., Onal E., Gelinci E., Cakan-Akdogan G., and Kalyoncu S.. 2022. Effect of non-repetitive linker on in vitro and in vivo properties of an anti-VEGF scFv. Sci. Rep. 12:5449. doi:10.1038/s41598-022-09324-4. - DOI - PMC - PubMed
    1. Baumann S.J., Grawenhoff J., Rodrigues E.C., Speroni S., Gili M., Komissarov A., and Maurer S.P.. 2022. APC couples neuronal mRNAs to multiple kinesins, EB1, and shrinking microtubule ends for bidirectional mRNA motility. Proc. Natl. Acad. Sci. 119:e2211536119. doi:10.1073/pnas.2211536119. - DOI - PMC - PubMed
    1. Béthune J., Jansen R.-P., Feldbrügge M., and Zarnack K.. 2019. Membrane-Associated RNA-Binding Proteins Orchestrate Organelle-Coupled Translation. Trends Cell Biol. 29:178–188. doi:10.1016/j.tcb.2018.10.005. - DOI - PubMed
    1. Bodian D. 1965. A suggestive relationship of nerve cell rna with specific synaptic sites*. Proc. Natl. Acad. Sci. 53:418–425. doi:10.1073/pnas.53.2.418. - DOI - PMC - PubMed

Publication types

LinkOut - more resources