[Preprint]. 2024 Sep 14:2024.09.10.612328.
doi: 10.1101/2024.09.10.612328.

Subcellular Level Spatial Transcriptomics with PHOTON

Affiliations

Subcellular Level Spatial Transcriptomics with PHOTON

Shreya Rajachandran et al. bioRxiv. .

Update in

Abstract

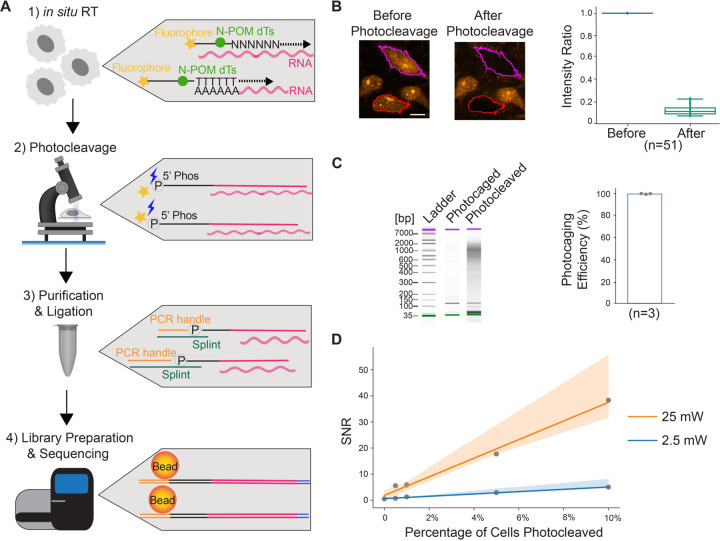
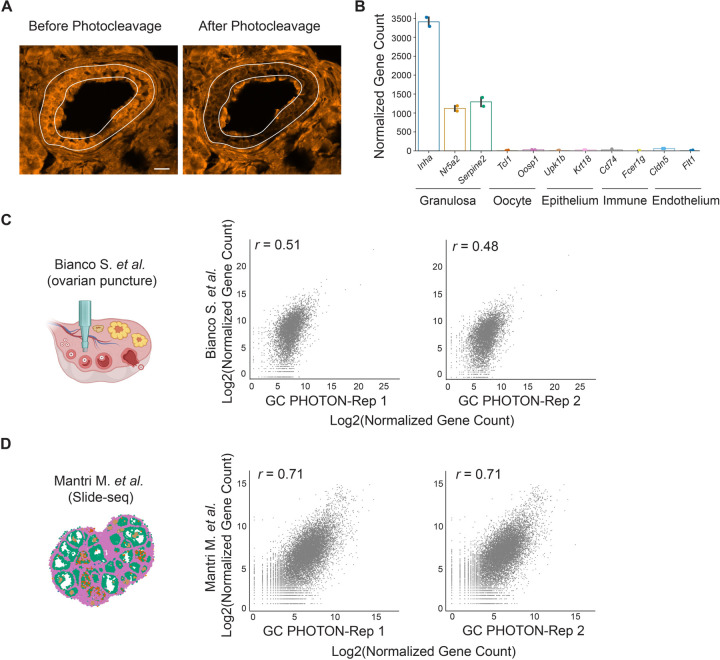
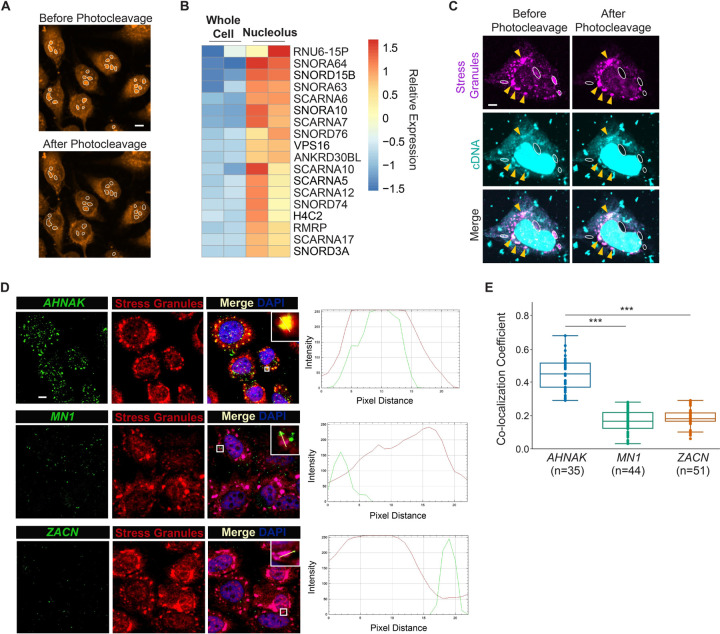
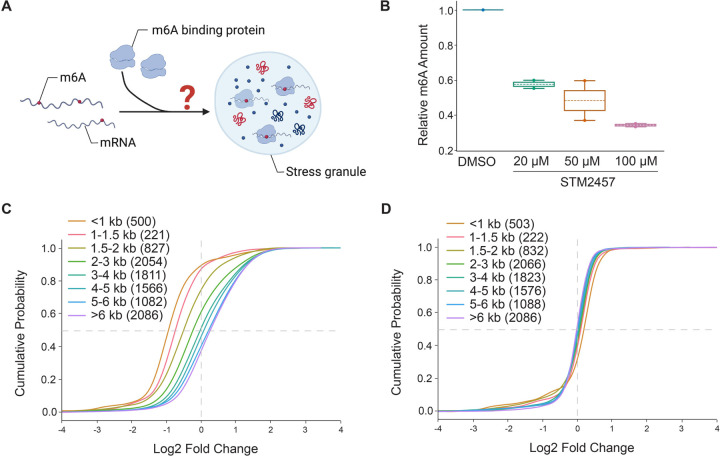
The subcellular localization of RNA is closely linked to its function. Many RNA species are partitioned into organelles and other subcellular compartments for storage, processing, translation, or degradation. Thus, capturing the subcellular spatial distribution of RNA would directly contribute to the understanding of RNA functions and regulation. Here, we present PHOTON (Photoselection of Transcriptome over Nanoscale), a method which combines high resolution imaging with high throughput sequencing to achieve spatial transcriptome profiling at subcellular resolution. We demonstrate PHOTON as a versatile tool to accurately capture the transcriptome of target cell types in situ at the tissue level such as granulosa cells in the ovary, as well as RNA content within subcellular compartments such as the nucleolus and the stress granule. Using PHOTON, we also reveal the functional role of m6A modification on mRNA partitioning into stress granules. These results collectively demonstrate that PHOTON is a flexible and generalizable platform for understanding subcellular molecular dynamics through the transcriptomic lens.


Conflict of interest statement

H.C., S.M.M, and F.C. are on a patent related to this work. F.C. is an academic founder of Curio Biosciences and Doppler Biosciences, and scientific advisor for Amber Bio.

Figures

Figure 1.
Figure 1.. PHOTON enables spatially resolved transcriptome profiling.
(A) Schematic diagram illustrating the PHOTON method. First, in situ RT is performed using photocleavable RT primers. Second, targeted illumination is performed within specific ROIs identified by fluorescence imaging. Exposure of the cDNA molecules to near-UV light modifies the N-POM-caged dTs and breaks the photocleavable linkers on the RT primers, releasing the fluorescent labels and revealing the phosphate groups. Third, nucleic acids are purified, and PCR handles are ligated to previously photocleaved cDNA molecules through splint oligos. Finally, successfully ligated cDNA molecules are pulled down using streptavidin beads and a template switching step is performed with TSOs. Following PCR amplification, sequencing libraries are generated and read by next-generation sequencing. (B) Photocleavage of cDNA molecules in HeLa cells. The color-outlined cells were exposed to 25 mW 405 nm laser light which cleaved the fluorophores from the RT primers and resulted in an 86.9% (±4.3% s.d.) intensity decrease (n = 51 cells, 1 experiment). Scale bar, 5 µm. (C) Measuring the efficiency of the PHOTON photocaging mechanism. Left: tapestation gel image of a representative experiment; Right: bar graph showing the photocaging efficiency of PHOTON (n = 3 experiments). On average, 99.1 ± 0.26% of the photocaged cDNA molecules could not be amplified without near-UV light exposure. (D) SNR of PHOTON as a function of the fraction of cells selected under two different laser powers.
Figure 2.
Figure 2.. PHOTON captures spatial transcriptomics data of granulosa cells in the mouse ovary.
(A) Morphologically guided targeting of GCs in the adult mouse ovarian tissue slices. A secondary follicle was visualized by the fluorescence of the photocaged cDNA molecules. Scale bar, 15 µm. (B) Expression levels of ovarian cell type marker genes revealed by PHOTON. (C) Comparison between the mouse GC transcriptome generated by the follicle isolation method and that generated by PHOTON. (D) Comparison between the mouse GC transcriptome generated by Slide-seqV2 and that generated by PHOTON.
Figure 3.
Figure 3.. PHOTON captures transcriptome information within subcellular compartments.
(A) Representative images of photocleaving cDNA molecules within nucleoli (white outlines). Scale bar, 2 µm. (B) Heatmap showing the top-enriched RNA species in the nucleolus identified using the PHOTON data. (C) Representative images of photocleaving cDNA molecules (cyan) in SGs (magenta). SGs with white dashed outlines were targeted for photocleavage, while others such as those with yellow arrow heads were not. Scale bar, 1 µm. (D) HCR-FISH images showing the spatial distribution of AHNAK, MN1, and ZACN mRNAs (green) in relation to SGs (red). Line graphs on the right show the intensity profiles of both the mRNA signal (green line) and the SG signal (red line) along the yellow line in the inserts. Scale bar, 2 µm. (E) Co-localization coefficient of the mRNA and SG signals for AHNAK, MN1, and ZACN. ***, p < 0.001. One-way ANOVA followed by Tukey test.
Figure 4.
Figure 4.. PHOTON reveals the functional role of m6A in mRNA recruitment into SGs.
(A) m6A modifications may facilitate the partitioning of mRNAs into SGs through m6A-binding proteins. (B) Dose-dependent depletion of mRNA m6A modifications using METTL3 inhibitor STM2457. (C) Cumulative distribution plot of transcript abundance in the SGs of normal HeLa cells, binned based on the transcript length. Numbers in the parentheses indicate the number of transcripts in each bin. (D) Cumulative distribution plot of transcript abundance in SGs of STM2457 (100 μM)-treated HeLa cells, binned based on the transcript length. Numbers in the parentheses indicate the number of transcripts in each bin.

References

    1. Buxbaum A.R., Haimovich G., and Singer R.H., In the right place at the right time: visualizing and understanding mRNA localization. Nat Rev Mol Cell Biol, 2015. 16(2): p. 95–109. - PMC - PubMed
    1. Fasken M.B. and Corbett A.H., Mechanisms of nuclear mRNA quality control. RNA Biol, 2009. 6(3): p. 237–41. - PubMed
    1. Pamula M.C. and Lehmann R., How germ granules promote germ cell fate. Nat Rev Genet, 2024. - PubMed
    1. Anderson P. and Kedersha N., RNA granules. J Cell Biol, 2006. 172(6): p. 803–8. - PMC - PubMed
    1. Anderson P. and Kedersha N., RNA granules: post-transcriptional and epigenetic modulators of gene expression. Nat Rev Mol Cell Biol, 2009. 10(6): p. 430–6. - PubMed

Publication types

LinkOut - more resources