[Preprint]. 2024 Sep 14:2024.09.10.612232.
doi: 10.1101/2024.09.10.612232.

Quantitative cytoarchitectural phenotyping of deparaffinized human brain tissues

Affiliations

Quantitative cytoarchitectural phenotyping of deparaffinized human brain tissues

Danila Di Meo et al. bioRxiv. .

Abstract

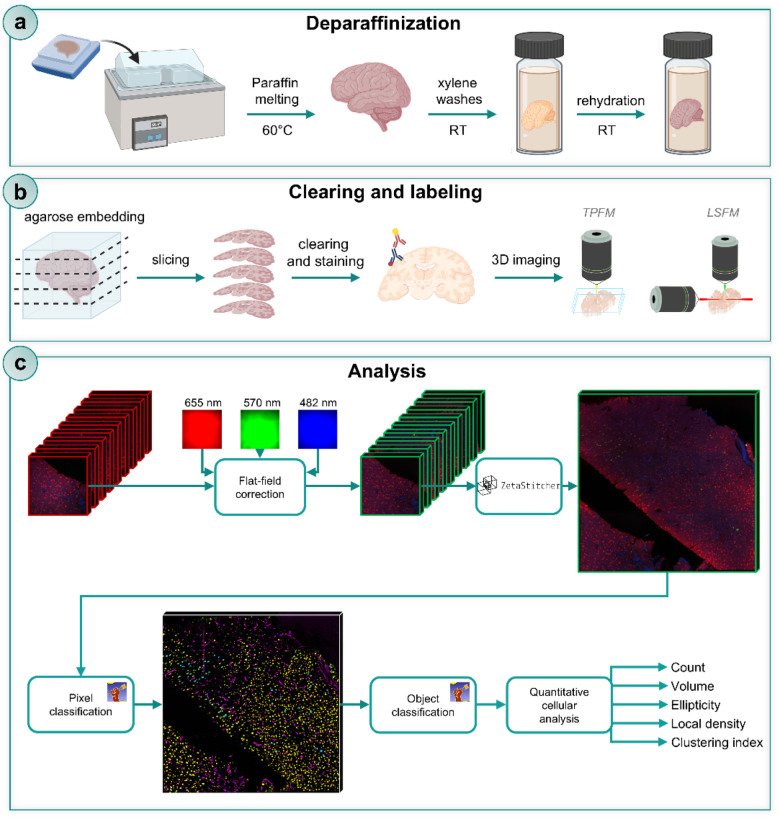
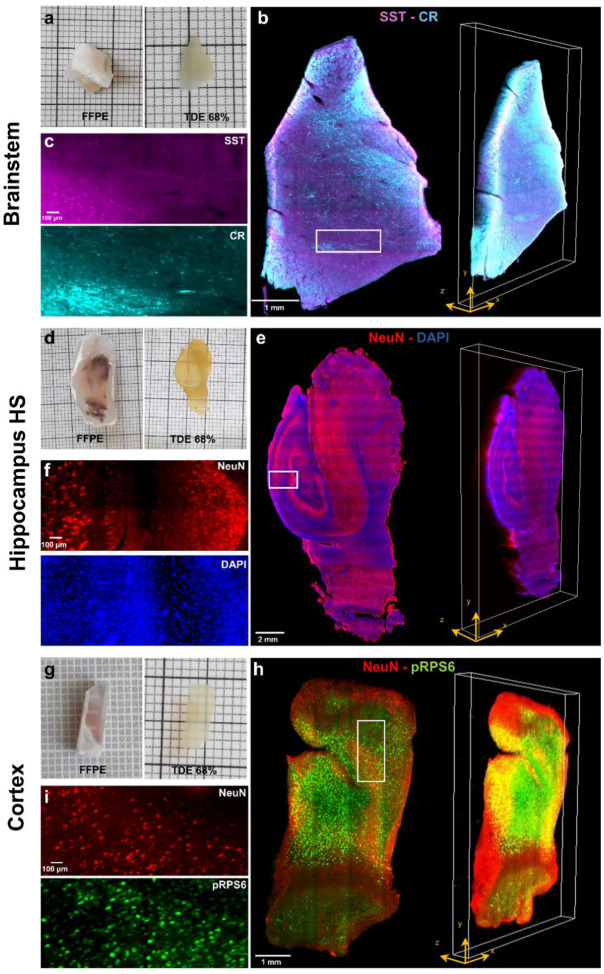
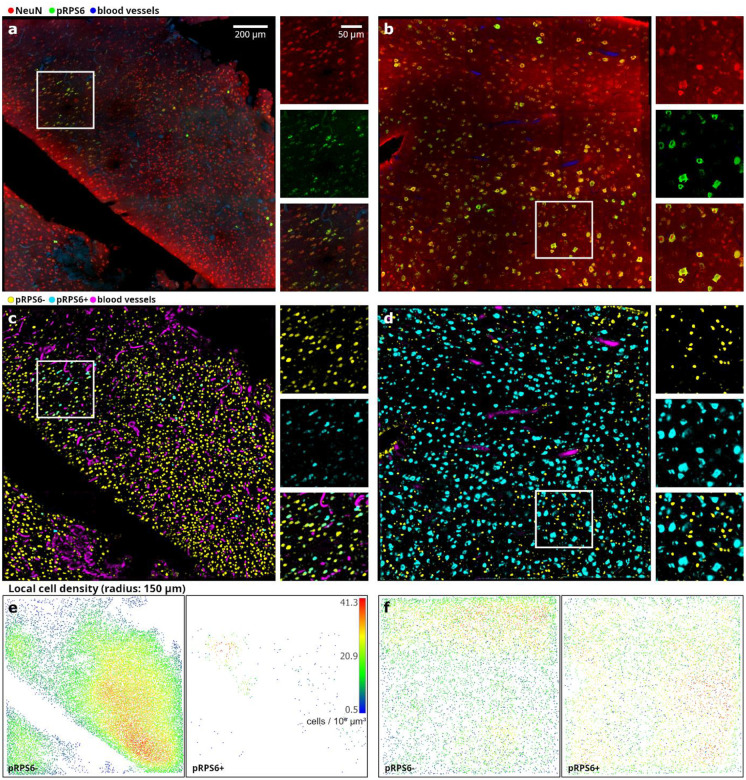
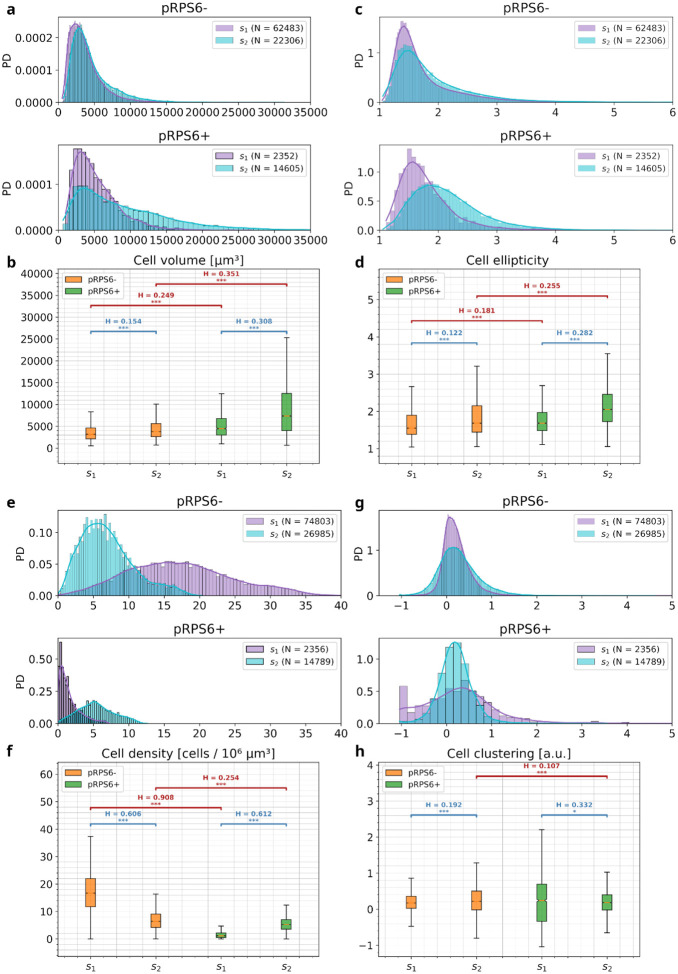
Advanced 3D imaging techniques and image segmentation and classification methods can profoundly transform biomedical research by offering deep insights into the cytoarchitecture of the human brain in relation to pathological conditions. Here, we propose a comprehensive pipeline for performing 3D imaging and automated quantitative cellular phenotyping on Formalin-Fixed Paraffin-Embedded (FFPE) human brain specimens, a valuable yet underutilized resource. We exploited the versatility of our method by applying it to different human specimens from both adult and pediatric, normal and abnormal brain regions. Quantitative data on neuronal volume, ellipticity, local density, and spatial clustering level were obtained from a machine learning-based analysis of the 3D cytoarchitectural organization of cells identified by different molecular markers in two subjects with malformations of cortical development (MCD). This approach will grant access to a wide range of physiological and pathological paraffin-embedded clinical specimens, allowing for volumetric imaging and quantitative analysis of human brain samples at cellular resolution. Possible genotype-phenotype correlations can be unveiled, providing new insights into the pathogenesis of various brain diseases and enlarging treatment opportunities.


Figures

Figure 1.
Figure 1.. Overview of the entire pipeline for deparaffinization, clearing, labeling, imaging, automated neuronal segmentation and analysis.
Schematic representation of the entire pipeline. a) Deparaffinization of FFPE (Formalin-Fixed Paraffin-Embedded) adult and pediatric human brain tissues. b) Clearing and labeling of deparaffinized slabs with the SHORT tissue transformation method, followed by volumetric imaging with LSFM (Light Sheet Fluorescence Microscopy) and TPFM (Two Photon Fluorescent Microscopy) custom-made setup. c) Block diagram of the 3D image processing pipeline for quantitative cytoarchitectural analysis of TPFM images. Adjacent overlapping TPFM image stacks first undergo flat-field correction using spatial gain models estimated with the CIDRE retrospective method. ZetaStitcher is then used to align the corrected stacks in order to create high-resolution image reconstructions of the brain specimens. Supervised pixel and object random forest classifiers, trained using the ilastik interactive machine learning tool, assess these reconstructions in sequence to automatically identify pRPS6+ and pRPS6− neuronal bodies. Finally, quantitative structural and morphological features are evaluated.
Figure 2.
Figure 2.. 3D reconstructions with LSFM of deparaffinized human brain slabs processed with the SHORT tissue transformation method
a) Image of a postmortem adult human brainstem, before deparaffinization (FFPE) and after SHORT (TDE 68%). b) Maximum intensity projection image (3.64 μm isotropic resolution) and volumetric rendering showing a mesoscopic reconstruction of (a) labeled for Somatostatin (SST, magenta) and Calretinin (CR, cyan). Scale bar: 1 mm. c) Insets of (b) showing the single markers used, SST, (magenta) and CR (cyan). Scale bar: 100 μm. d) Image of a postsurgical human hippocampus from a patient with hippocampal sclerosis (HS), before deparaffinization (FFPE) and after SHORT (TDE 68%). e) Maximum intensity projection image and volumetric rendering showing a mesoscopic reconstruction of (d) labeled for NeuN (red) and DAPI (blue). Scale bar: 2 mm. f) Insets of (e) showing the single markers used, NeuN (red) and DAPI (blue). Scale bar: 100 μm. g) Image of a postsurgical brain specimen from a pediatric patient with focal cortical dysplasia type IIa (FCDIIa), before deparaffinization (FFPE) and after SHORT (TDE 68%). h) Maximum intensity projection image and volumetric rendering showing a mesoscopic reconstruction of (g) labeled for NeuN (red) and pRPS6 (green). Scale bar: 1 mm. i) Insets of (h) showing the single markers used, NeuN (red) and pRPS6 (green). Scale bar: 100 μm. The insets in (c), (f), and (i) refer to the regions in white boxes in (b), (e) and (h).
Figure 3.
Figure 3.. Volumetric imaging with TPFM and analysis on surgically removed pediatric brain specimens
a-b) Representative middle plane of mesoscopic reconstructions obtained with TPFM (1.2 μm × 1.2 μm × 2 μm resolution) are shown for surgically removed brain pieces from patients affected by hemimegalencephaly (S1, a) and focal cortical dysplasia type IIa (S2, b). Tissues were labeled for NeuN (red) and pRPS6 (green) while blood vessels were detected through autofluorescence (blue). Scale bar: 200 μm. On the right the magnified insets showing the single markers used. Scale bar: 50 μm. The insets images refer to the regions in white boxes. c-d) Corresponding 3D semantic segmentations generated using ilastik’s pixel classification workflow (headless prediction on a distributed computer cluster). Yellow: pRPS6− neurons; cyan: pRPS6+ neurons; magenta: blood vessels. Background suppression shows striking accuracy. e-f) Local cell density maps respectively generated from the TPFM reconstructions in a-b (left: pRPS6− neurons; right: pRPS6+ neurons).
Figure 4.
Figure 4.. Quantitative observed cytoarchitectural analysis on pediatric human brain specimens
Quantitative cytoarchitectural analysis of neuronal body morphology (a, b: cell volume; c, d: cell ellipticity) and spatial organization (e, f: local cell density; g, h: clustering index). PD: probability density; *** p < 0.00017, ** p < 0.00167, Mann-Whitney U-Test (Bonferroni correction); H: Hellinger distance between the compared data distributions.

Similar articles

References

    1. Amunts K, Mohlberg H, Bludau S, Zilles K (2020) Julich-Brain: A 3D probabilistic atlas of the human brain’s cytoarchitecture. Science 369:988–992. doi: 10.1126/science.abb4588 - DOI - PubMed
    1. Amunts K, Zilles K (2015) Architectonic Mapping of the Human Brain beyond Brodmann. Neuron 88:1086–1107. doi: 10.1016/j.neuron.2015.12.001 - DOI - PubMed
    1. Banik G, Betts CB, Liudahl SM, Sivagnanam S, Kawashima R, Cotechini T, Larson W, Goecks J, Pai SI, Clayburgh DR, Tsujikawa T, Coussens LM (2020) High-dimensional multiplexed immunohistochemical characterization of immune contexture in human cancers. In: Methods in Enzymology. Elsevier, pp 1–20 - PMC - PubMed
    1. Berg S, Kutra D, Kroeger T, Straehle CN, Kausler BX, Haubold C, Schiegg M, Ales J, Beier T, Rudy M, Eren K, Cervantes JI, Xu B, Beuttenmueller F, Wolny A, Zhang C, Koethe U, Hamprecht FA, Kreshuk A (2019) ilastik: interactive machine learning for (bio)image analysis. Nat Methods 16:1226–1232. doi: 10.1038/s41592-019-0582-9 - DOI - PubMed
    1. Bhattacharya K, Maiti S, Mandal C (2016) PTEN negatively regulates mTORC2 formation and signaling in grade IV glioma via Rictor hyperphosphorylation at Thr1135 and direct the mode of action of an mTORC1/2 inhibitor. Oncogenesis 5:e227–e227. doi: 10.1038/oncsis.2016.34 - DOI - PMC - PubMed

Publication types

LinkOut - more resources