[Preprint]. 2024 Sep 17:2024.09.09.612110.
doi: 10.1101/2024.09.09.612110.

Epigenomic, transcriptomic and proteomic characterizations of reference samples

Affiliations

Epigenomic, transcriptomic and proteomic characterizations of reference samples

Chirag Nepal et al. bioRxiv. .

Abstract

A variety of newly developed next-generation sequencing technologies are making their way rapidly into the research and clinical applications, for which accuracy and cross-lab reproducibility are critical, and reference standards are much needed. Our previous multicenter studies under the SEQC-2 umbrella using a breast cancer cell line with paired B-cell line have produced a large amount of different genomic data including whole genome sequencing (Illumina, PacBio, Nanopore), HiC, and scRNA-seq with detailed analyses on somatic mutations, single-nucleotide variations (SNVs), and structural variations (SVs). However, there is still a lack of well-characterized reference materials which include epigenomic and proteomic data. Here we further performed ATAC-seq, Methyl-seq, RNA-seq, and proteomic analyses and provided a comprehensive catalog of the epigenomic landscape, which overlapped with the transcriptomes and proteomes for the two cell lines. We identified >7,700 peptide isoforms, where the majority (95%) of the genes had a single peptide isoform. Protein expression of the transcripts overlapping CGIs were much higher than the protein expression of the non-CGI transcripts in both cell lines. We further demonstrated the evidence that certain SNVs were incorporated into mutated peptides. We observed that open chromatin regions had low methylation which were largely regulated by CG density, where CG-rich regions had more accessible chromatin, low methylation, and higher gene and protein expression. The CG-poor regions had higher repressive epigenetic regulations (higher DNA methylation) and less open chromatin, resulting in a cell line specific methylation and gene expression patterns. Our studies provide well-defined reference materials consisting of two cell lines with genomic, epigenomic, transcriptomic, scRNA-seq and proteomic characterizations which can serve as standards for validating and benchmarking not only on various omics assays, but also on bioinformatics methods. It will be a valuable resource for both research and clinical communities.


Conflict of interest statement

Competing interests Andrew Farmer is an employee of Takara Bio USA, Inc., and Wendell Jones is an employee of Q2 Solution company. All other authors claim there are no conflicts of interest. The views presented in this article do not necessarily reflect the current or future opinion or policy of the US Food and Drug Administration. Any mention of commercial products is for clarification and not intended as an endorsement.

Figures

Figure 1.
Figure 1.. Study design and bioinformatics workflow.
HCC1395 and HCC1395BL represent a breast cancer cell line and “normal” (i.e., immortalized) B lymphocyte cell line, respectively. ATAC-seq, RRBS, RNA-seq and proteomic analyses were performed on three replicates of both cell lines. Each data type was analyzed using standard analytical pipelines. ATAC-seq and DNA methylation were analyzed to understand correlation between two layers of epigenetics in relation to genomic CG density. Gene expression was correlated with epigenetic marks and protein expression.
Figure 2.
Figure 2.. Open chromatin landscape of HCC1395 and HCC1395BL cell lines.
(a) A UCSC browser view showing 3 replicates of ATAC-seq coverage of HCC1395 (red) and HCC1395BL (blue) cell lines. ATAC peaks region are shown as red and blue rectangular bars. (b) Bar plot shows the number of ATAC peaks from three replicates. Peaks identified in all three replicates are defined as consensus peaks. (c) Venn diagram shows the overlap of ATAC peaks from the HCC1395 and HCC1395 cell lines. (d) Distribution of ATAC peaks with respect to promoter, intragenic, and intergenic regions. (e) Distribution of ATAC peaks with respect to CpG islands (CGI). (f) Mean counts of ATAC peaks overlapping promoter, intragenic, and intergenic regions. Peaks from each region are further classified based on overlap with CpG islands (CGIs). P-values were calculated using t-tests by comparing CGI and nonCGI groups across promoter, intragenic, and intergenic regions. (g) Box plots show the distribution of ATAC peak width across promoter, intragenic, and intergenic regions, which were classified into two groups based on overlap with CGIs.
Figure 3.
Figure 3.. DNA methylation landscape of HCC1395 and HCC1395BL.
(a) Distribution of beta value of CG methylation. Beta value ranged between 0–1 and are divided into 10 bins. (b) Mean methylation levels of all expressed genes. Gene length is scaled between transcription start sites (TSS) and transcription end site (TES). (c) A UCSC browser view showing the gene SKI and CpG islands (CGIs) overlapping promoter and intragenic regions. Mean methylation levels of HCC1395 and HCC1395BL are represented as beta values in the range of 0–1. CGIs overlapping promoters have low methylation levels while four intragenic CGIs have high methylation levels. (d) Mean methylation levels of promoter CGIs (left panel) and intragenic CGIs (right panel) and 2 KB flanking CGIs. The Y axis represents the mean methylation level (beta value). (e) ATAC signals in promoter CGIs (left panel), intragenic CGIs (right panel), and 2 KB flanking regions. The Y axis represents the mean ATAC signal measured in RPKM.
Figure 4.
Figure 4.. Association of CG density, open chromatin, and CG methylation.
(a) ATAC peaks overlapping CpG islands (CGIs) (left panel) and non-overlapping CGIs (right panel) in the HCC1395 cell line. ATAC peaks are grouped into 4 bins based on decreasing CG density. (b) Same as in A, but for HCC1395 cell line. (c–d) CG methylation levels of ATAC peaks overlapping CpG islands (CGIs) (left panel) and non-overlapping CGIs (right panel) in HCC1395 (c) and HCC1395BL (d). ATAC peaks are grouped into 4 bins based on decreasing CG density. The Y axis indicates methylation level (Beta values) which range between 0–1.
Figure 5.
Figure 5.. Gene expression profile of the HCC1395 and HCC1395BL cell lines.
(a) Number of reference and alternative transcripts expressed in HCC1395 (left panel) and HCC1395BL (right panel). Alternative promoters were depleted for CpG islands (CGIs). (b) Violin plots show mean expression levels across three replicates for HCC1395 (left panel) and HCC1395BL (right panel). P-values were computed using two-sided t-test. (c) The coverage of ATAC-seq reads around genes transcription start site (TSS). Genes are classified into four bins based on expression levels separately for CGI promoters and nonCGI promoters. (d) Same as in E, for HCC1395BL cell line. (e–f) UMAP clusters of HCC1395 and HCC1395BL (f). (g–h) Percentage of single cells in clusters that express CGI promoter genes (on left) and nonCGI promoter genes (on right). Boxplots show that CGI promoter genes were expressed in a greater number of cells than nonCGI promoter genes in the same cluster. (i–j) Average expression levels CGI promoters and nonCGI promoters’ genes by excluding genes in single cells with zero counts. The mean expression level of CGI promoters was higher than for nonCGI promoters.
Figure 6.
Figure 6.. Projection of HCC1395 and HCC1395BL ATAC peaks across 23 tumor tissues from TCGA.
(a)Overlap of HCC1395 cell line ATAC peaks with the ATAC peaks from 23 different tumor tissues across The Cancer Genome Atlas (TCGA). The majority of HCC1395 CpG islands (CGIs) ATAC peaks (left panel) have detected open chromatin in other tissue types. HCC1395 nonCGI ATAC peaks (right panel) are detected at low levels in other tissue types. X axis indicates the percentage of overlap of HCC1395 ATAC peaks with ATAC peaks from different tumor tissues. (b) Same as in a, but for HCC1395BL cell line. (c) Schematic representation to show the influence of genomic CG density on epigenetic features (ATAC peaks and DNA methylation) and gene expression.
Figure 7.
Figure 7.. Proteomics map of HCC1395 and HCC1305BL cell lines.
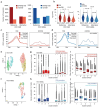
(a) A UCSC genome browser view (reverse strand) showing peptides identified by MS/MS spectra that mapped to two UniProt isoforms of PFN2 (P35080–1 and P35080–2). These isoforms share exons 1 and 2 but have different third exons resulting from alternative splicing. Peptides common to both isoforms are colored magenta. Peptides unique to P35080–1 and P35080–2 are colored blue and red respectively. Peptides overlapping in each transcript are summed up to quantify protein expression levels. (b) Bar plots show individual protein expression levels of each spliced isoform across three replicates for both HCC1395 and HCC1305BL cells lines. (c) Number of peptide isoforms detected per gene. The majority (98.5%) of genes have only one detected peptide. (d–e) Correlation of gene expression and protein expression levels. Gene expression and protein levels are positively correlated in HCC1395 (R=0.477) and HCC1395BL (R=0.474). (f–g) Average protein expression levels of genes grouped based on overlap with CpG islands (CGI) in their promoters. Genes overlapping CGI have significantly higher protein expression levels in HCC1395 (F) and HCC1395BL (G). P-value was calculated using a t-test.

References

    1. Fang L.T. et al. Establishing community reference samples, data and call sets for benchmarking cancer mutation detection using whole-genome sequencing. Nat Biotechnol 39, 1151–1160 (2021). - PMC - PubMed
    1. Zhao Y. et al. Whole genome and exome sequencing reference datasets from a multi-center and cross-platform benchmark study. Sci Data 8, 296 (2021). - PMC - PubMed
    1. Xiao W. et al. Toward best practice in cancer mutation detection with whole-genome and whole-exome sequencing. Nat Biotechnol 39, 1141–1150 (2021). - PMC - PubMed
    1. Gazdar A.F. et al. Characterization of paired tumor and non-tumor cell lines established from patients with breast cancer. Int J Cancer 78, 766–74 (1998). - PubMed
    1. Kao J. et al. Molecular profiling of breast cancer cell lines defines relevant tumor models and provides a resource for cancer gene discovery. PLoS One 4, e6146 (2009). - PMC - PubMed

Publication types