[Preprint]. 2024 Sep 12:2024.09.06.611754.
doi: 10.1101/2024.09.06.611754.

Nutrient starvation activates ECM remodeling gene enhancers associated with inflammatory bowel disease risk in fibroblasts

Affiliations

Nutrient starvation activates ECM remodeling gene enhancers associated with inflammatory bowel disease risk in fibroblasts

Stefano Secchia et al. bioRxiv. .

Abstract

Nutrient deprivation induces a reversible cell cycle arrest state termed quiescence, which often accompanies transcriptional silencing and chromatin compaction. Paradoxically, nutrient deprivation is associated with activated fibroblast states in pathological microenvironments in which fibroblasts drive extracellular matrix (ECM) remodeling to alter tissue environments. The relationship between nutrient deprivation and fibroblast activation remains unclear. Here, we report that serum deprivation extensively activates transcription of ECM remodeling genes in cultured fibroblasts, despite the induction of quiescence. Starvation-induced transcriptional activation accompanied large-scale histone acetylation of putative distal enhancers, but not promoters. The starvation-activated putative enhancers were enriched for non-coding genetic risk variants associated with inflammatory bowel disease (IBD), suggesting that the starvation-activated gene regulatory network may contribute to fibroblast activation in IBD. Indeed, the starvation-activated gene PLAU, encoding uPA serine protease for plasminogen and ECM, was upregulated in inflammatory fibroblasts in the intestines of IBD patients. Furthermore, the starvation-activated putative enhancer at PLAU, which harbors an IBD risk variant, gained chromatin accessibility in IBD patient fibroblasts. This study implicates nutrient deprivation in transcriptional activation of ECM remodeling genes in fibroblasts and suggests nutrient deprivation as a potential mechanism for pathological fibroblast activation in IBD.


Conflict of interest statement

DECLARATION OF INTERESTS The authors declare no competing interests.

Figures
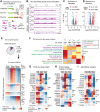
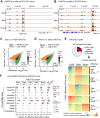
Figure 1.
Figure 1.. Serum starvation upregulates transcription of ECM remodeling program in fibroblasts.
A. Bru-seq nascent transcript profiling in fibroblasts undergoing proliferation, starvation, and recovery from starvation. B. Bru-seq signal tracks at TGFBR3 gene upregulated during starvation. C. Volcano plot comparing Bru-seq transcript abundance between proliferating and starved fibroblasts. Parenthesis, gene count. D. Same as C but showing difference between starved and recovering fibroblasts. E. Clustering of differentially transcribed genes. Top, the fraction of union differential transcribed genes over total genes. Bottom, normalized transcript level of differentially transcribed genes grouped by the dynamics of gene expression. Small plots along the right Y-axis represent mean expression values within cluster and serve as icons in this and subsequent figure panels. F. GO terms enriched in differentially transcribed Bru-seq gene clusters. G–I. Normalized transcript level of differentially transcribed genes.
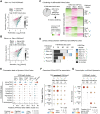
Figure 2.
Figure 2.. Extensive gains of H3K27ac at distal putative enhancers in starved fibroblasts.
A, B. Representative H3K27ac ChIP-seq signal tracks at COL15A1 (A) and POSTN (B) loci. Differentially H3K27 acetylated regions are indicated. C, D. Scatter plot comparing normalized ChIP-seq read coverage between proliferation and starvation (C) and between starvation and recovery (D) at H3K27ac peak locations identified. Parenthesis indicates H3K27ac site count. E. Clustering of union differentially H3K27ac-marked sites. Top: Proportion of union differentially H3K27ac-marked sites among all H3K27ac sites. Bottom: K-means clustering of the differentially H3K27ac-marked sites. Small plots along the right Y-axis represent mean H3K27ac scores within cluster and serve as icons in this and subsequent figure panels. F. Enrichment of chromatin states within differentially H3K27ac-marked clusters.
Figure 3.
Figure 3.. Gains of H3K27ac occur at upregulated ECM-related genes in starved fibroblasts.
A. Fraction of Bru-seq cluster genes with indicated H3K27ac cluster sites. B. GO terms enriched in Starv-Hi genes linked to Starv-Hi1 H3K27ac sites (left) or Starv-Hi2 H3K27ac sites (right) versus GO terms enriched in all Starv-Hi genes. Each circle represents each GO term, with the circle size indicating the number of Starv-Hi genes linked to Starv-Hi1 or Hi2 H3K27ac sites. Line, linear least squares. Shade, 0.95 confidence interval. GO terms above or below the 95% interval range of the linear model (text labeled) suggest over- or under-representation, respectively, in the H3K27ac-linked subset of Starv-Hi genes than predicted. C. Candidate TFs binding to H3K27ac dynamic cluster sites. Left: Candidate TFs are those whose DNA motifs are enriched within DNase hypersensitive sites in the dynamic H3K27ac sites and whose public ChIP-seq peaks (in any cell types) are enriched in the dynamic H3K27ac sites. Right: Candidate TFs identified for each dynamic H3K27ac site cluster (top) and their expression levels measure by Bru-seq (bottom).
Figure 4.
Figure 4.. Starvation caused limited alteration to promoter-proximal H3K4me3 states.
A, B. Scatter plot comparing normalized ChIP-seq read coverage between proliferation and starvation (A) and between starvation and recovery (B) at H3K4me3 peak locations identified. Parenthesis indicates H3K4me3 site count. C. Clustering of union differentially H3K4me3-marked sites. Left: Proportion of union differentially H3K4me3-marked sites among all H3K4me3 sites. Right: K-means clustering of the differentially H3K4me3-marked sites. Small plots along the right Y-axis represent mean H3K4me3 scores within cluster and serve as icons in this and subsequent figure panels. D. Number of dynamic H3K4me3 sites, stratified by the state of direct overlap with H3K27ac sites. E. Enrichment of chromatin states within differentially H3K4me3-marked site clusters. F. Gene-level co-occurrence between TSS-proximal H3K4me3 sites and TSS-distal H3K27ac sites. G. Fraction of Bru-seq cluster genes linked to indicated H3K4me3 cluster sites.
Figure 5.
Figure 5.. Starvation-activated H3K27ac sites are enriched for IBD-risk variants.
A. GWAS SNP enrichment in H3K27ac clusters. B. Locations of IBD-risk SNP rs2461864 within Starv-Hi2 H3K27ac CRE at the PLAU locus. NES, normalized effect size for eQTL. eQTL P, eQTL P-value. D’, normalized linkage strength (0 to 1). R2, correlation coefficient of determination. LD P, chi-square P-value for linkage. C. ChIP read count with T or A variant at rs2461864 in public H3K27ac and H3K4me1 ChIP-seq datasets heterozygous for the allele. D. PLAU expression level and PLAU-expressing cell count by cell types in normal ilea and Crohn’s disease patient ilea. Data are from Elmentaite et al. 2020. E. Same as D, but data are stratified by fibroblast cell types. F. ATAC-seq signals at Starv-Hi2 CRE in intestinal fibroblasts in IBD patients responsive or non-responsive to anti-TNF therapy (indicated as Yes or No, respectively). The H3K27ac data (bottom) is the same as data in B and shown as a reference. Data are from Wayman et al. 2024. See Figure S5 for signal quantification. G. PLAU expression level and PLAU-expressing cell count in IBD patients responsive or non-responsive to anti-TNF therapy. Data are from Wayman et al. 2024. H. Summary. Starvation activates ECM remodeling genes via putative enhancer activation in fibroblasts. Starvation-activated putative enhancers are enriched for IBD risk variants.

Similar articles

References

    1. Younesi F.S., Miller A.E., Barker T.H., Rossi F.M.V., and Hinz B. (2024). Fibroblast and myofibroblast activation in normal tissue repair and fibrosis. Nat. Rev. Mol. Cell Biol. 10.1038/s41580-024-00716-0. - DOI - PubMed
    1. Tallquist M.D., and Molkentin J.D. (2017). Redefining the identity of cardiac fibroblasts. Nat. Rev. Cardiol. 14, 484–491. - PMC - PubMed
    1. Baugh L.R. (2013). To grow or not to grow: nutritional control of development during Caenorhabditis elegans L1 arrest. Genetics 194, 539–555. - PMC - PubMed
    1. Breeden L.L., and Tsukiyama T. (2022). Quiescence in Saccharomyces cerevisiae. Annu. Rev. Genet. 56, 253–278. - PMC - PubMed
    1. Yuan H.-X., Xiong Y., and Guan K.-L. (2013). Nutrient sensing, metabolism, and cell growth control. Mol. Cell 49, 379–387. - PMC - PubMed

Publication types

LinkOut - more resources