[Preprint]. 2024 Sep 9:2024.09.09.612087.
doi: 10.1101/2024.09.09.612087.

A secondary β-hydroxybutyrate metabolic pathway linked to energy balance

Affiliations

A secondary β-hydroxybutyrate metabolic pathway linked to energy balance

Maria Dolores Moya-Garzon et al. bioRxiv. .

Abstract

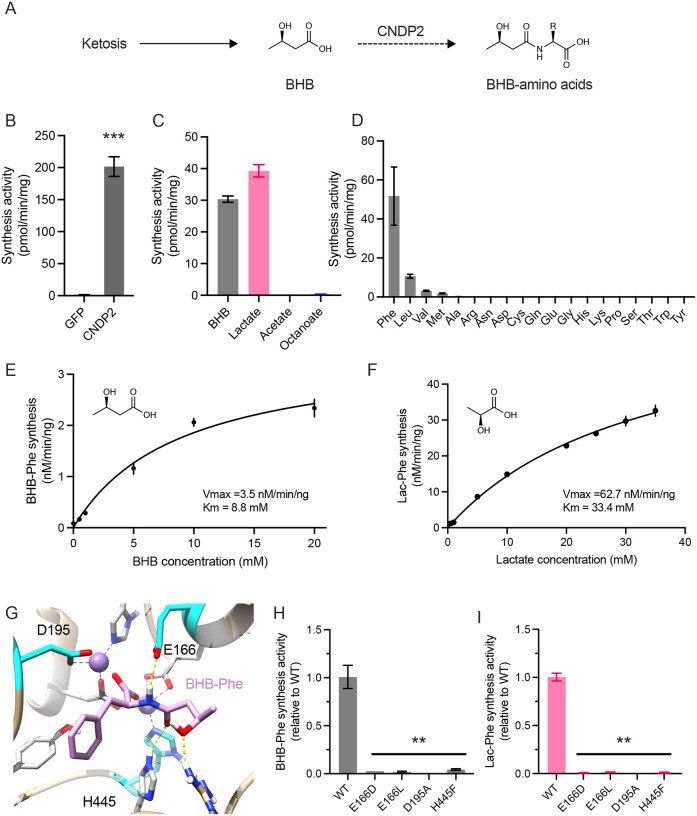
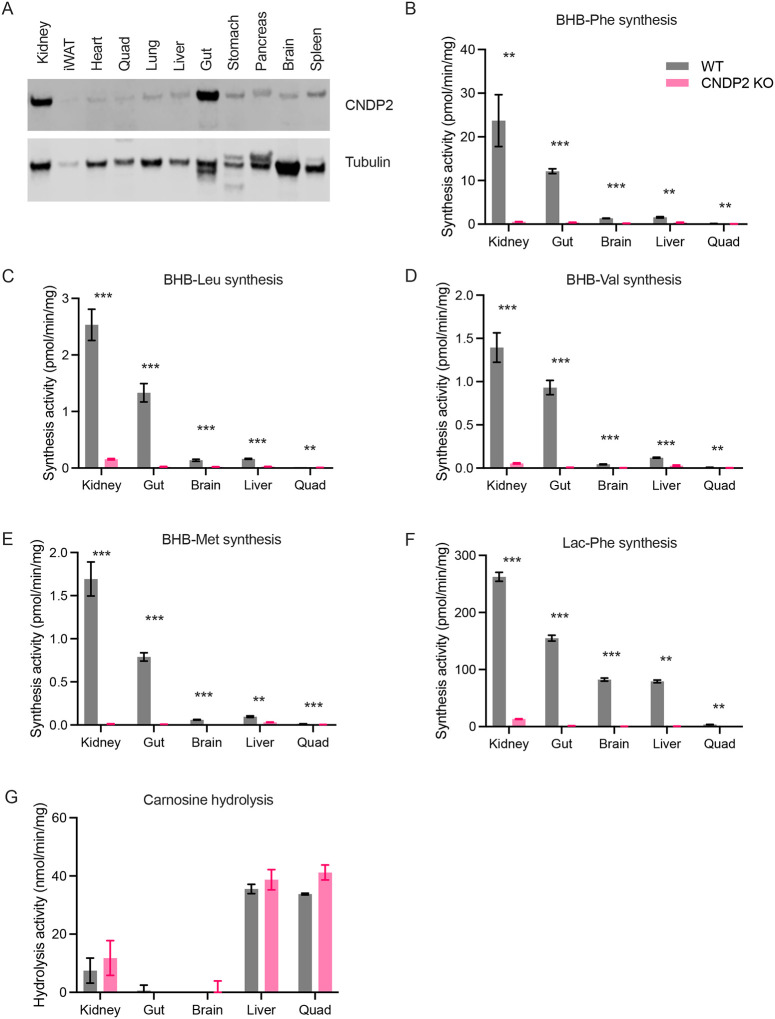
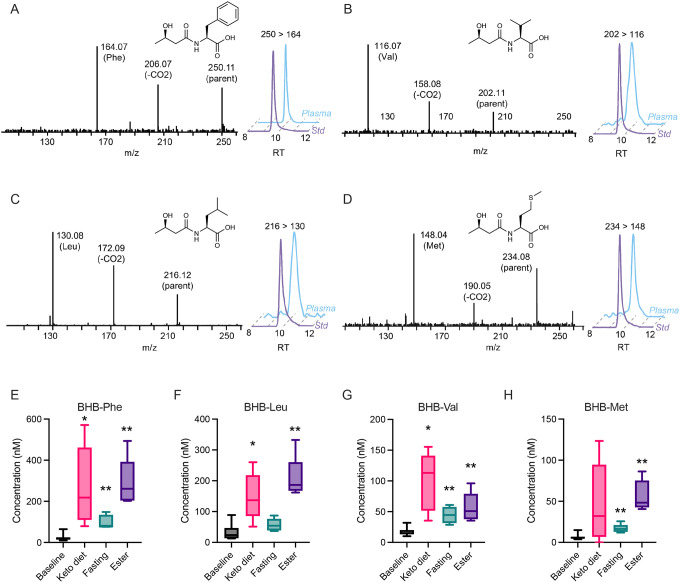
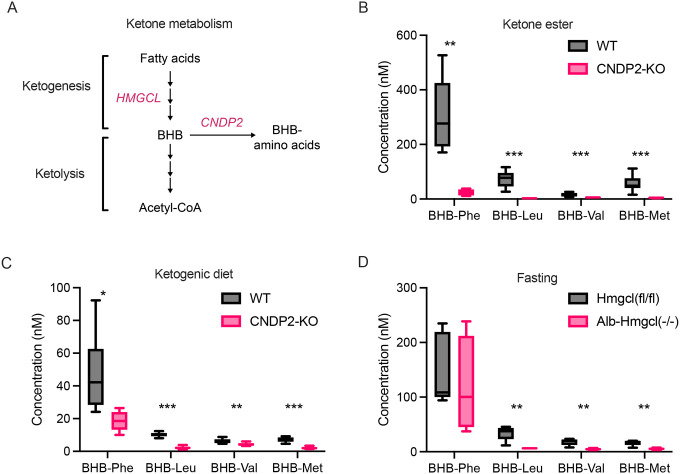
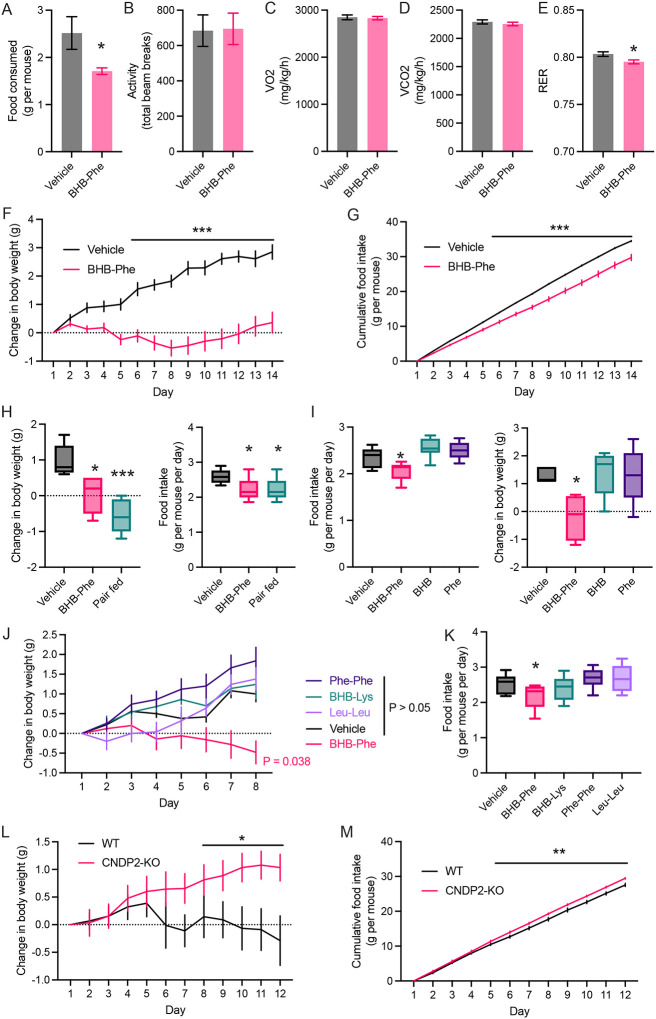
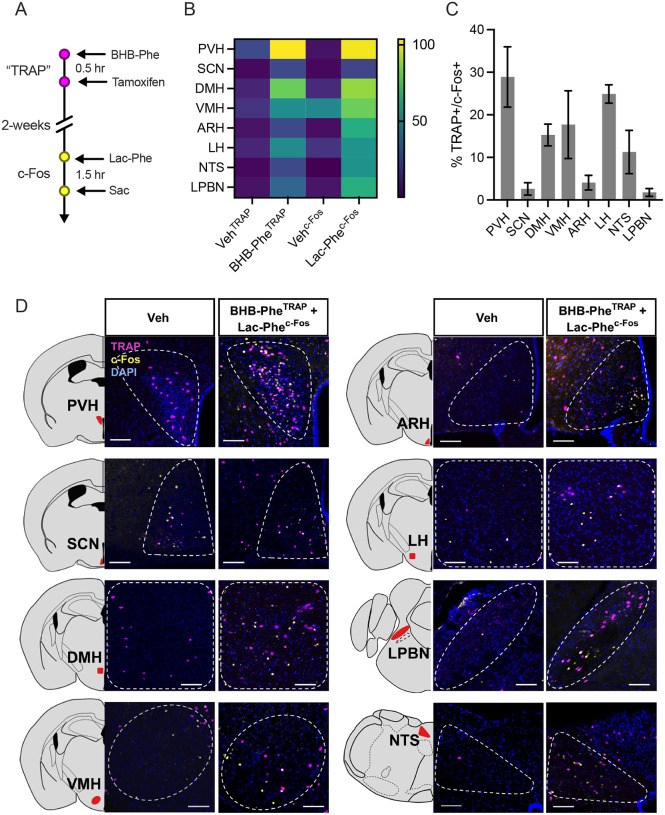
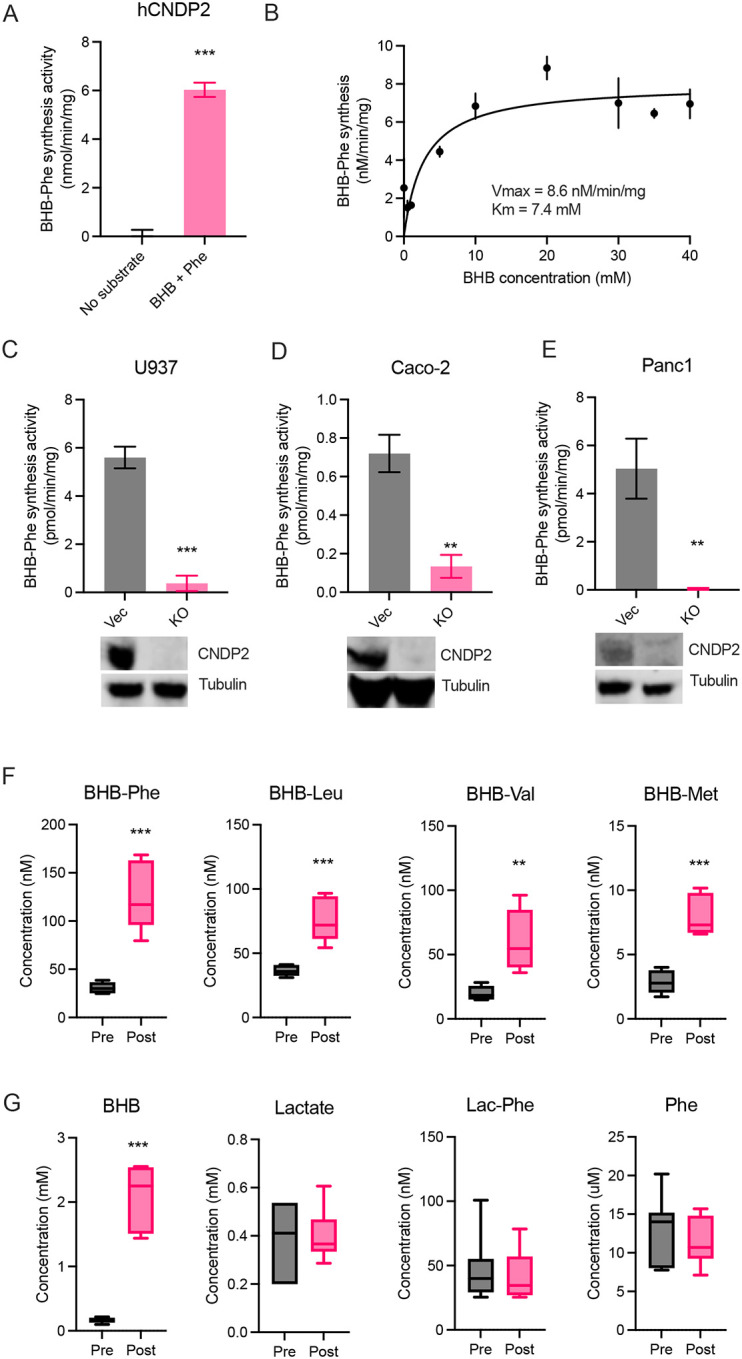
β-hydroxybutyrate (BHB) is an abundant ketone body. To date, all known pathways of BHB metabolism involve interconversion of BHB and primary energy intermediates. Here we show that CNDP2 controls a previously undescribed secondary BHB metabolic pathway via enzymatic conjugation of BHB and free amino acids. This BHB-ylation reaction produces a family of endogenous ketone metabolites, the BHB-amino acids. Genetic ablation of CNDP2 in mice eliminates tissue amino acid BHB-ylation activity and reduces BHB-amino acid levels. Administration of BHB-Phe, the most abundant BHB-amino acid, to obese mice activates neural populations in the hypothalamus and brainstem and suppresses feeding and body weight. Conversely, CNDP2-KO mice exhibit increased food intake and body weight upon ketosis stimuli. CNDP2-dependent amino acid BHB-ylation and BHB-amino acid metabolites are also conserved in humans. Therefore, the metabolic pathways of BHB extend beyond primary metabolism and include secondary ketone metabolites linked to energy balance.


Conflict of interest statement

Declaration of interests A provisional patent application has been filed by Stanford University on BHB-amino acids for the treatment of cardiometabolic disease.

Figures

Fig. 1.
Fig. 1.. CNDP2 catalyzes amino acid BHB-ylation in vitro.
(A) Schematic of CNDP2-dependent Lac-Phe synthesis and the proposed CNDP2-dependent BHB-Phe synthesis reaction. (B) BHB-Phe synthesis activity of cell lysates transfected with GFP or mouse CNDP2-flag. (C,D) Synthesis activity of cell lysates transfected with GFP or mouse CNDP2-flag and incubated with the indicated monocarboxylate with Phe (C) or the indicated amino acid with BHB (D). (E,F) Michaelis-Menten kinetics of recombinant purified mouse CNDP2-flag protein with BHB (E) or lactate (F) as the organic acid donor. (G) Molecular docking of BHB-Phe into the mouse CNDP2 active site. (H,I) BHB-Phe synthesis activity (H) or Lac-Phe synthesis activity (I) of HEK293T cells transfected with the indicated mouse WT or mutant CNDP2 plasmid. For enzyme assays, organic acids and amino acids were incubated at a concentration of 20 mM at 37°C for 1 hour. For B-I, N=3–4/group. Data are shown as means ± SEM. P-values were calculated by Student’s two-sided t-test.
Fig. 2.
Fig. 2.. CNDP2 is the principal BHB-amino acid synthetase in mouse tissues.
(A) Western blot of the indicated mouse tissues using an anti-CNDP2 (top) or anti-tubulin (bottom) antibody. (B-G) Enzyme activities of tissues from WT or CNDP2-KO mice when provided with BHB and Phe (B), BHB and Leu (C), BHB and Val (D), BHB and Met (E), lactate and Phe (F), or carnosine (G) as substrates. For enzyme assays, organic acids and amino acids were incubated at a concentration of 20 mM at 37°C for 1 hour. For B-G, N=3–4/group. Data are shown as means ± SEM. P-values were calculated by Student’s two-sided t-test.
Fig. 3.
Fig. 3.. Detection and ketosis-inducibility of BHB-amino acids in mouse plasma.
(A-D) Tandem mass spectrometry fragmentation of the authentic standard (left) and co-elution of the standard and the endogenous peak from mouse plasma (right) using the indicated multiple reaction monitoring transition for BHB-Phe (A), BHB-Val (B), BHB-Leu (C), and BHB-Met (D). (E-H) BHB-amino acid quantitation in 8–9 week old male C57BL/6J mouse plasma at baseline (dark blue), after 1 week on ketogenic diet (Research Diets D21021803), after a 24 h fast (grey) or 30 min post ketone monoester drink administration by oral gavage (3 mg KE/g of body weight, light blue). For E-H, N=5/group, with the baseline N=15 (pooled from each of the three groups). Data for E-H are shown as box-and-whisker plots. P-values were calculated by Student’s two-sided t-test.
Fig. 4.
Fig. 4.. Genetic regulation of BHB-amino acids by CNDP2 and HMGCL.
(A) Schematic of ketone biochemical pathways and the genetic mouse models used. (B-D) BHB-amino acid quantitation in plasma from 4–10-week-old male WT (blue) and CNDP2-KO mice (red) at 60 min post ketone monoester drink administration by oral gavage (3 mg KE/g of body weight) (B), from 7–16-week-old female WT and CNDP2-KO mice after 1 week on ketogenic diet (Research Diets D06040601, panel C), or from Hmgcl (fl/fl) vs Alb-Hmgcl(−/−) mice after a 24 h fast. For B, N = 7 for WT and 4 for KO. For C, N = 8 per group. For D, N = 5 for Hmgcl (fl/fl), N = 4 for Alb-Hmgcl(−/−). Data are shown as box-and-whisker plots. P-values were calculated by Student’s two-sided t-test.
Fig. 5.
Fig. 5.. BHB-Phe suppresses food intake and body weight.
(A-E) Food intake (A), ambulatory movement (B), oxygen consumption (VO2) (C), carbon dioxide production (VCO2) (D), and respiratory exchange ratio (RER) (E) of singly housed 29-week-old male DIO mice following a single injection of vehicle or BHB-Phe (50 mg/kg, IP) over a 10 h period in metabolic chambers. (F,G) Change in body weight (F) and cumulative food intake (G) of singly housed 28-week-old male DIO mice treated with vehicle or BHB-Phe (50 mg/kg/day, IP). Starting body weights were vehicle: 46.4 ± 1.4 g, BHB-Phe 45.7 ± 1.0 g (mean ± SEM). (H) Change in body weight (left) and daily food intake (right) of group housed 15-week-old male DIO mice after 6 days of treatment with vehicle, BHB-Phe (50 mg/kg/day, IP) or vehicle-treated pair-fed mice. Starting body weights were vehicle: 39.4 ± 2.3 g, BHB-Phe: 38.5 ± 0.8 g, and pair-fed: 37.8 ± 0.6 g (mean ± SEM). (I) Change in body weight (left) and food intake (right) of group housed 13-week-old male DIO mice after 9 days of treatment with vehicle, BHB-Phe, BHB, or phenylalanine (50 mg/kg/day, IP). Starting body weights were vehicle: 36.2 ± 0.7 g, BHB-Phe: 37.9 ± 2.1 g, BHB: 36.8 ± 1.1 g, Phe: 34.5 ± 0.5 g (mean ± SEM). (J,K) Change in body weight (J) and food intake (K) of group housed 14–16-week-old male DIO mice after 9 days of treatment with Phe-Phe, BHB-Lys, Leu-Leu, BHB-Phe (50 mg/kg/day, IP) or vehicle. Starting body weights were vehicle: 41.2 ± 1.3 g, BHB-Phe: 39.1 ± 1.7 g, BHB-Lys: 40.1 ± 2.2 g, Phe-Phe: 40.8 ± 1.4 g, Leu-Leu: 41.2 ± 1.3 g (mean ± SEM). (L,M) Change in body weight (L) and food intake (M) of singly housed 20-week-old male WT and CNDP2-KO mice receiving ketone esters (3 g/kg/day, PO). Starting body weights were WT: 46.8 ± 1.4 g, CNDP2-KO: 47.1 ± 1.3, P > 0.05 (mean ± SEM). For A-E, N = 7 for vehicle, N = 8 for BHB-Phe. For F,G, N = 10 per group. For H-K, N = 5 per group. For L,M, N = 9 per group. Data in A-G, J, L, and M are shown as the mean ± SEM. Data in H, I, and K are shown as box-and-whisker plots. P-values were calculated by Student’s two-sided t-test or by two-way ANOVA.
Fig. 6.
Fig. 6.. TRAP/c-Fos mapping of BHB-Phe- and Lac-Phe-activated neurons in the brain.
(A) A schematic diagram of the experimental design for mapping BHB-Phe- and Lac-Phe-activated neurons. TRAP, targeted recombination in active populations. (B) Heat map showing the number of VehTRAP, BHB-PheTRAP, Vehc-Fos and Lac-Phec-Fos labeled neurons in various brain regions. ARH, arcuate nucleus of the hypothalamus; DMH, dorsomedial hypothalamus; LH, lateral hypothalamus; LPBN, lateral parabrachial nucleus; NTS, nucleus of the solitary tract; PVH, paraventricular hypothalamus; SCN, superchiasmatic nucleus; VMH, ventromedial hypothalamus. (C,D) Quantification (C) and representative sections (D) of TRAP+/c-Fos+ neurons in the indicated brain regions. For B,C, N = 3 per group. Data are shown as mean ± SEM. Scale bars, 100 μm.
Fig. 7.
Fig. 7.. Human CNDP2 activity and BHB-amino acids in human plasma.
(A,B) BHB-Phe synthetase activity of recombinant human CNDP2 provided with the indicated substrates (A) and Michaelis-Menten kinetics of recombinant human CNDP2 protein with increasing concentrations of BHB substrates (B). (C-E) Top: BHB-Phe synthesis activity of cell lysates from WT or CNDP2-KO human cell lines U937 (C), Caco-2 (D) or PANC-1 (E). Bottom: Western blot using an anti-CNDP2 (upper) or anti-tubulin (lower) antibody for WT and CNDP2-KO U937 (C), Caco-2 (D), and PANC-1 (E) cells. (F,G) Levels of BHB-amino acids (F) or the indicated metabolite (G) in human plasma at baseline or 60 minutes post ketone ester drink administration (0.3 g/kg ketone ester). For A and C-E, reactions were performed with 20 mM substrates at 37°C for 1 hour. For A-E, N=3–5/group. For F,G, N=7/group. For A-E, data are shown as mean ± SEM. For F and G, data are shown as box-and-whisker pots. P-values were calculated by Student’s two-sided t-test.

Similar articles

References

    1. Newman J. C. & Verdin E. β-Hydroxybutyrate: A Signaling Metabolite. Annu. Rev. Nutr. 37, 51–76 (2017). - PMC - PubMed
    1. Puchalska P. & Crawford P. A. Metabolic and Signaling Roles of Ketone Bodies in Health and Disease. Annu. Rev. Nutr. 41, 49–77 (2021). - PMC - PubMed
    1. Rahman M. et al. The b-hydroxybutyrate receptor HCA 2 activates a neuroprotective subset of macrophages. Nat. Commun. 5, 1–11 (2014). - PubMed
    1. Kimura I. et al. Short-chain fatty acids and ketones directly regulate sympathetic nervous system via G protein-coupled receptor 41 (GPR41). Proc. Natl. Acad. Sci. U. S. A. 108, 8030–8035 (2011). - PMC - PubMed
    1. Xie Z. et al. Metabolic Regulation of Gene Expression by Histone Lysine β-Hydroxybutyrylation. Mol. Cell 62, 194–206 (2016). - PMC - PubMed

Publication types