[Preprint]. 2024 Sep 13:arXiv:2308.03175v2.

Adapting Machine Learning Diagnostic Models to New Populations Using a Small Amount of Data: Results from Clinical Neuroscience

Affiliations

Adapting Machine Learning Diagnostic Models to New Populations Using a Small Amount of Data: Results from Clinical Neuroscience

Rongguang Wang et al. ArXiv. .

Abstract

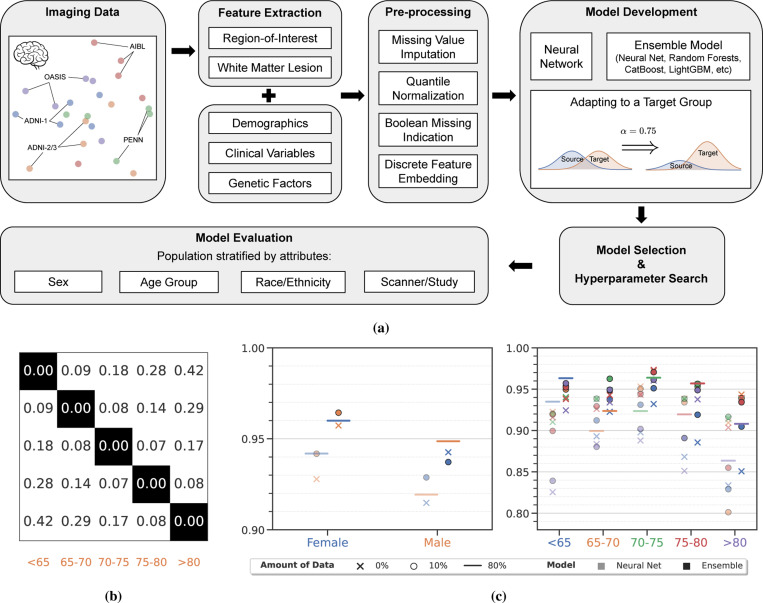
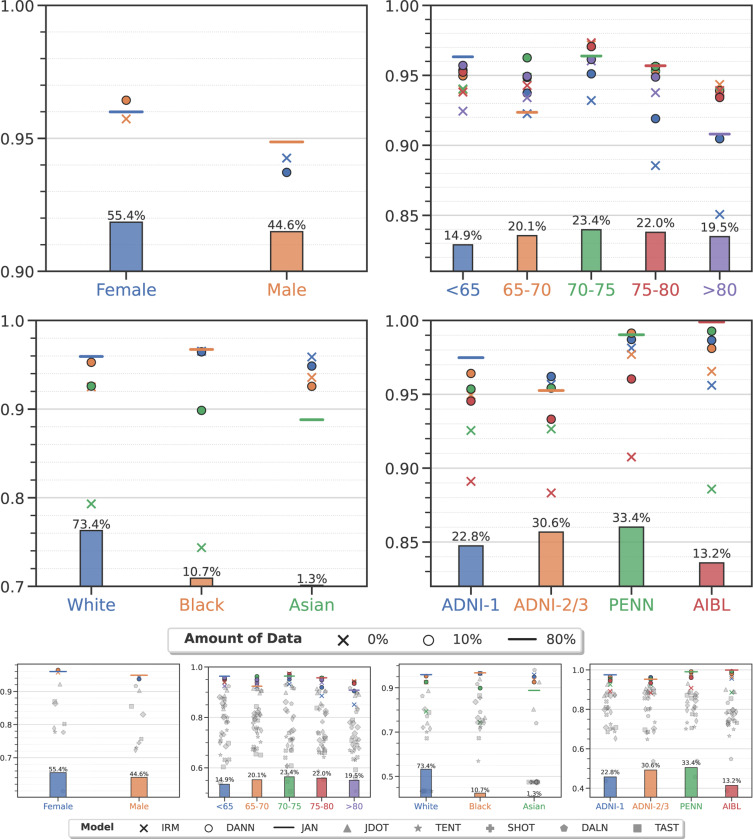
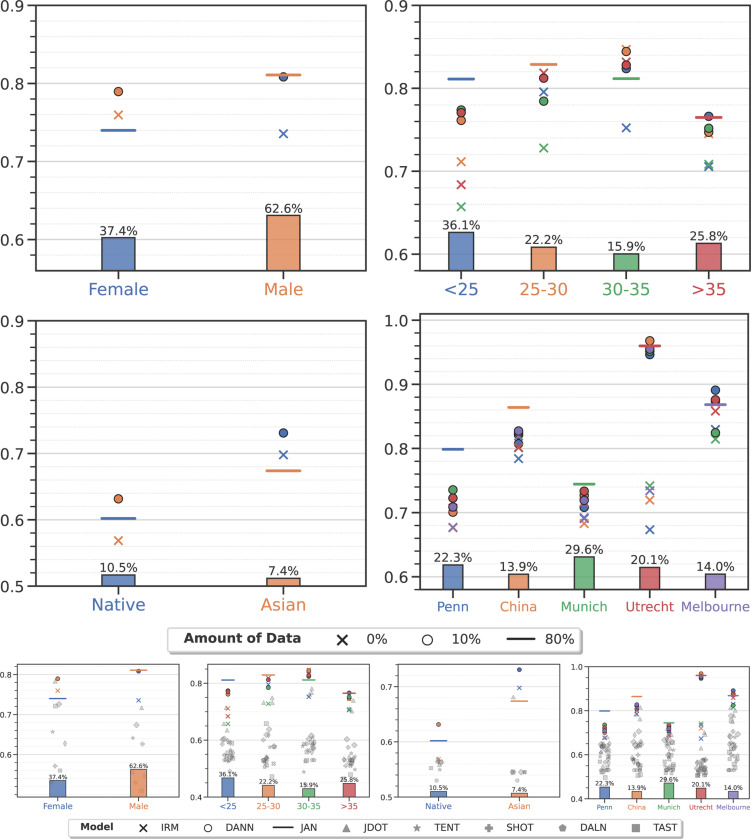
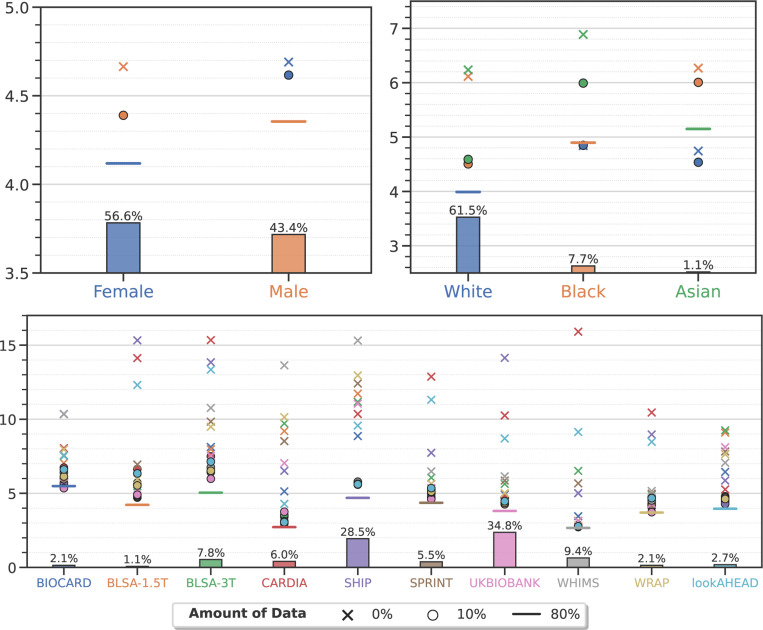
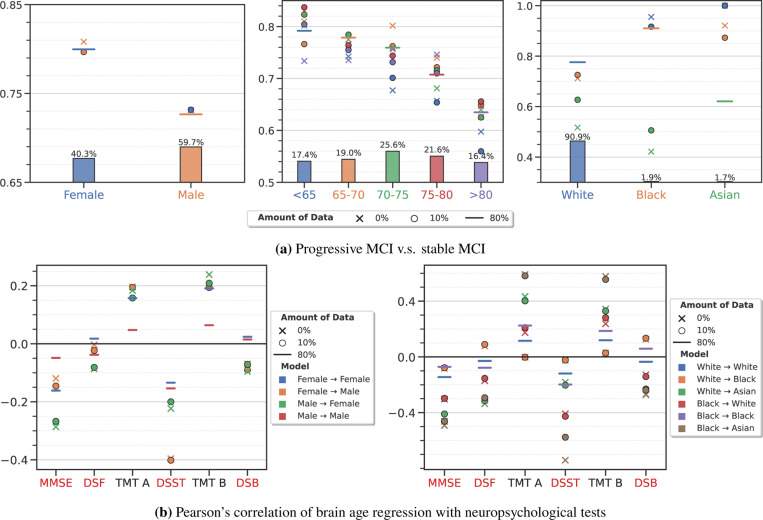
Machine learning (ML) is revolutionizing many areas of engineering and science, including healthcare. However, it is also facing a reproducibility crisis, especially in healthcare. ML models that are carefully constructed from and evaluated on data from one part of the population may not generalize well on data from a different population group, or acquisition instrument settings and acquisition protocols. We tackle this problem in the context of neuroimaging of Alzheimer's disease (AD), schizophrenia (SZ) and brain aging. We develop a weighted empirical risk minimization approach that optimally combines data from a source group, e.g., subjects are stratified by attributes such as sex, age group, race and clinical cohort to make predictions on a target group, e.g., other sex, age group, etc. using a small fraction (10%) of data from the target group. We apply this method to multi-source data of 15,363 individuals from 20 neuroimaging studies to build ML models for diagnosis of AD and SZ, and estimation of brain age. We found that this approach achieves substantially better accuracy than existing domain adaptation techniques: it obtains area under curve greater than 0.95 for AD classification, area under curve greater than 0.7 for SZ classification and mean absolute error less than 5 years for brain age prediction on all target groups, achieving robustness to variations of scanners, protocols, and demographic or clinical characteristics. In some cases, it is even better than training on all data from the target group, because it leverages the diversity and size of a larger training set. We also demonstrate the utility of our models for prognostic tasks such as predicting disease progression in individuals with mild cognitive impairment. Critically, our brain age prediction models lead to new clinical insights regarding correlations with neurophysiological tests. In summary, we present a relatively simple methodology, along with ample experimental evidence, supporting the good generalization of ML models to new datasets and patient cohorts.

Keywords: MRI; distribution shift; domain adaptation; domain generalization; neurological disorder.


Conflict of interest statement

Competing interests The authors declare no competing interests.

Figures

Figure 1:
Figure 1:. Automated and robust diagnosis of neurological disorders using machine learning models.
(a) A schematic of the framework for data pre-processing, model development, optimization, and evaluation employed in this paper to build machine learning models that can predict accurately on different groups for heterogeneous neurological disorders using MR images, demographic and clinical variables, genetic factors, and cognitive scores. (b) Pairwise MMD statistic between learned features of pairs of groups, e.g., distributional discrepancy between Male-Female groups is 0.17, while the distributional discrepancy between < 65 years and > 80 years, or between ADNI-1 and ADNI-2/3, is larger (0.42 and 0.26 respectively). See Sec. 4.5 for details of the MMD calculation. Figs. S.1a and S.1b provide more details of the numerical statistics. (c) Average AUC of Alzheimer’s disease classification for sex and age attributes computed using five-fold nested cross-validation; see Fig. S.1 for other attributes. For both sex and age, we trained machine learning models, a deep neural network (translucent markers) and an ensemble using boosting, bagging and stacking (bold markers), using data from different source groups (different colors) and evaluated this model (cross marks) on data from different target groups (X-axis); circles denote model fitted using our α-weighted ERM procedure with access to 10% data from the target group; horizontal lines denote models that are directly trained on the target group using 80% of data (the rest for testing). All models use data from multiple sources, namely structural measures, demographic, clinical variables, genetic factors, and cognitive scores. In general, (i) the AUC of ensemble models is higher than that of the neural network in all cases (p < 0.01), (ii) AUC of a model trained on a source group remains remarkably high when evaluated on the target group (crosses), (iii) in most cases, it further improves when one has access to a small fraction of data from the target group (circles are higher than crosses), and (iv) often times even beyond the AUC of a model directly trained on the target group (circles above the horizontal lines).
Figure 2:
Figure 2:. Alzheimer’s disease classification (see Table S.7 for numerical data).
Markers denote the average AUC on the target group computed using five-fold nested cross-validation for models trained only on data from the target group (e.g., Female subjects, denoted by the blue horizontal line), only on data from the source group (e.g., trained on all Male subjects and evaluated on Female subjects is denoted by the orange cross), and trained on all data from the source group and 10% data from the target group (orange circle). Panels denote groups stratified by one of the four attributes, namely sex, age group, race and clinical study. Bar plots denote the proportion of subjects in these groups in our study. All models are ensembles trained using features derived from structural measures, demographic and clinical variables, genetic factors, and cognitive scores. In spite of imbalances in the proportion of data in different groups, the AUC of the ensemble is consistently high (above 0.85 in all cases except when transferring from models built from Asians). The gap in predictive performance of a model trained on only target data (horizontal lines) and a model trained only on source data (crosses) can be improved with access to as little as 10% data from the target group (circles) for Male, < 65 years, > 80 years, Asian, ADNI-1, ADNI-2/3, PENN and AIBL, when transferring from any of other groups (p < 0.005). The improvement in AUC using 10% target data is not statistically significant for the other groups; in one case (Female) we also see deterioration after including the target data perhaps due to confounding factors. We observe that the AUC for the > 80 years subgroup is low compared to other age groups even for models directly trained on this group. This might be due to the strong normal9 aging effects which make it difficult to distinguish cognitively normal individuals from AD patients. In the lower panel, we also compare the proposed model with 8 representative domain adaptation/generalization techniques including IRM, DANN, JAN, JDOT, TENT, SHOT, DALN, and TAST as shown in grey markers. See Sec. 4.4 for details of these methods.
Figure 3:
Figure 3:. Schizophrenia classification (see Table S.8 for numerical data).
Markers denote the average AUC of the ensemble on the target group computed using five-fold nested cross-validation for models trained only on data from the target group (e.g., Female subjects, denoted by the blue horizontal line), only on data from the source group (crosses), and trained on all data from the source group and 10% data from the target group (circles). Compared to Fig. 2, the AUC for schizophrenia classification is lower in general, as expected based on respective prior literature. We find that α-weighted ERM using 10% data from the target group improves the AUC of the ensemble (circles are above crosses of the same color) in all cases except two: 25–30 years old and 30–35 years old. In most cases, models adapted from source groups using 10% data from the target group perform better than those trained on all target data, except when target groups are Male, > 35 years old, Munich and Utrecht, when the difference is statistically insignificant. We observe large performance discrepancies between different clinical studies. Besides scanner and acquisition protocols variations, disease severity might be playing a role here. For example, the AUC of China cohort is large perhaps because on-site clinical cases are usually relatively more severe clinically, largely due to cultural factors influencing who and when will seek hospitalization. In the lower panel, we also compare the proposed model with 8 representative domain adaptation/generalization techniques including IRM, DANN, JAN, JDOT, TENT, SHOT, DALN, and TAST as shown in grey markers. See Sec. 4.4 for baseline method details.
Figure 4:
Figure 4:. Brain age prediction (see Table S.9 for numerical data).
Markers denote the mean absolute error (MAE) in years of an ensemble that predicts the brain age on different target groups in the population computed using five-fold nested cross-validation, for models trained only on data from the target group (e.g., Female subjects, denoted by the blue horizontal line), only on data from the source group (crosses), and trained on all data from the source group and 10% data from the target group (circles). In general, the MAE of brain age prediction is remarkably small, it is below 7 years for age and race and below 15 years in most settings when models were trained on different clinical studies. Ensembles trained using 10% data from the target group in addition to all data from the source group improve the MAE in all cases (circles are below crosses) except one (when source is White and target is Black). The third panel has 10 different clinical studies, with very different amounts of data. Even in this case the MAE of brain age prediction is smaller than 8 years in all cases when the ensemble has access to some data from the target group, in some cases there are significant improvements as compared to the corresponding crosses. Magnetic field strength of the scanners affects the models performance significantly. For example, only BLSA-1.5T and SHIP are acquired from 1.5T devices and others are from 3T ones. We can see big MAE gaps between the horizontal lines and crosses in BLSA-1.5T and SHIP studies. We also observe that larger data size gves rise to better the performance. For example, UKBB has the largest sample size among all studies and models trained on UKBB usually have lower MAE when adapting to other studies.
Figure 5:
Figure 5:. Adapting diagnostic models to target groups using a small amount of data also improves their ability to make predictions on secondary tasks; see Tables S.10 to S.12 for numerical data.
(a) Linear discriminant analysis on the output probabilities (that determines AD vs. cognitively normal CN) of the ensemble models trained for Alzheimer’s disease diagnosis is used to study whether subjects with mild cognitive impairment (MCI) progress to AD (known as pMCI) or remain stable MCI (known as sMCI) using only the baseline scans. The AUC of pMCI vs. sMCI on the target group is shown for three different attributes (sex, age group and race) when models are trained only on data from the source group (crosses), using α-weighted ERM using all data from the source and 10% data from the target group (circles) and with access to only all data from the target group (horizontal lines). Improvements in the AD vs. CN AUC of these models with 10% data translate to improvements in the ability to distinguish between pMCI and sMCI subjects, using only baseline scans (circles above cross) except when target groups are Black or Asian (due to very little data in these groups). For all type of models, performance decreases as the age of the participants increases; this is because predicting progressive MCI using baseline scans is more and more challenging when the time difference to the target age group and the normal aging effect increases. (b) Pearson’scorrelationbetweenthebrainageresidual(predictedbrainageminuschronologicalage)andneuropsychological tests for two different attributes (sex and race) for models trained only on source data (crosses), using α-weighted ERM on all source data and 10% target data (circles) and only on all target data (horizontal lines). Unlike other plots, colors denote different pairs of source and target groups. Tests (X-axis) marked in red are expected to be negatively correlated with brain aging whereas those marked in black are expected to be positively correlated with brain aging according to the existing literature. Mini-mental state examination (MMSE) is a questionnaire test that measures global cognitive impairment. Digit span forward/backward (DSF/B) test is a way of measuring the storage capacity of a person’s working memory. Trail making test part A/B (TMT A/B) measures a person’s executive functioning. Digit symbol substitution test (DSST) is another global measure of cognitive ability, requiring multiple cognitive domains to complete effectively. In almost all cases, we observe stronger correlations than those reported in the literature. Models trained using 10% target data improve the correlation with these neuropsychological tests. Brain age models trained from other groups usually have larger correlations to cognitive scores than the ones directly trained on the target group.

Similar articles

References

    1. Habes M., Pomponio R., Shou H., Doshi J., Mamourian E., Erus G., Nasrallah I., Launer L. J., Rashid T., Bilgel M., et al. The Brain Chart of Aging: Machine-learning Analytics Reveals Links between Brain Aging, White Matter Disease, Amyloid Burden, and Cognition in the iSTAGING Consortium of 10,216 Harmonized MR Scans. Alzheimer’s & Dementia 17, 89–102 (2021). - PMC - PubMed
    1. Chand G. B., Dwyer D. B., Erus G., Sotiras A., Varol E., Srinivasan D., Doshi J., Pomponio R., Pigoni A., Dazzan P., et al. Two Distinct Neuroanatomical Subtypes of Schizophrenia Revealed Using Machine Learning. Brain 143, 1027–1038 (2020). - PMC - PubMed
    1. Jack C. R. Jr, Bernstein M. A., Fox N. C., Thompson P., Alexander G., Harvey D., Borowski B., Britson P. J., L. Whitwell J., Ward C., et al. The Alzheimer’s Disease Neuroimaging Initiative (ADNI): MRI Methods. Journal of Magnetic Resonance Imaging: An Official Journal of the International Society for Magnetic Resonance in Medicine 27, 685–691 (2008). - PMC - PubMed
    1. Qiu S., Miller M. I., Joshi P. S., Lee J. C., Xue C., Ni Y., Wang Y., Anda-Duran D., Hwang P. H., Cramer J. A., et al. Multimodal deep learning for Alzheimer’s disease dementia assessment. Nature Communications 13, 1–17 (2022). - PMC - PubMed
    1. Wang R., Bashyam V., Yang Z., Yu F., Tassopoulou V., Chintapalli S. S., Skampardoni I., Sreepada L. P., Sahoo D., Nikita K., et al. Applications of generative adversarial networks in neuroimaging and clinical neuroscience. NeuroImage, 119898 (2023). - PMC - PubMed

Publication types

LinkOut - more resources