. 2024 Jun 29;6(10):101159.
doi: 10.1016/j.jhepr.2024.101159. eCollection 2024 Oct.

Regulation of intestinal senescence during cholestatic liver disease modulates barrier function and liver disease progression

Affiliations

Regulation of intestinal senescence during cholestatic liver disease modulates barrier function and liver disease progression

Mar Moreno-Gonzalez et al. JHEP Rep. .

Abstract

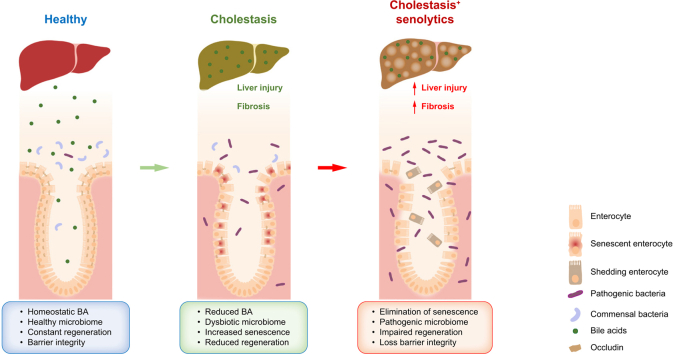
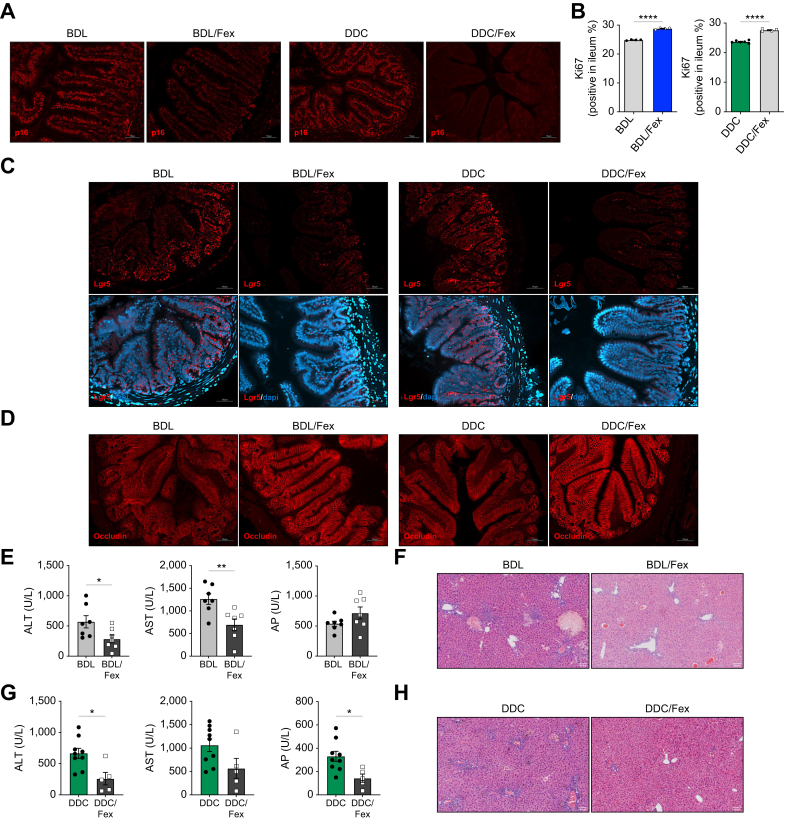
Background & aims: Senescence has been reported to have differential functions in cholangiocytes and hepatic stellate cells (HSCs) during human and murine cholestatic disease, being detrimental in biliary cells and anti-fibrotic in HSCs. Cholestatic liver disease is associated with loss of intestinal barrier function and changes in the microbiome, the mechanistic cause of which is undetermined.

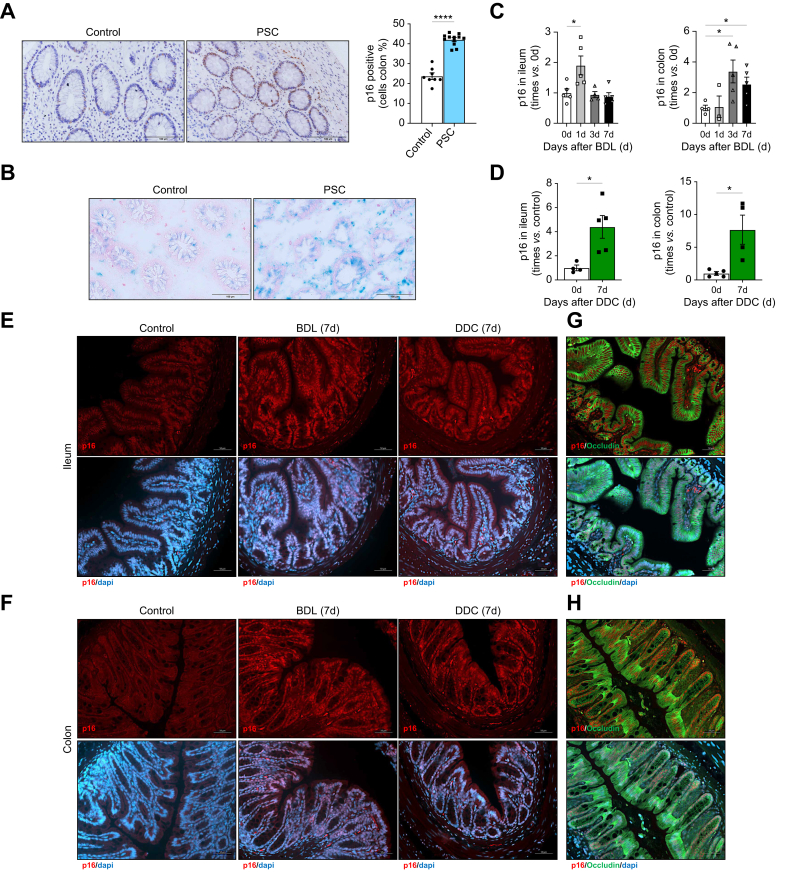
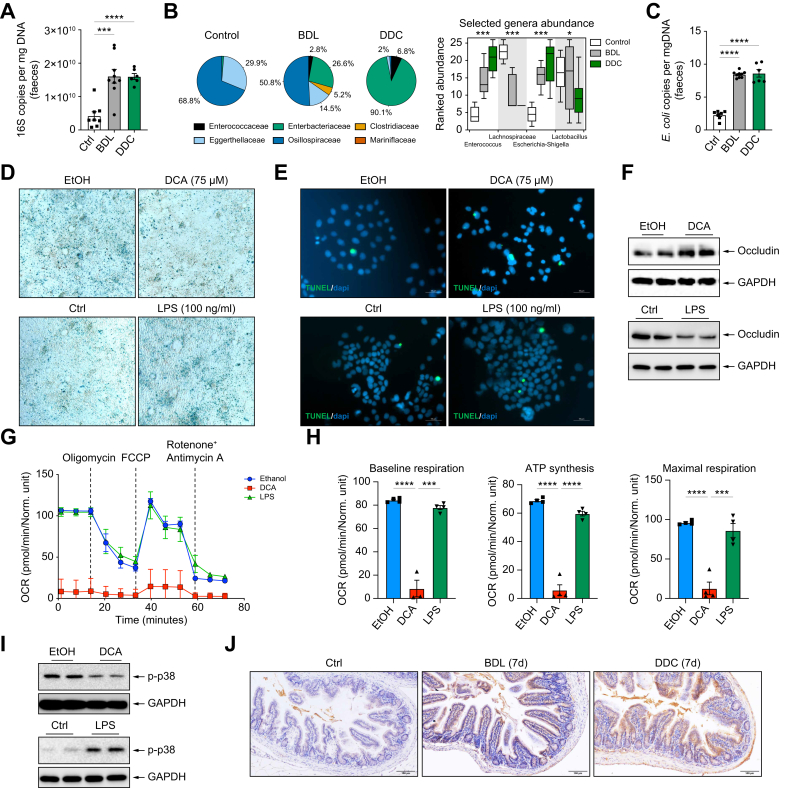
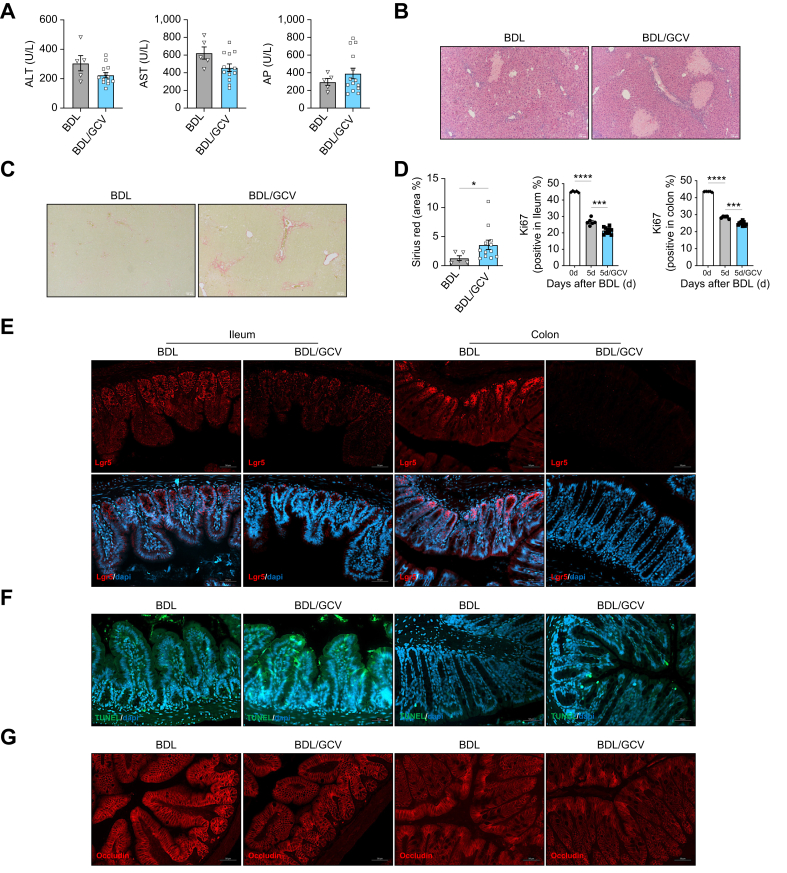
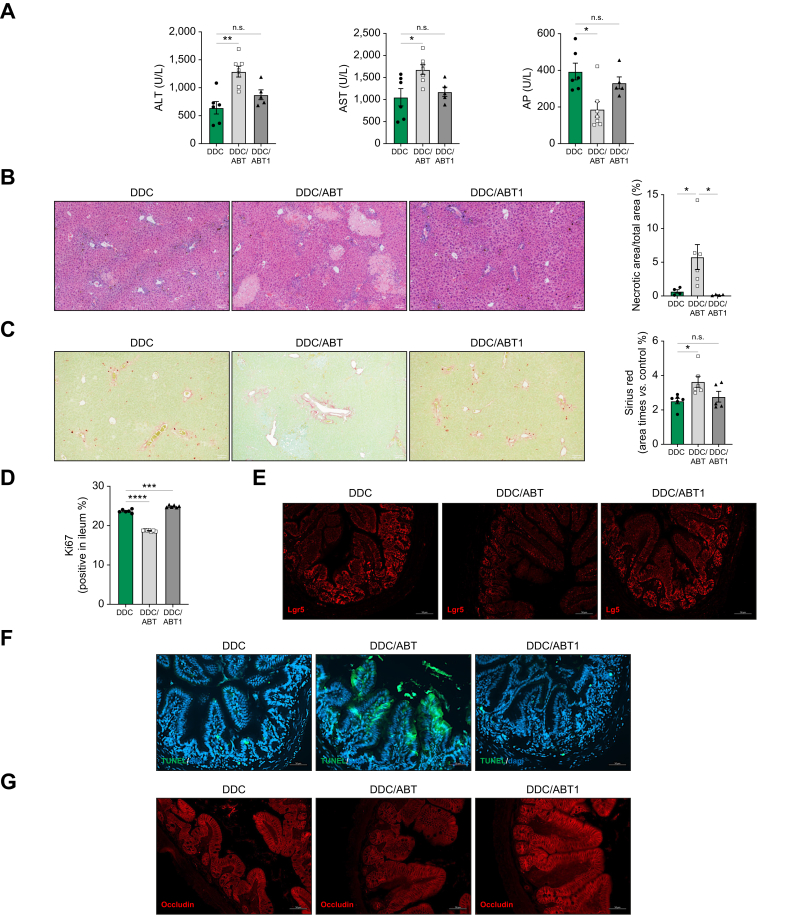
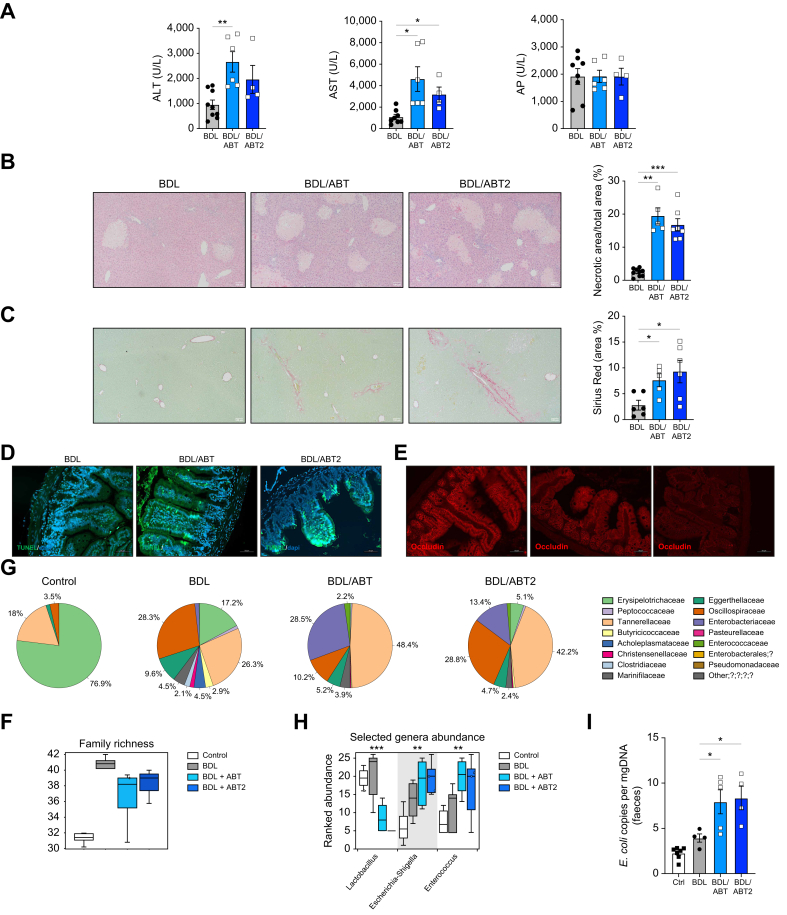
Methods: Intestinal samples were analysed from controls and patients with primary sclerosing cholangitis, as well as wild-type (WT) and p16-3MR transgenic mice. Cholestatic liver disease was induced by bile duct ligation (BDL) and DDC diet feeding. Fexaramine was used as an intestinal-restricted FXR agonist and antibiotics were given to eliminate the intestinal microbiome. Senescent cells were eliminated in p16-3MR mice with ganciclovir and in WT mice with the senolytic drug ABT-263. In vitro studies were done in intestinal CaCo-2 cells and organoids were generated from intestinal crypts isolated from mice.

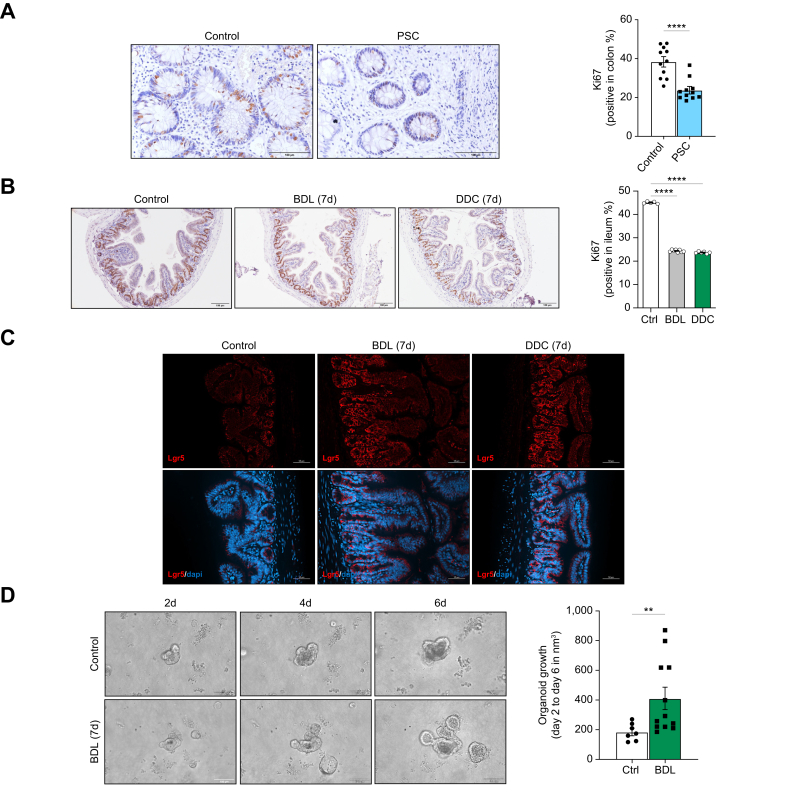
Results: Herein, we show increased senescence in intestinal epithelial cells (IECs) in patients with primary sclerosing cholangitis and in mice after BDL and DDC diet feeding. Intestinal senescence was increased in response to reduced exposure to bile acids and increased presence of lipopolysaccharide in vitro and in vivo during cholestatic liver disease. Senescence of IECs was associated with lower proliferation but increased intestinal stem cell activation, as supported by increased organoid growth from intestinal stem cells. Elimination of senescent cells with genetic and pharmacological approaches exacerbated liver injury and fibrosis during cholestatic liver disease, which was associated with increased IEC apoptosis and permeability.

Conclusions: Senescence occurs in IECs during cholestatic disease and the elimination of senescent cells has a detrimental impact on the gut-liver axis. Our results point to cell-specific rather than systemic targeting of senescence as a therapeutic approach to treat cholestatic liver disease.

Impact and implications: Cholestatic liver disease associates with the dysregulation of intestinal barrier function, while the mechanisms mediating the disruption of the gut-liver axis remain largely undefined. Here, we demonstrate that senescence, a cellular response to stress, is activated in intestinal cells during cholestatic liver disease in humans and mice. Mechanistically, we demonstrate that the reduction of bile acids and the increased presence of bacterial products mediate the activation of intestinal senescence during cholestatic liver disease. Importantly, the elimination of these senescent cells promotes further damage to the intestine that aggravates liver disease, with increased tissue damage and fibrosis. Our results provide evidence that therapeutic strategies to treat cholestatic liver disease by eliminating senescent cells may have unwanted effects in the intestine and support the need to develop cell/organ-specific approaches.

Keywords: Senescence; cholestasis; intestine; liver; senolytics.


Figures

Image 1
Graphical abstract
Fig. 1
Fig. 1
Senescence is increased in the intestine during human and murine cholestasis after BDL and DDC feeding. (A) Immunohistochemistry using a p16-antibody, quantification of positive cells (control vs. PSC, ∗∗∗∗p <0.0001) and (B) SA-β-Gal staining in colonic biopsies from patients with PSC and controls. qPCR of p16 gene expression in ileum and colon from (C) BDL (Ileum 0 h vs. 1 d, ∗p = 0.0427; Colon 0 h vs. 3 d, ∗p = 0.0287; Colon 0 h vs. 7 d, ∗p = 0.0318) and (D) DDC-fed mice (after 7 days) (ileum, ∗p = 0.0185; colon, ∗p = 0.0452). (E) p16 immunofluorescent staining in ileum and (F) colon samples from BDL and DDC-fed mice. (G, H) Immunofluorescence co-staining with p16 (red), occludin (green) and dapi (blue) in ileum and colon after BDL. Analyses were done from n = 8 control and n = 12 PSC colon biopsies and n = 5-6 mice. Representative microscopical images are shown at 40x (A, B), 20x (E-H) magnification. Values are mean ± SEM. Statistical differences were determined using Welch’s t-test. BDL, bile duct ligation; DDC, 3,5-diethoxycarbonyl-1,4-dihydrocollidine; PSC, primary sclerosing cholangitis.
Fig. 2
Fig. 2
Reduced proliferation in the intestine from patients with PSC and cholestatic mice with increased ISC activation. Ki67 immunohistochemistry and quantification of Ki67-positive IECs in colon biopsies from (A) n = 11 patients with PSC and n = 9 controls (control vs. PSC, ∗∗∗∗p <0.0001; Welch’s t-test) and (B) BDL and DDC-fed mice (control vs. BDL vs. DDC, ∗∗∗∗p <0.0001; Brown-Forsythe and Welch one-way ANOVA). (C) Lg5+ immunofluorescence in ileums from BDL and DDC-fed mice. (D) Organoids grown from ISCs isolated from ileum crypts from control (n = 2) and BDL mice (n = 3) at days 2, 4 and 6 in culture and further quantification (control vs. BDL, ∗∗p = 0.0099; Welch’s t-test). Analyses were done from n = 5-6 mice. Representative microscopical images are shown at 40x (A), 10x (B) and 20x (C) magnification. Values are mean ± SEM. BDL, bile duct ligation; DDC, 3,5-diethoxycarbonyl-1,4-dihydrocollidine; IECs, intestinal epithelial cells; ISCs, intestinal stem cells; PSC, primary sclerosing cholangitis.
Fig. 3
Fig. 3
DCA reduces while LPS increases senescence, which is associated with increased OXPHOS in intestinal cells in vitro. (A) 16s qPCR in faecal samples from control, BDL and DDC-fed mice (control vs. BDL, ∗∗∗p = 0.0009; control vs. DDC, ∗∗∗∗p <0.0001; Brown-Forsythe and Welch one-way ANOVA). (B) Community composition at family level (pie charts) and genus level (boxplot) analysis after 16s rRNA sequencing of faecal samples. (C) qPCR using E. coli-specific primers (∗∗∗∗p <0.0001; Brown-Forsythe and Welch one-way ANOVA). (D) SA-β-Gal and (E) TUNEL (green) and dapi (blue) staining on CaCo-2 cells incubated with EtOH, EtOH+DCA (75 μM), control and LPS (100 ng/ml) for 24 h. (F) Immunoblotting on protein extracts using anti-occludin and GAPDH antibodies. (G) OCR detection in CaCo-2 cells 24 h after EtOH, DCA and LPS stimulation using Seahorse technology, followed by (H) detailed baseline respiration, ATP synthesis and maximal respiration analyses (∗∗∗∗p <0.0001; t-test; EtOH vs DCA; DCA vs LPS; ∗∗∗p <0.001; t-test; DCA vs LPS). (I) Immunoblotting showing p38 phosphorylation 24 h after treatments. (J) 4-HNE immunostaining on ileal sections from mice 7 days post BDL and DDC diet. Representative images are shown from 10x magnification. In vitro experiments were repeated 2-3x with n = 3-4 replicates. Analyses were done from n = 6-9 mice. Values are mean ± SEM. DCA, Deoxycholic acid; LPS, Lipopolysaccharide; OXPHOS, Oxidative phosphorylation; DDC, 3,5-diethoxycarbonyl-1,4-dihydrocollidine; BDL, Bile duct ligation; 4-HNE, 4-hydroxynonenal.
Fig. 4
Fig. 4
Pharmacological activation of FXR with Fex reduces intestinal senescence and restores intestinal function after BDL and DDC diet. (A) p16 immunofluorescence, (B) quantification of Ki67-positive cells (∗∗∗∗p <0.0001), (C) Lgr5 immunofluorescence and (D) occludin immunofluorescence in ileums from Fex/BDL and Fex/DDC. P16, Lgr5 and occludin (red) and dapi (blue). (E, G) Serum transaminases and AP (BDL vs. BDL/Fex: ALT, ∗p = 0.0412; AST, ∗∗p = 0.0071; AP, n.s. = 0.1438. DDC vs. DDC/Fex: ALT, ∗p = 0.0122; AST, n.s. = 0.093; AP, ∗p = 0.0146), and (F, H) H&E staining on liver samples from Fex/BDL and Fex/DDC mice. Analyses were done from n = 5-7 mice. Representative images are shown from 20x (A, C, D) and 10x (E, H) magnification. Values are mean ± SEM. Statistical differences were determined using Welch’s t-test. BDL, Bile duct ligation; 4-HNE, 4-hydroxynonenal; DCA, Deoxycholic acid; DDC, 3,5-diethoxycarbonyl-1,4-dihydrocollidine.
Fig. 5
Fig. 5
Vancomycin treatment reduces intestinal senescence in mice after BDL and DDC diet. (A) 16s qPCR in faecal samples (BDL vs. BDL/vanco, ∗∗∗p = 0.0002; DDC vs. DDC/vanco, ∗∗∗∗p <0.0001; Brown-Forsythe and Welch one-way ANOVA), (B) p16 immunofluorescence, (C) quantification of Ki67-positive cells (BDL vs. BDL/vanco, ∗∗∗∗p <0.0001; DDC vs. DDC/vanco, ∗∗∗∗p <0.0001; Welch’s t-test) (D) Lgr5 immunofluorescence on ileal samples from BDL and DDC-fed mice pre-treated with vancomycin (50 mg/kg) for 1 week before intervention and throughout the experiment. (E, F) Sirius red staining and quantification in livers (BDL vs. BDL/vanco, ∗p = 0.0442; DDC vs. DDC/vanco, n.s. p = 0.0562; Welch’s t-test) (G) Community composition at genus level from 16srRNA sequencing of faecal samples. Analyses were done from n = 5-11 mice. Representative images are shown from 20x (B, D) and 10x (E, F) magnification. BDL, Bile duct ligation; 4-HNE, 4-hydroxynonenal; DDC, 3,5-diethoxycarbonyl-1,4-dihydrocollidine.
Fig. 6
Fig. 6
Elimination of senescent cells exacerbates liver injury and fibrosis that is associated with IEC death and reduced tight junction protein expression during murine cholestatic disease. (A) Serum transaminase and AP (BDL vs. BDL/GCV: ALT, p = 0.2036; AST, p = 0.0814; AP, p = 0.2083; Welch’s t-test), (B) H&E, (C) Sirius Red staining and quantification of positively stained area on liver sections from p16-3MR mice at 5 days post BDL and BDL/GCV (25 mg/kg) treatment (BDL vs. BDL/GCV, ∗p = 0.0268; Welch’s t-test). (D) Quantification of Ki67-positive cells (0 days vs. BDL 5 days, ∗∗∗∗p <0.0001; BDL 5 days vs. BDL 5 days/GCV, ∗∗∗p <0.001; Brown-Forsythe and Welch one-way ANOVA). (E) Lgr5+ immunofluorescence, (F) TUNEL assay and (G) Occludin immunofluorescence in ileum and colon from BDL and BDL/GCV mice. Analyses were done from n = 5-13 mice. Representative images are shown from 10x (B, C) and 20x magnification. BDL, Bile duct ligation; 4-HNE, 4-hydroxynonenal.
Fig. 7
Fig. 7
Persistent elimination of senescent cells after ABT-263 treatment aggravates liver damage and fibrosis after DDC diet. (A) Serum transaminases and AP (DDC vs. DDC/ABT: ALT, ∗∗p = 0.0030; DDC vs. DDC/ABT1: ALT, n.s. p = 0.2542; DDC vs. DDC/ABT: AST, ∗p = 0.0497; DDC vs. DDC/ABT1: AST, n.s. p = 0.8317; DDC vs. DDC/ABT: AP, ∗p = 0.0143; DDC vs. DDC/ABT1: AP, n.s. p = 0.5013), (B) H&E and quantification of the percentage of necrotic areas (DDC vs. DDC/ABT, ∗p = 0.0410; DDC vs. DDC/ABT1, ∗p = 0.0295), (C) Sirius Red staining and quantification of percentage of positive area on liver sections (DDC vs. DDC/ABT, ∗p = 0.0346; DDC vs. DDC/ABT1, n.s. p = 0.7464), (D) Quantification of Ki67-positive cells (DDC vs. DDC/ABT, ∗∗∗∗p <0.0001; DDC vs. DDC/ABT1, ∗∗∗p = 0.0007) (E) Lgr5 immunofluorescence, (F) TUNEL assay and (G) occludin immunofluorescence on ileal samples. All from DDC-fed mice treated with ABT-263 from day 1 to the end of the experiment (7 days; DDC/ABT) or only at day 1, 2 and 3 of DDC feeding (DDC/ABT1). Analyses were done from n = 5-7 mice. Representative images are shown from 10x (B, C) and 20x magnification. Values are mean ± SEM. Statistical differences were determined using Brown-Forsythe and Welch one-way ANOVA. DDC, 3,5-diethoxycarbonyl-1,4-dihydrocollidine.
Fig. 8
Fig. 8
Elimination of senescent cells with the senolytic ABT-263 at later stage exacerbates liver injury and fibrosis after BDL. (A) Serum transaminases and AP (BDL vs. BDL/ABT: ALT, ∗∗p = 0.0060; BDL vs. BDL/ABT2: ALT, n.s. p = 0.1626; BDL vs. BDL/ABT: AST, ∗p = 0.0250; BDL vs. BDL/ABT2: ALT, ∗p = 0.0476; BDL vs. BDL/ABT: AP, n.s. p = 0.9900; BDL vs. BDL/ABT2: AP, n.s. p = 0.9912), (B) H&E and quantification of the percentage of necrotic areas (BDL vs. BDL/ABT, ∗∗p = 0.0017; BDL vs. BDL/ABT2, ∗∗∗p = 0.0002) (C) Sirius Red staining and quantification of percentage of positive area (BDL vs. BDL/ABT, ∗∗p = 0.0039; BDL vs. BDL/ABT2, ∗∗∗p = 0.0002) on liver sections, (D) TUNEL assay and (E) occludin immunofluorescence on ileal sections. (F) Community richness and (G) composition at family and (H) genus level analysis after 16s rRNA sequencing of faecal samples. (I) qPCR analysis detecting E. coli (BDL vs. BDL/ABT, ∗p = 0.0372; BDL vs. BDL/ABT2, ∗p = 0.0364) Analyses were done from n = 5-7 mice at 7 days for BDL, BDL/ABT and BDL/ABT2 treatment. Representative images are shown from 10x (B, C) and 20x magnification (D, E). Values are mean ± SEM. Statistical differences were determined using Brown-Forsythe and Welch one-way ANOVA. BDL, Bile duct ligation; 4-HNE, 4-hydroxynonenal.

Similar articles

Cited by

References

    1. Campisi J., d'Adda di Fagagna F. Cellular senescence: when bad things happen to good cells. Nat Rev Mol Cell Biol. 2007;8:729–740. - PubMed
    1. Munoz-Espin D., Serrano M. Cellular senescence: from physiology to pathology. Nat Rev Mol Cell Biol. 2014;15:482–496. - PubMed
    1. Ferreira-Gonzalez S., Lu W.Y., Raven A., et al. Paracrine cellular senescence exacerbates biliary injury and impairs regeneration. Nat Commun. 2018;9:1020. - PMC - PubMed
    1. Sasaki M., Ikeda H., Haga H., et al. Frequent cellular senescence in small bile ducts in primary biliary cirrhosis: a possible role in bile duct loss. J Pathol. 2005;205:451–459. - PubMed
    1. Tabibian J.H., O'Hara S.P., Splinter P.L., Trussoni C.E., et al. Cholangiocyte senescence by way of N-ras activation is a characteristic of primary sclerosing cholangitis. Hepatology. 2014;59:2263–2275. - PMC - PubMed

LinkOut - more resources