

Clinical decision support systems for 3-month mortality in elderly patients admitted to ICU with ischemic stroke using interpretable machine learning
- PMID: 39314817
- PMCID: PMC11418257
- DOI: 10.1177/20552076241280126
Clinical decision support systems for 3-month mortality in elderly patients admitted to ICU with ischemic stroke using interpretable machine learning
Abstract
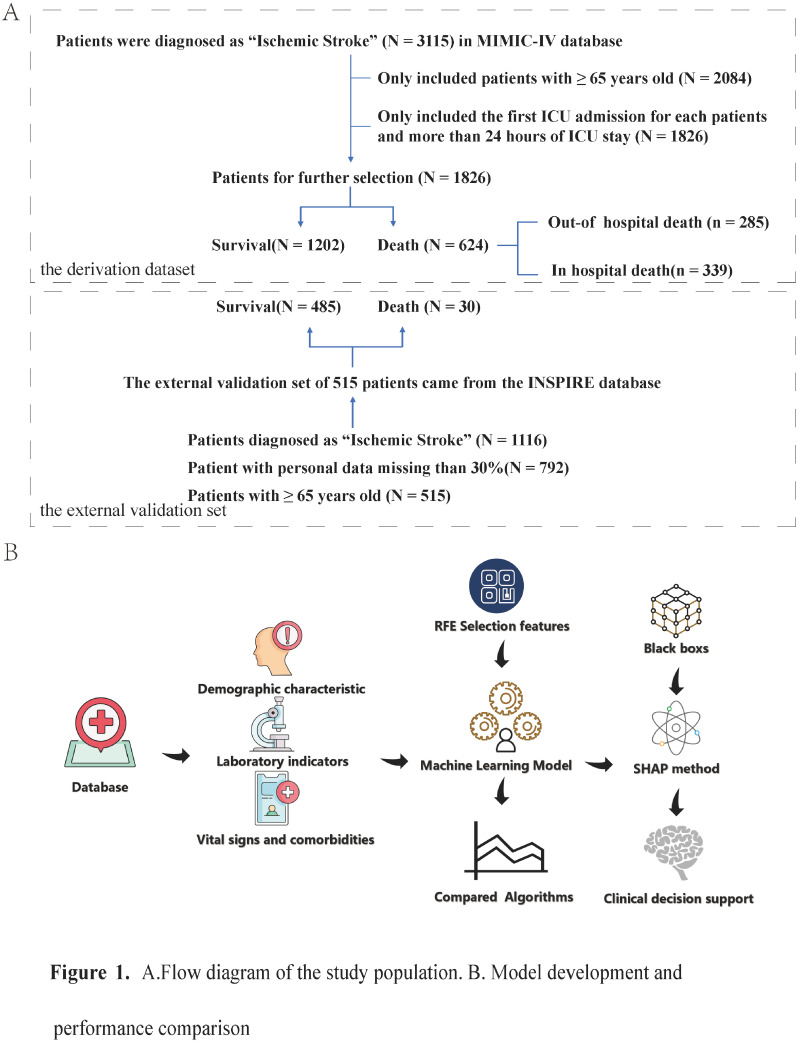
Background: Elderly patients are more likely to suffer from severe ischemic stroke (IS) and have worse outcomes, including death and disability. We aimed to develop and validate predictive models using novel machine learning algorithms for the 3-month mortality in elderly patients with IS admitted to the intensive care unit (ICU).
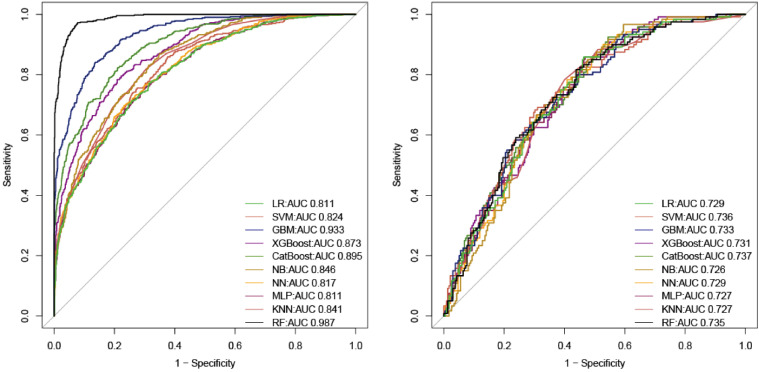
Methods: We conducted a retrospective cohort study. Data were extracted from Medical Information Mart for Intensive Care (MIMIC)-IV and International Stroke Perfusion Imaging Registry (INSPIRE) database. Ten machine learning algorithms including Categorical Boosting (CatBoost), Random Forest (RF), Support Vector Machine (SVM), Neural Network (NN), Gradient Boosting Machine (GBM), K-Nearest Neighbors (KNNs), Multi-Layer Perceptron (MLP), Naive Bayes (NB), eXtreme Gradient Boosting (XGBoost) and Logistic Regression (LR) were used to build the models. Performance was measured using area under the curve (AUC) and accuracy. Finally, interpretable machine learning (IML) models presenting as Shapley additive explanation (SHAP) values were applied for mortality risk prediction.
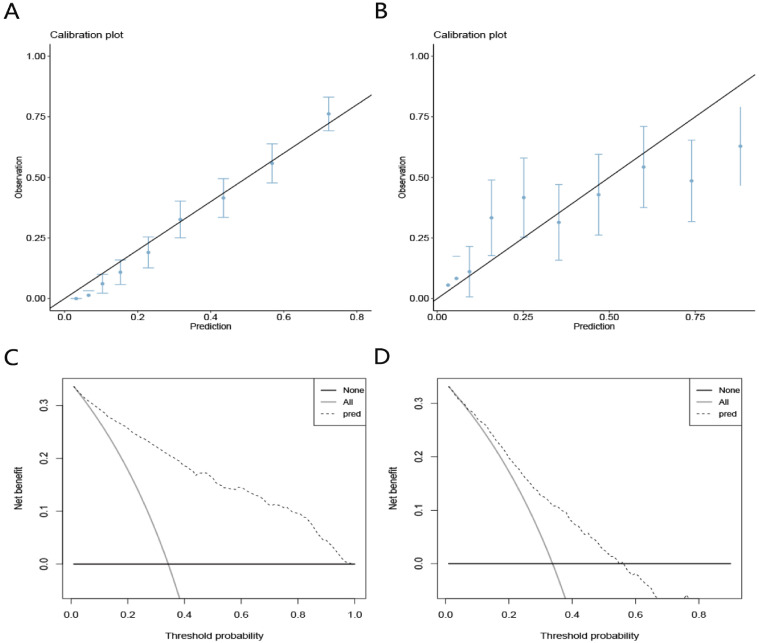
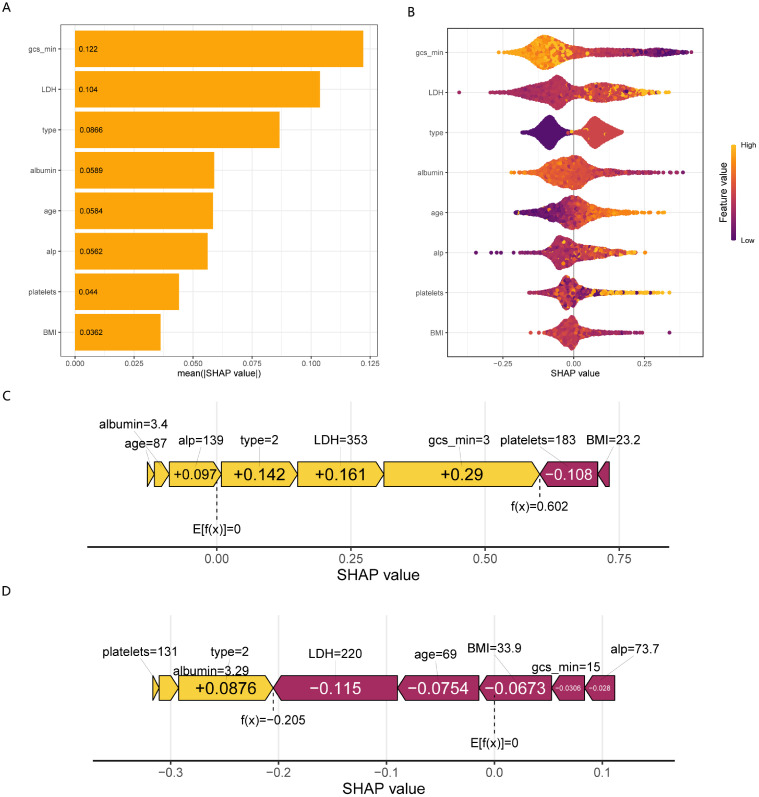
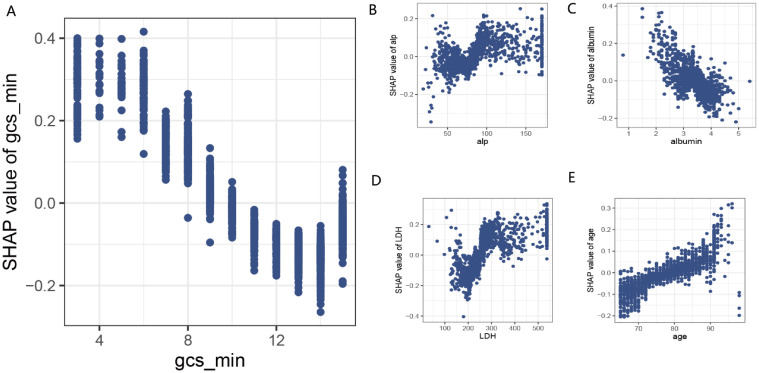
Results: A total of 1826 elderly patients with IS admitted to the ICU were included in the analysis, of whom 624 (34.2%) died, and endovascular treatment was performed in 244 patients. After feature selection, a total of eight variables, including minimum Glasgow Coma Scale values, albumin, lactate dehydrogenase, age, alkaline phosphatase, body mass index, platelets, and types of surgery, were finally used for model construction. The AUCs of the CatBoost model were 0.737 in the testing set and 0.709 in the external validation set. The Brier scores in the training set and testing set were 0.12 and 0.21, respectively. The IML of the CatBoost model was performed based on the SHAP value and the Local Interpretable Model-Agnostic Explanations method.
Conclusion: The CatBoost model had the best predictive performance for predicting mortality in elderly patients with IS admitted to the ICU. The IML model would further aid in clinical decision-making and timely healthcare services by the early identification of high-risk patients.
Keywords: Prediction model; elderly patients; hospital mortality; ischemic stroke; machine learning.
© The Author(s) 2024.
Conflict of interest statement
The authors declared no potential conflicts of interest with respect to the research, authorship, and/or publication of this article.
Figures
Similar articles
-
Development and validation of an interpretable machine learning model for predicting in-hospital mortality for ischemic stroke patients in ICU.Int J Med Inform. 2025 Jun;198:105874. doi: 10.1016/j.ijmedinf.2025.105874. Epub 2025 Mar 9. Int J Med Inform. 2025. PMID: 40073651
-
Interpretable machine learning for predicting 28-day all-cause in-hospital mortality for hypertensive ischemic or hemorrhagic stroke patients in the ICU: a multi-center retrospective cohort study with internal and external cross-validation.Front Neurol. 2023 Aug 8;14:1185447. doi: 10.3389/fneur.2023.1185447. eCollection 2023. Front Neurol. 2023. PMID: 37614971 Free PMC article.
-
Twenty-eight-day in-hospital mortality prediction for elderly patients with ischemic stroke in the intensive care unit: Interpretable machine learning models.Front Public Health. 2023 Jan 12;10:1086339. doi: 10.3389/fpubh.2022.1086339. eCollection 2022. Front Public Health. 2023. PMID: 36711330 Free PMC article. Clinical Trial.
-
Artificial intelligence in clinical care amidst COVID-19 pandemic: A systematic review.Comput Struct Biotechnol J. 2021;19:2833-2850. doi: 10.1016/j.csbj.2021.05.010. Epub 2021 May 7. Comput Struct Biotechnol J. 2021. PMID: 34025952 Free PMC article. Review.
-
Interpretable machine learning model to predict surgical difficulty in laparoscopic resection for rectal cancer.Front Oncol. 2024 Feb 6;14:1337219. doi: 10.3389/fonc.2024.1337219. eCollection 2024. Front Oncol. 2024. PMID: 38380369 Free PMC article. Review.
Cited by
-
Methodological development study: Dynamic mask attention graph neural network for mechanical ventilation in elderly intensive care unit patients.Digit Health. 2025 Jul 30;11:20552076251361680. doi: 10.1177/20552076251361680. eCollection 2025 Jan-Dec. Digit Health. 2025. PMID: 40755963 Free PMC article.
References
-
- Katan M, Luft A. Global burden of stroke. Semin Neurol 2018; 38: 208–211. - PubMed
-
- Feigin VL, Lawes CM, Bennett DA, et al. Stroke epidemiology: a review of population-based studies of incidence, prevalence, and case-fatality in the late 20th century. Lancet Neurol 2003; 2: 43–53. - PubMed
-
- Rosamond W, Flegal K, Furie K, et al. Heart disease and stroke statistics–2008 update: a report from the American Heart Association statistics committee and stroke statistics subcommittee. Circulation 2008; 117: e25–146. - PubMed
-
- Powell JL, Cook IG. Global ageing in comparative perspective: a critical discussion. Int J Sociol Soc Policy 2009; 29: 388–400.
-
- Béjot Y. Forty years of descriptive epidemiology of stroke. Neuroepidemiology 2022; 56: 157–162. - PubMed
LinkOut - more resources
Full Text Sources
