

This is a preprint.
Timely vaccine strain selection and genomic surveillance improves evolutionary forecast accuracy of seasonal influenza A/H3N2
- PMID: 39314963
- PMCID: PMC11419249
- DOI: 10.1101/2024.09.11.24313489
Timely vaccine strain selection and genomic surveillance improves evolutionary forecast accuracy of seasonal influenza A/H3N2
Abstract
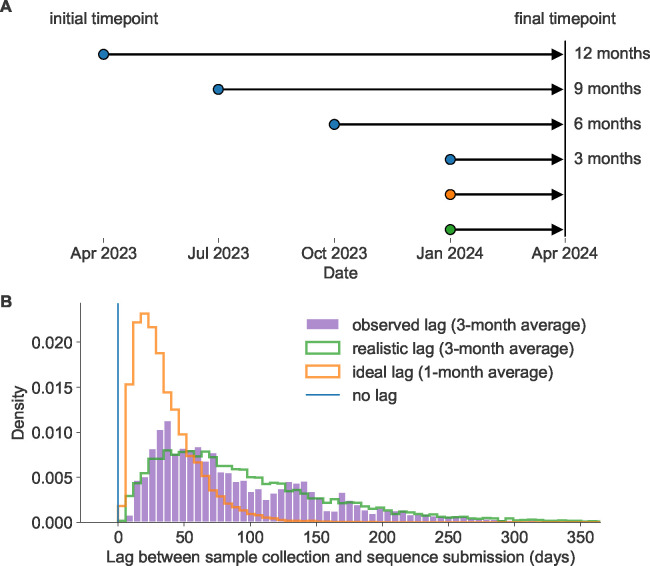
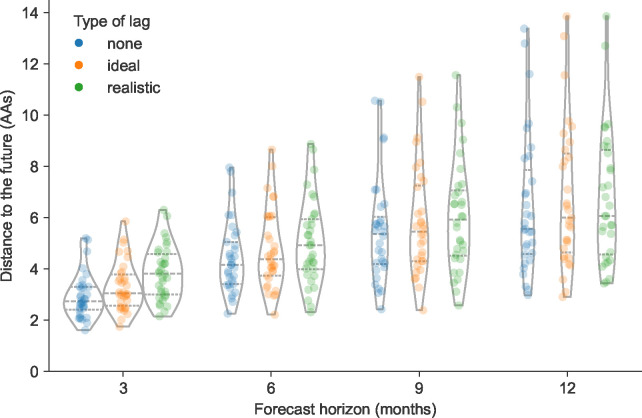
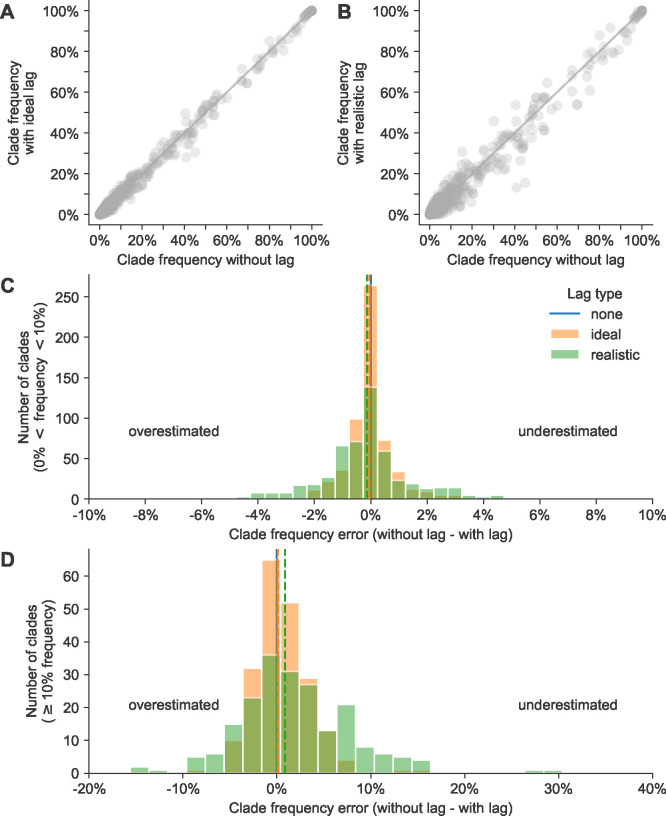
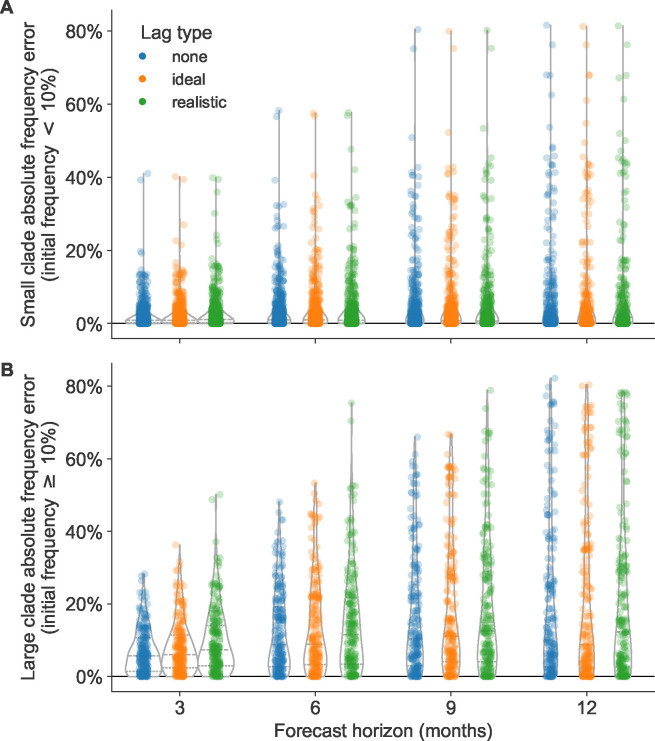
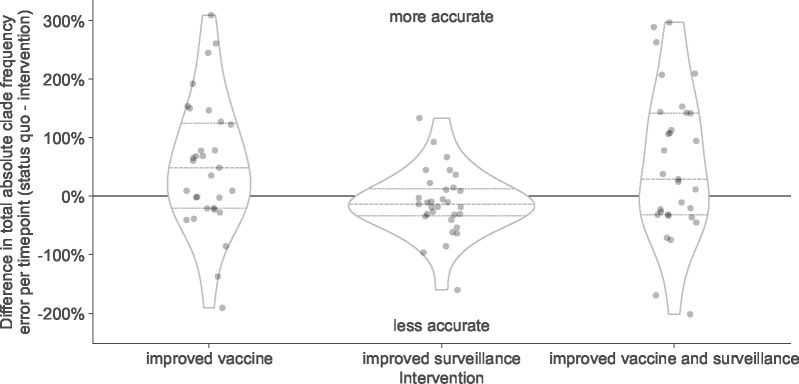
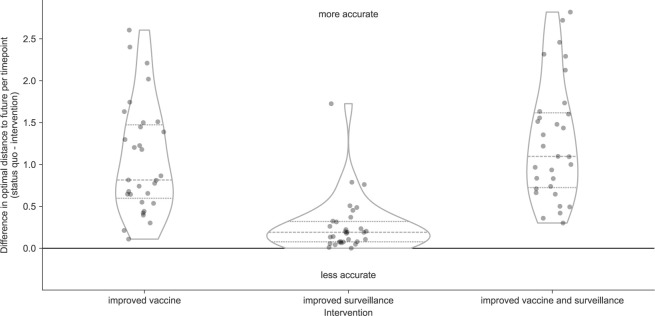
For the last decade, evolutionary forecasting models have influenced seasonal influenza vaccine design. These models attempt to predict which genetic variants circulating at the time of vaccine strain selection will be dominant 12 months later in the influenza season targeted by vaccination campaign. Forecasting models depend on hemagglutinin (HA) sequences from the WHO's Global Influenza Surveillance and Response System to identify currently circulating groups of related strains (clades) and estimate clade fitness for forecasts. However, the average lag between collection of a clinical sample and the submission of its sequence to the Global Initiative on Sharing All Influenza Data (GISAID) EpiFlu database is ~3 months. Submission lags complicate the already difficult 12-month forecasting problem by reducing understanding of current clade frequencies at the time of forecasting. These constraints of a 12-month forecast horizon and 3-month average submission lags create an upper bound on the accuracy of any long-term forecasting model. The global response to the SARS-CoV-2 pandemic revealed that modern vaccine technology like mRNA vaccines can reduce how far we need to forecast into the future to 6 months or less and that expanded support for sequencing can reduce submission lags to GISAID to 1 month on average. To determine whether these recent advances could also improve long-term forecasts for seasonal influenza, we quantified the effects of reducing forecast horizons and submission lags on the accuracy of forecasts for A/H3N2 populations. We found that reducing forecast horizons from 12 months to 6 or 3 months reduced average absolute forecasting errors to 25% and 50% of the 12-month average, respectively. Reducing submission lags provided little improvement to forecasting accuracy but decreased the uncertainty in current clade frequencies by 50%. These results show the potential to substantially improve the accuracy of existing influenza forecasting models by modernizing influenza vaccine development and increasing global sequencing capacity.
Conflict of interest statement
Competing interests The authors declare that no competing interests exist.
Figures
Similar articles
-
Forecasting Influenza Epidemics in Hong Kong.PLoS Comput Biol. 2015 Jul 30;11(7):e1004383. doi: 10.1371/journal.pcbi.1004383. eCollection 2015 Jul. PLoS Comput Biol. 2015. PMID: 26226185 Free PMC article.
-
On the lookout for influenza viruses in Italy during the 2021-2022 season: Along came A(H3N2) viruses with a new phylogenetic makeup of their hemagglutinin.Virus Res. 2023 Jan 15;324:199033. doi: 10.1016/j.virusres.2022.199033. Epub 2022 Dec 26. Virus Res. 2023. PMID: 36581046 Free PMC article.
-
How New Mexico Leveraged a COVID-19 Case Forecasting Model to Preemptively Address the Health Care Needs of the State: Quantitative Analysis.JMIR Public Health Surveill. 2021 Jun 9;7(6):e27888. doi: 10.2196/27888. JMIR Public Health Surveill. 2021. PMID: 34003763 Free PMC article.
-
Influenza virus vaccine live intranasal--MedImmune vaccines: CAIV-T, influenza vaccine live intranasal.Drugs R D. 2003;4(5):312-9. doi: 10.2165/00126839-200304050-00007. Drugs R D. 2003. PMID: 12952502 Review.
-
Influenza forecasting in human populations: a scoping review.PLoS One. 2014 Apr 8;9(4):e94130. doi: 10.1371/journal.pone.0094130. eCollection 2014. PLoS One. 2014. PMID: 24714027 Free PMC article.
Cited by
-
Forecasting framework for dominant SARS-CoV-2 strains before clade replacement using phylogeny-informed genetic distances.Front Microbiol. 2025 Jun 20;16:1619546. doi: 10.3389/fmicb.2025.1619546. eCollection 2025. Front Microbiol. 2025. PMID: 40620492 Free PMC article.
References
-
- Baden LR, El Sahly HM, Essink B, Kotloff K, Frey S, Novak R, Diemert D, Spector SA, Rouphael N, Creech CB, McGettigan J, Khetan S, Segall N, Solis J, Brosz A, Fierro C, Schwartz H, Neuzil K, Corey L, Gilbert P, et al. Efficacy and Safety of the mRNA-1273 SARS-CoV-2 Vaccine. N Engl J Med. 2021. Feb; 384(5):403–416. - PMC - PubMed
-
- Brazzoli M, Magini D, Bonci A, Buccato S, Giovani C, Kratzer R, Zurli V, Mangiavacchi S, Casini D, Brito LM, De Gregorio E, Mason PW, Ulmer JB, Geall AJ, Bertholet S. Induction of Broad-Based Immunity and Protective Efficacy by Self-amplifying mRNA Vaccines Encoding Influenza Virus Hemagglutinin. J Virol. 2016. Jan; 90(1):332–344. - PMC - PubMed
-
- Brito AF, Semenova E, Dudas G, Hassler GW, Kalinich CC, Kraemer MUG, Ho J, Tegally H, Githinji G, Agoti CN, Matkin LE, Whittaker C, Howden BP, Sintchenko V, Zuckerman NS, Mor O, Blankenship HM, de Oliveira T, Lin RTP, Siqueira MM, et al. Global disparities in SARS-CoV-2 genomic surveillance. Nat Commun. 2022. Nov; 13(1):7003. - PMC - PubMed
Publication types
Grants and funding
LinkOut - more resources
Full Text Sources
Miscellaneous