

Platinum-based chemotherapy promotes antigen presenting potential in monocytes of patients with high-grade serous ovarian carcinoma
- PMID: 39315092
- PMCID: PMC11417001
- DOI: 10.3389/fimmu.2024.1414716
Platinum-based chemotherapy promotes antigen presenting potential in monocytes of patients with high-grade serous ovarian carcinoma
Abstract
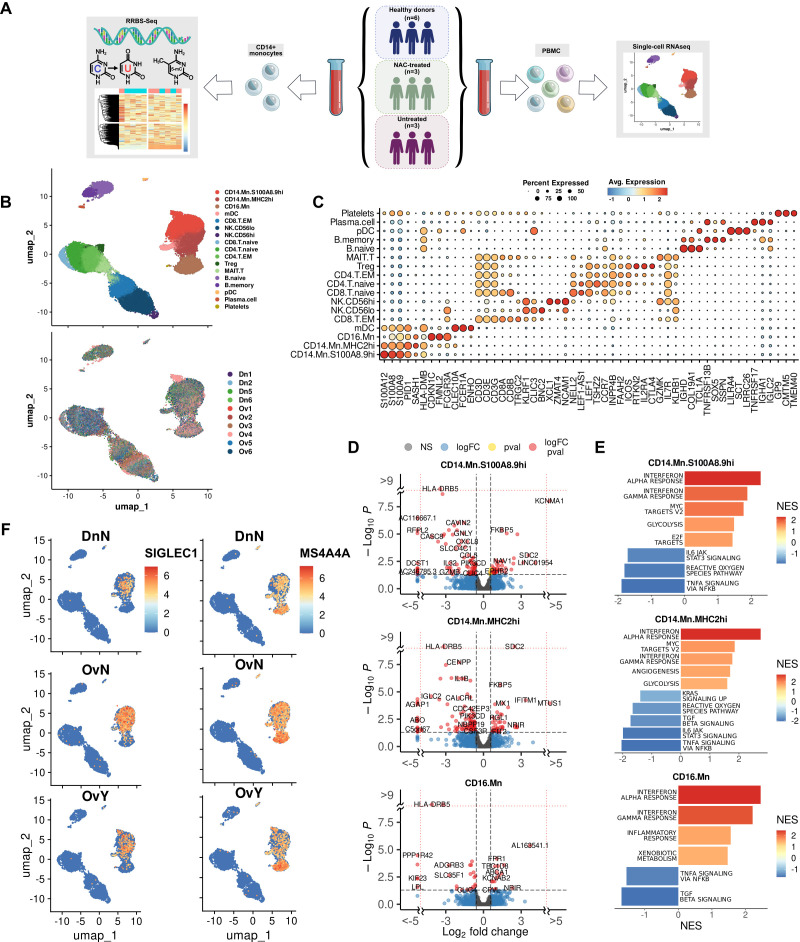
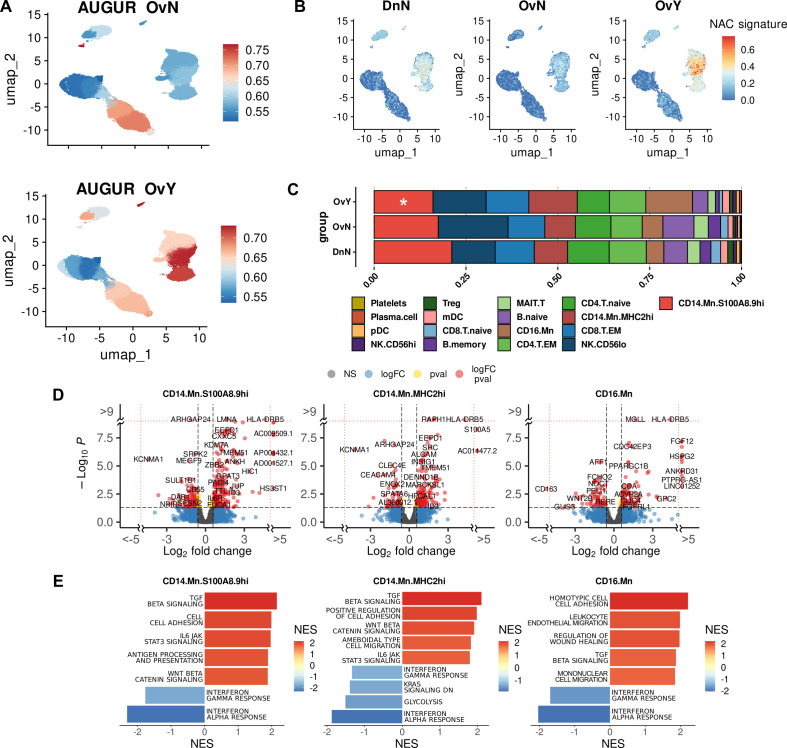
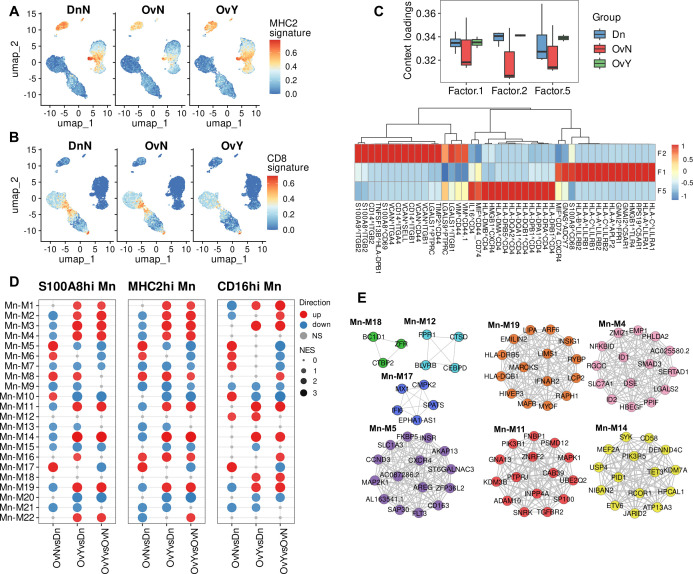
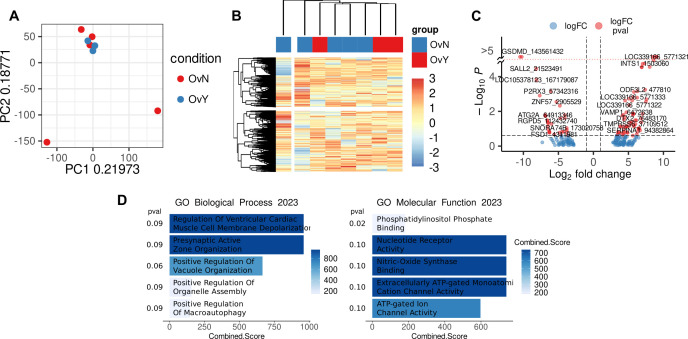
Ovarian cancer (OC) is the most lethal gynecologic malignancy worldwide. The major clinical challenge includes the asymptomatic state of the disease, making diagnosis possible only at advanced stages. Another OC complication is the high relapse rate and poor prognosis following the standard first-line treatment with platinum-based chemotherapy. At present, numerous clinical trials are being conducted focusing on immunotherapy in OC; nevertheless, there are still no FDA-approved indications. Personalized decision regarding the immunotherapy, including immune checkpoint blockade and immune cell-based immunotherapies, can depend on the effective antigen presentation required for the cytotoxic immune response. The major aim of our study was to uncover tumor-specific transcriptional and epigenetic changes in peripheral blood monocytes in patients with high-grade serous ovarian cancer (HGSOC). Another key point was to elucidate how chemotherapy can reprogram monocytes and how that relates to changes in other immune subpopulations in the blood. To this end, we performed single-cell RNA sequencing of peripheral blood mononuclear cells (PBMCs) from patients with HGSOC who underwent neoadjuvant chemotherapeutic treatment (NACT) and in treatment-naïve patients. Monocyte cluster was significantly affected by tumor-derived factors as well as by chemotherapeutic treatment. Bioinformatical analysis revealed three distinct monocyte subpopulations within PBMCs based on feature gene expression - CD14.Mn.S100A8.9hi, CD14.Mn.MHC2hi and CD16.Mn subsets. The intriguing result was that NACT induced antigen presentation in monocytes by the transcriptional upregulation of MHC class II molecules, but not by epigenetic changes. Increased MHC class II gene expression was a feature observed across all three monocyte subpopulations after chemotherapy. Our data also demonstrated that chemotherapy inhibited interferon-dependent signaling pathways, but activated some TGFb-related genes. Our results can enable personalized decision regarding the necessity to systemically re-educate immune cells to prime ovarian cancer to respond to anti-cancer therapy or to improve personalized prescription of existing immunotherapy in either combination with chemotherapy or a monotherapy regimen.
Keywords: antigen presentation; chemotherapy; methylation; monocyte; ovarian cancer; single cell sequencing; transcriptome.
Copyright © 2024 Larionova, Iamshchikov, Kazakova, Rakina, Menyalo, Enikeeva, Rafikova, Sharifyanova, Pavlov, Villert, Kolomiets and Kzhyshkowska.
Conflict of interest statement
The authors declare that the research was conducted in the absence of any commercial or financial relationships that could be construed as a potential conflict of interest. The author(s) declared that they were an editorial board member of Frontiers, at the time of submission. This had no impact on the peer review process and the final decision.
Figures
References
-
- observatory gc. Ovary (2022). Available online at: https://gco.iarc.who.int/media/globocan/factsheets/cancers/25-ovary-fact... (Accessed April 9, 2024).
-
- Frances Reid AB. The World Ovarian Cancer Coalition Atlas 2023: Global Trends in Incidence, Mortality, and Survival: World ovarian cancer coalition (2023). Available online at: https://worldovariancancercoalition.org/wp-content/uploads/2023/04/World... (Accessed April 9, 2024).
MeSH terms
LinkOut - more resources
Full Text Sources
Medical
Molecular Biology Databases
Research Materials