

Data-driven analysis that integrates bioinformatics and machine learning uncovers PANoptosis-related diagnostic genes in early pediatric septic shock
- PMID: 39315170
- PMCID: PMC11417315
- DOI: 10.1016/j.heliyon.2024.e37853
Data-driven analysis that integrates bioinformatics and machine learning uncovers PANoptosis-related diagnostic genes in early pediatric septic shock
Abstract
Objectives: Sepsis is one of the leading causes of death for children worldwide. Additionally, refractory septic shock is one of the most significant groups that contributes to a high death rate. The interaction of pyroptosis, apoptosis, and necroptosis results in a unique inflammatory cell death mechanism known as PANoptosis. An increasing amount of evidence suggests that PANoptosis can be brought on by several stimuli, including cytokine storms, malignancy, and bacterial or viral infections. The goal of this study is to improve the diagnostic significance of the PANoptosis-related gene signature in early pediatric septic shock.
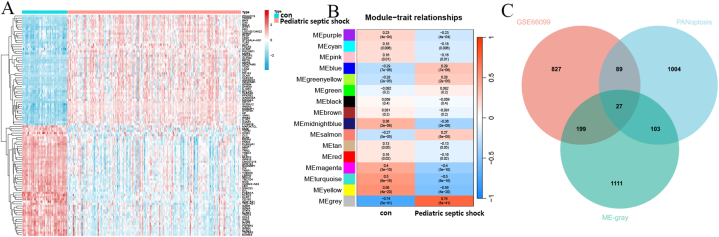
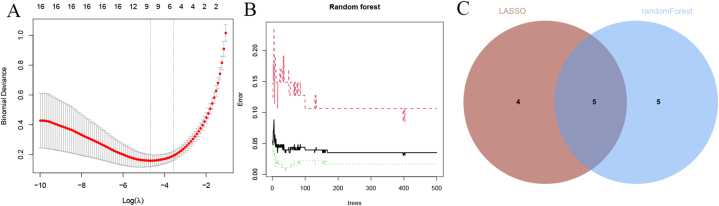
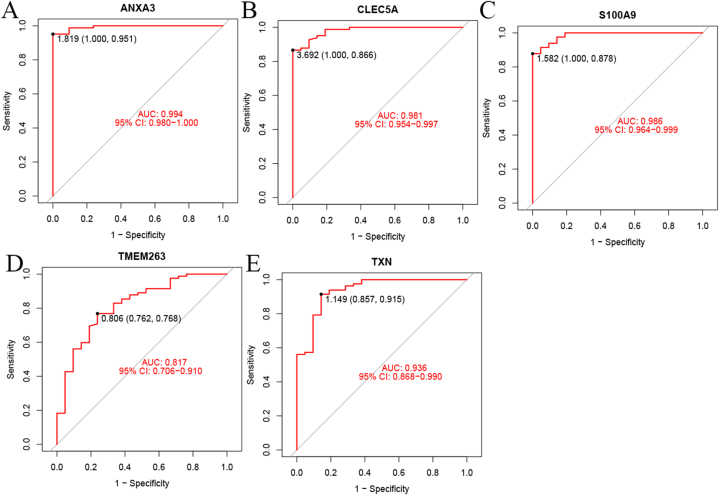
Design and methods: We examined children with septic shock from the GSE66099 discovery cohort and looked at differentially expressed genes (DEGs). To filter the important modules, weighted gene co-expression network analysis (WCGNA) was employed. In the end, random forest analysis and the least absolute shrinkage and selection operator (LASSO) were used to determine the PANoptosis diagnostic signature genes. To determine the PANoptosis signature genes, we also found four validation cohorts: GSE26378, GSE26440, GSE8121, and GSE13904. The area under the curve (AUC) of the receiver operating characteristic curves (ROCs), along with sensitivity, specificity, positive predictive value, and negative predictive value, were used to assess the diagnostic efficacy of these signature genes.
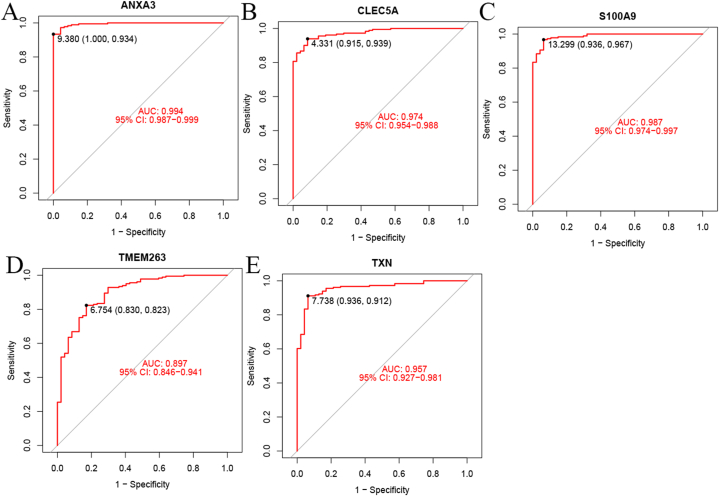
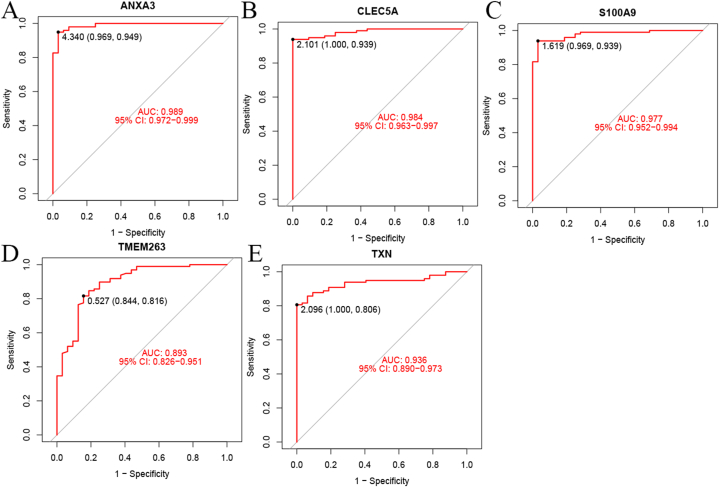
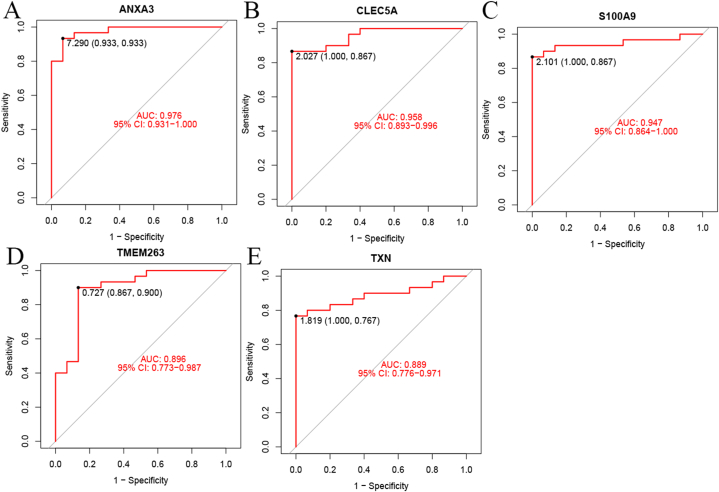
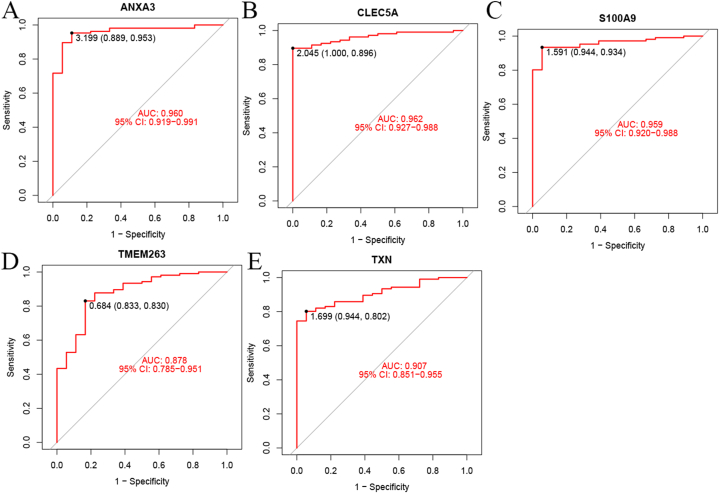
Results: From GSE66099, 1142 DEGs in total were tested. Following the WGCNA clustering of the data into 16 modules, the MEgrey module showed a significant correlation with pediatric septic shock (p < 0.0001). Following the use of LASSO and random forest algorithms to identify the PANoptosis-related signature genes, which include ANXA3, S100A9, TXN, CLEC5A, and TMEM263. These signature genes' receiver operating characteristic curves (ROCs) were confirmed in the external dataset from GSE26378, GSE26440, GSE8121, and GSE13904, and were 0.994 (95 % CI 0.987-0.999), 0.987 (95 % CI 0.974-0.997), 0.957 (95 % CI 0.927-0.981), 0.974 (95 % CI 0.954-0.988), 0.897 (95 % CI 0.846-0.941), respectively.
Conclusion: In summary, the discovery of PANoptosis genes, ANXA3, S100A9, TXN, CLEC5A, and TMEM263 proved to be quite helpful in the early detection of pediatric septic shock patients. These early results, which need to be further confirmed in basic and clinical research, are extremely important for understanding immune cell infiltration in the pathophysiology of pediatric septic shock.
Keywords: Diagnostic biomarker; Early pediatric septic shock; PANoptosis.
© 2024 The Authors.
Conflict of interest statement
The authors declare that they have no known competing financial interests or personal relationships that could have appeared to influence the work reported in this paper.
Figures


Similar articles
-
Analysis of signature genes and association with immune cells infiltration in pediatric septic shock.Front Immunol. 2022 Nov 10;13:1056750. doi: 10.3389/fimmu.2022.1056750. eCollection 2022. Front Immunol. 2022. PMID: 36439140 Free PMC article.
-
Six potential biomarkers in septic shock: a deep bioinformatics and prospective observational study.Front Immunol. 2023 Jun 8;14:1184700. doi: 10.3389/fimmu.2023.1184700. eCollection 2023. Front Immunol. 2023. PMID: 37359526 Free PMC article.
-
The PANoptosis-related hippocampal molecular subtypes and key biomarkers in Alzheimer's disease patients.Sci Rep. 2024 Oct 11;14(1):23851. doi: 10.1038/s41598-024-75377-2. Sci Rep. 2024. PMID: 39394418 Free PMC article.
-
Identification and Analysis of PANoptosis-Related Genes in Sepsis-Induced Lung Injury by Bioinformatics and Experimental Verification.J Inflamm Res. 2024 Mar 28;17:1941-1956. doi: 10.2147/JIR.S452608. eCollection 2024. J Inflamm Res. 2024. PMID: 38562657 Free PMC article.
-
Identification of early Alzheimer's disease subclass and signature genes based on PANoptosis genes.Front Immunol. 2024 Nov 22;15:1462003. doi: 10.3389/fimmu.2024.1462003. eCollection 2024. Front Immunol. 2024. PMID: 39650656 Free PMC article.
Cited by
-
PANoptosis in Sepsis: A Central Role and Emerging Therapeutic Target.J Inflamm Res. 2025 May 13;18:6245-6261. doi: 10.2147/JIR.S513367. eCollection 2025. J Inflamm Res. 2025. PMID: 40386177 Free PMC article. Review.
-
Identification and validation of m6A RNA methylation and ferroptosis-related biomarkers in sepsis: transcriptome combined with single-cell RNA sequencing.Front Immunol. 2025 Mar 7;16:1543517. doi: 10.3389/fimmu.2025.1543517. eCollection 2025. Front Immunol. 2025. PMID: 40124361 Free PMC article.
References
LinkOut - more resources
Full Text Sources
Miscellaneous
