. 2024 Sep 4;10(18):e37086.
doi: 10.1016/j.heliyon.2024.e37086. eCollection 2024 Sep 30.

AGBL2 promotes renal cell carcinoma cells proliferation and migration via α-tubulin detyrosination

Affiliations

AGBL2 promotes renal cell carcinoma cells proliferation and migration via α-tubulin detyrosination

Wei Liu et al. Heliyon. .

Abstract

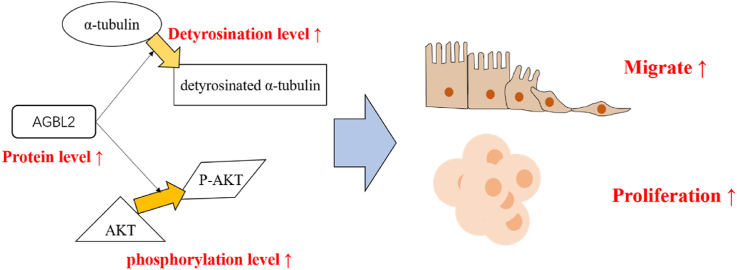
Background: AGBL2's role in tumorigenesis and cancer progression has been reported in several cancer studies, and it is closely associated with α-tubulin detyrosination. The roles of AGBL2 and α-tubulin detyrosination in renal cell carcinoma (RCC) pathogenesis remain unclear and require further investigation.

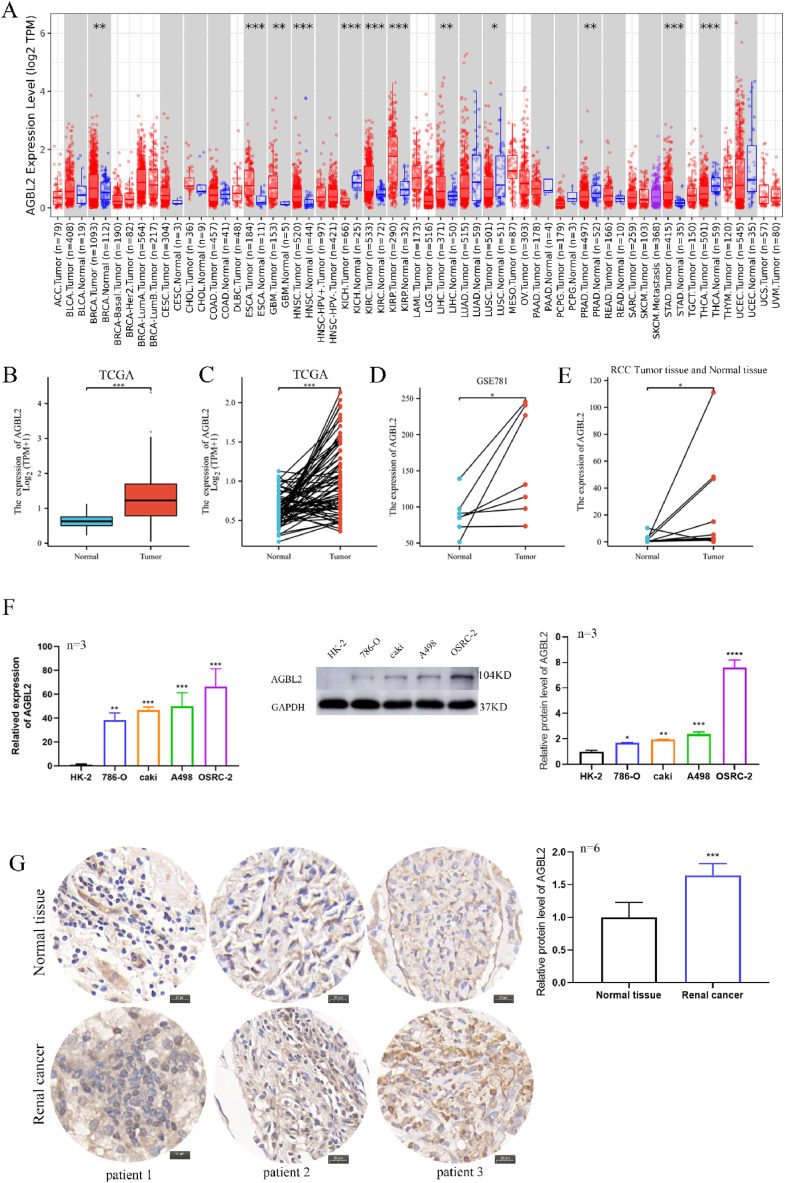
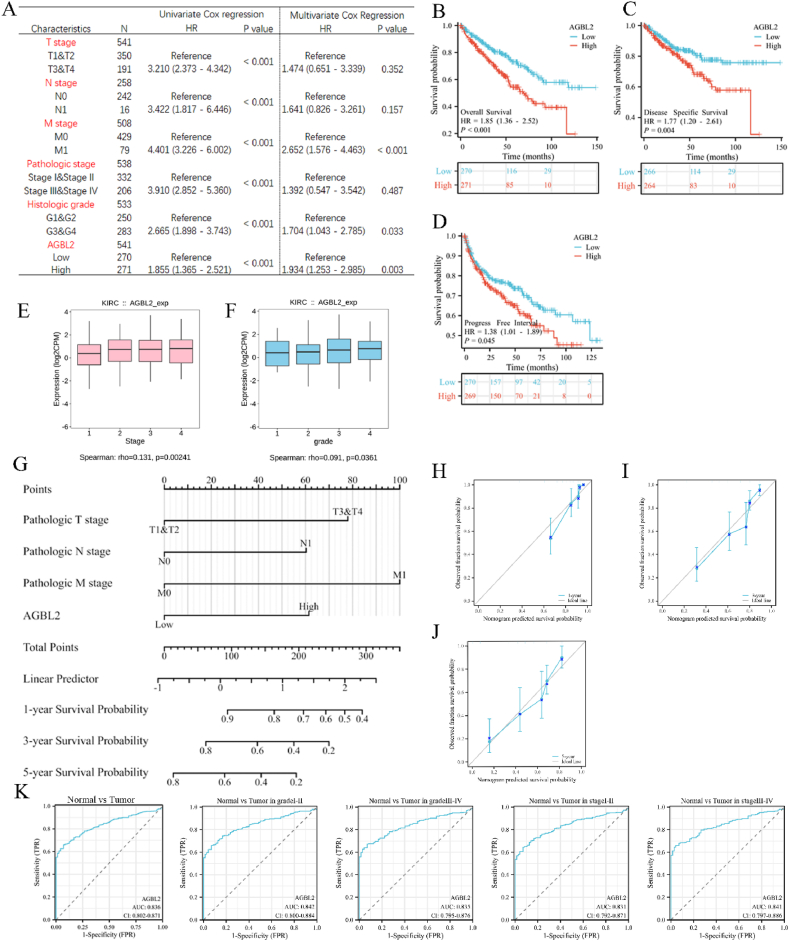
Methods: In this study, we conducted an analysis of AGBL2 expression differences between renal clear cell carcinoma tissues and normal tissues using data from The Cancer Genome Atlas (TCGA). We performed a comprehensive prognostic analysis of AGBL2 in Kidney Renal Clear Cell Carcinoma (KIRC) using univariate and multivariate Cox regression. Based on the results of the Cox analysis, we constructed a prognostic model to assess its predictive capabilities. Receiver Operating Characteristic (ROC) analysis confirmed the diagnostic value of AGBL2 in renal cancer. We conducted further validation by analyzing cancer tissue samples and renal cancer cell lines, which confirmed the role of AGBL2 in promoting RCC cell proliferation and migration through in vitro experiments. Additionally, we verified the impact of AGBL2's detyrosination on α-tubulin using the tubulin carboxypeptidase (TCP) inhibitor parthenolide. Finally, we performed sequencing analysis on AGBL2 knockdown 786-O cells to investigate the correlation between AGBL2, immune infiltration, and AKT phosphorylation. Moreover, we experimentally demonstrated the enhancing effect of AGBL2 on AKT phosphorylation.

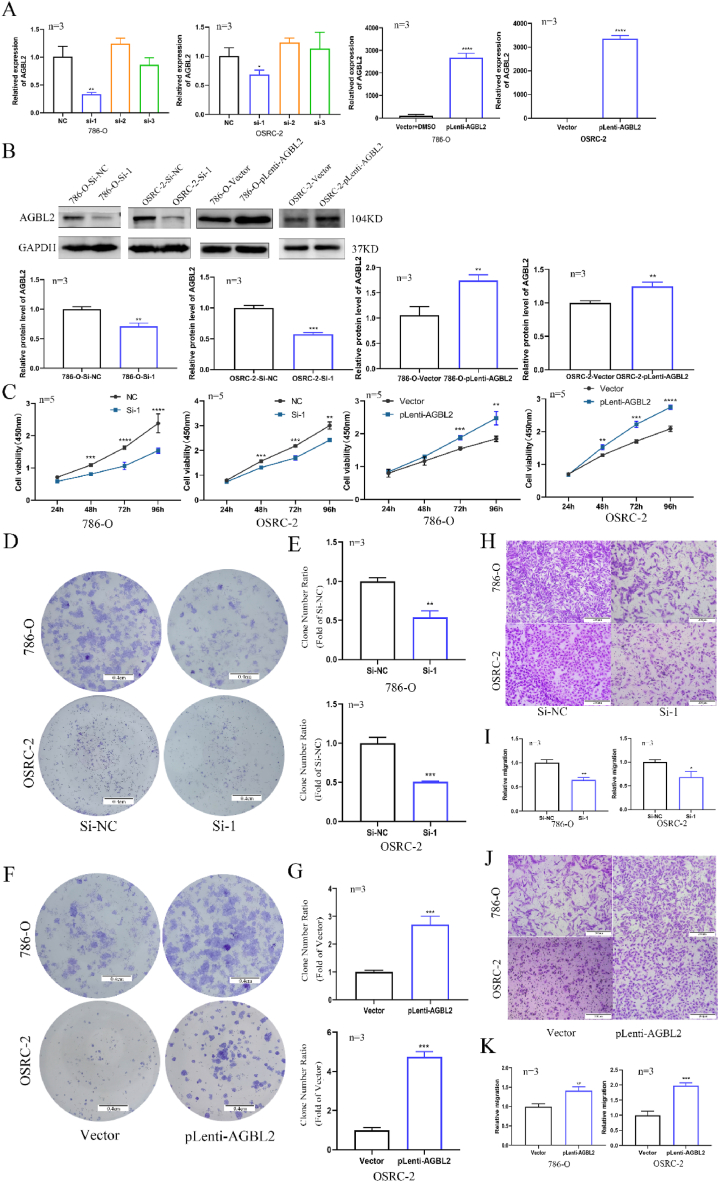
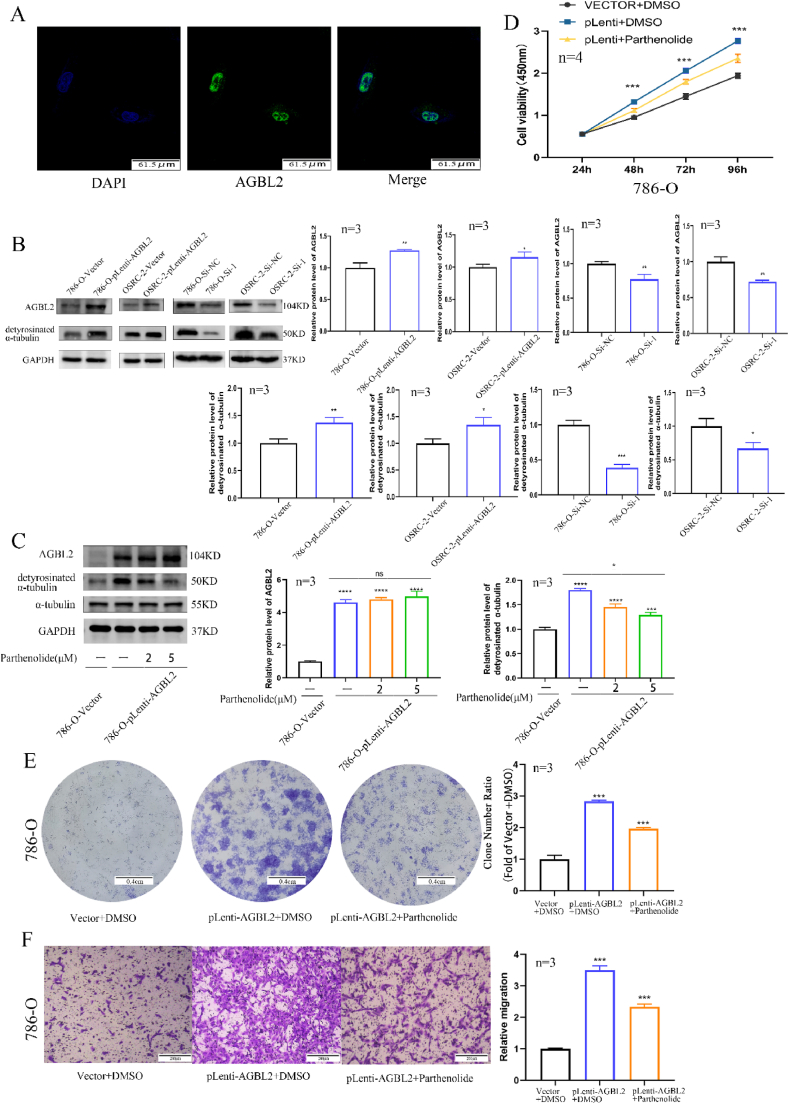
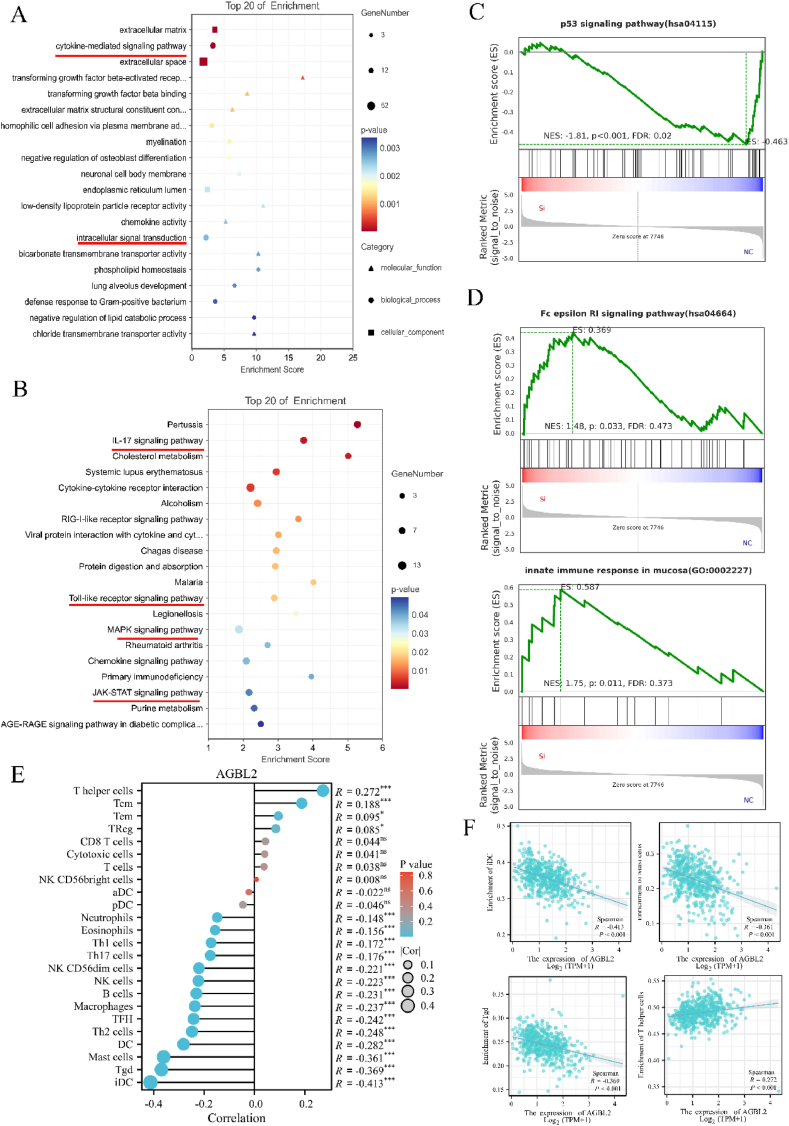
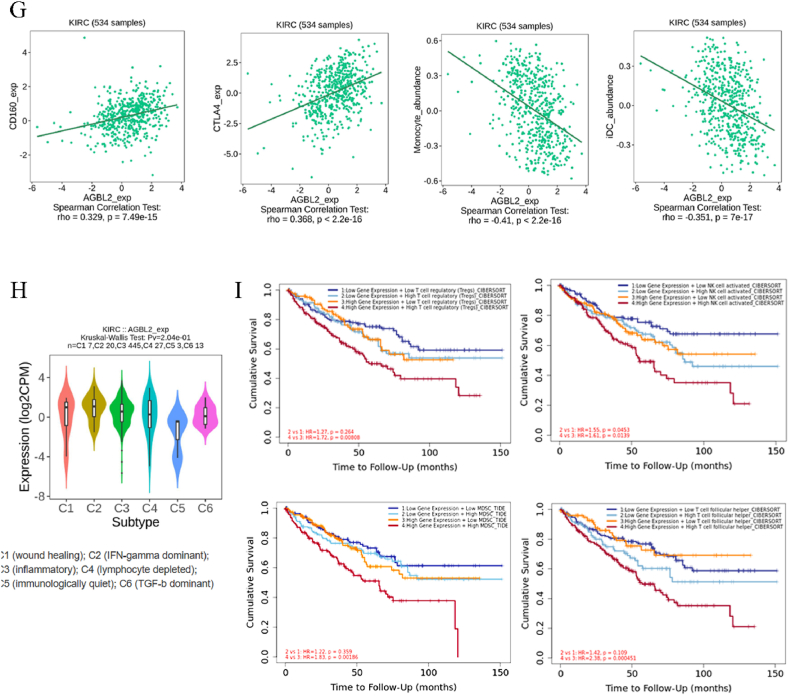
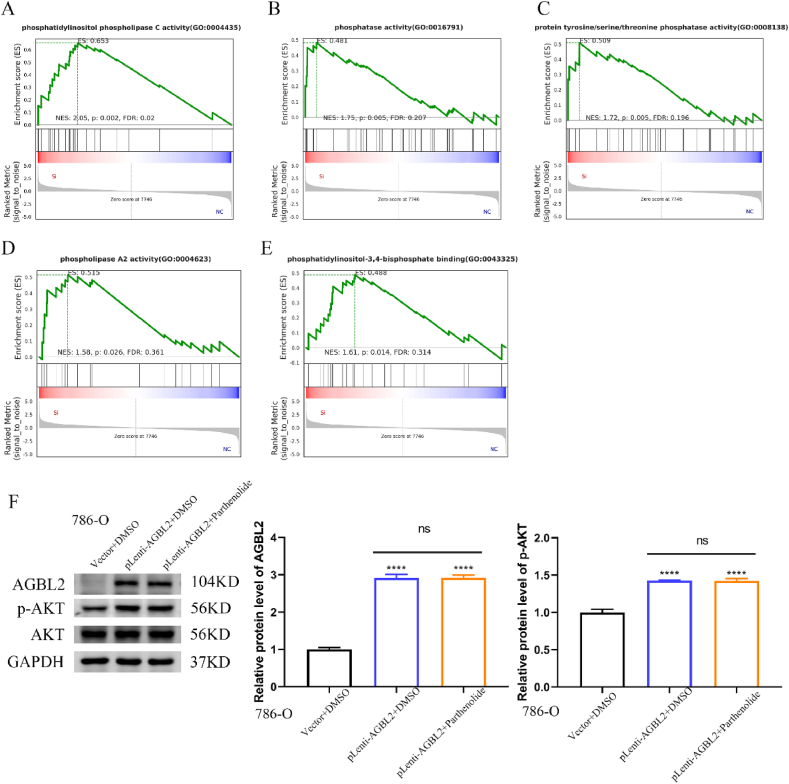
Results: TCGA analysis revealed a significant increase in AGBL2 expression in RCC patients, which was correlated with poorer overall survival (OS), disease-specific survival (DSS), and progression-free intervals (PFI). According to the analysis results, we constructed column-line plots to predict the 1-, 3-, and 5-year survival outcomes in RCC patients. Additionally, the calibration plots assessing the model's performance exhibited favorable agreement with the predicted outcomes. And the ROC curves showed that AGBL2 showed good diagnostic performance in KIRC (AUC = 0.836)). Cell phenotyping assays revealed that AGBL2 knockdown in RCC cells significantly inhibited cell proliferation and migration. Conversely, overexpression of AGBL2 resulted in increased cell proliferation and migration in RCC cells. We observed that AGBL2 is predominantly located in the nucleus and can elevate the detyrosination level of α-tubulin in RCC cells. Moreover, the enhancement of RCC cell proliferation and migration by AGBL2 was partially inhibited after treatment with the TCP inhibitor parthenolide. Analysis of the sequencing data revealed that AGBL2 is associated with a diverse array of biological processes, encompassing signal transduction and immune infiltration. Interestingly, AGBL2 expression exhibited a negative correlation with the majority of immune cell infiltrations. Additionally, AGBL2 was found to enhance the phosphorylation of AKT in RCC cells.

Conclusion: Our study suggests that AGBL2 fosters RCC cell proliferation and migration by enhancing α-tubulin detyrosination. Moreover, elevated AGBL2 expression increases phosphorylation of AKT in RCC cells.

Keywords: AGBL2; Detyrosination; Microtubules; Renal cell carcinoma.


Conflict of interest statement

The authors declare that they have no known competing financial interests or personal relationships that could have appeared to influence the work reported in this paper.

Figures

Image 1
Graphical abstract
Fig. 1
Fig. 1
AGBL2 is upregulated in renal cell carcinoma (A) A pan-cancer analysis of AGBL2 expression utilizing TIMER 2.0. (B, C) Analysis of AGBL2 expression in both unpaired and paired renal cancer tissues from the TCGA database. (D) Examination of AGBL2 expression levels within the GEO dataset GSE781. (E, F) Validation of AGBL2 expression across renal cancer tissues and cell lines. The results of Western Blotting demonstrate the protein levels of AGBL2 in the cell line, which were quantified using histograms. Data (n = 3)were analyzed, with statistical significance denoted as *p < 0.05; **p < 0.01; ***p < 0.001; ****p < 0.0001. (G) An immunohistochemical mapping of AGBL2 antibody staining in renal cancer tissue as opposed to normal renal tissue, where positive staining is indicated by a brown color (40×). The bar graphs are quantitative analyses of pathology sections from six patients with kidney cancer, and the pictures show images of pathology sections from three cancer patients.
Fig. 2
Fig. 2
Clinical value of AGBL2(A) Implementation of univariate Cox regression analysis and multivariate Cox regression analysis to evaluate the associations in renal cancer. (B–D) Illustration of Kaplan-Meier survival curves displaying the relationships between AGBL2 expression and Overall Survival (OS), Disease-Specific Survival (DSS), and Progression-Free Interval (PFI) in patients with Kidney Renal Clear Cell Carcinoma (KIRC). (E, F) Examination of the pathological stage and histological grade of renal cancer, with reference to AGBL2 expression, drawing on data sourced from TISIDB. (G–J) Construction of a nomogram to represent AGBL2 expression in renal cancer patients, accompanied by performance calibration graphs to assess predictive accuracy.(K) Presentation of Receiver Operating Characteristic (ROC) curves to highlight the diagnostic relevance of AGBL2 expression within the context of renal cancer.
Fig. 3
Fig. 3
AGBL2 promotes RCC cells migration and proliferation (A, B) Evaluation of the efficiency of AGBL2 knockdown and overexpression in renal cancer cell lines 786-O and OSRC-2; NC denotes negative control. (C–G) Investigation into alterations in cellular proliferation capacity following the knockdown and overexpression of AGBL2, as observed in plate clones and the CCK-8 assay. (H–L) Examination of changes in the migratory abilities of 786-O and OSRC-2 cells in Transwell assays, consequent to either knockdown or overexpression of AGBL2; Scale bars represent 200 μm. Each experiment was repeated at least three times (“n” in the picture indicates the number of experimental data), with statistical significance denoted as *p < 0.05; **p < 0.01; ***p < 0.001; ****p < 0.0001.
Fig. 4
Fig. 4
AGBL2 facilitates renal cancer progression via increased α-tubulin detyrosination.(A) Visualization of the intracellular localization of AGBL2 (indicated in green) by immunofluorescence experiments, with nuclear staining depicted in blue. Scale bars represent 61.5 μm (B) Western blot analysis to assess AGBL2 knockdown (Si-1) and overexpression (pLenti-AGBL2), as well as detyrosinated α-tubulin levels in 786-O and OSRC-2 cell lines, utilizing GAPDH as an internal reference. The results of Western Blotting were quantified using histograms. Data (n = 3)were analyzed. (C) Western blot analysis of AGBL2, detyrosinated tubulin, and GAPDH in 786-O cells infected with lentiviral solution (pLenti-CMV-AGBL2-GFP-Puro or vector), and treated with DMSO (negative control) or a designated concentration of parthenolide (0, 2, 5 μmol/L)for 48 h, data (n = 3)were analyzed. (D,E)786-O cells were infected with lentiviral solution (pLenti-CMV-AGBL2-GFP-Puro or vector), incubated for 48 h, and assayed for proliferation in the presence of DMSO (negative control) or 5 μmol/L parthenolide, data (n = 4)were analyzed. (F) 786-O cells, infected with lentiviral solution (pLenti-CMV-AGBL2-GFP-Puro or vector) and incubated for 48 h, were assayed for migratory capacity in the presence of DMSO (negative control) or 5 μmol/L parthenolide. Each experiment was repeated at least three times (“n” in the picture indicates the number of experimental data), with statistical significance denoted as *p < 0.05; **p < 0.01; ***p < 0.001; ****p < 0.0001.
Figure 5a
Figure 5a
AGBL2 impacts multiple biological processes and correlates with immune infiltration. (A,B) Plots of GO and KEGG enrichment analyses for genes differing between the two groups. (C,D) Pathway enrichment analysis comparing AGBL2 knockout to control cells; NC denotes negative control.(E) Immune cell infiltration associated with AGBL2 in KIRC, based on TCGA data.(F) Correlation between AGBL2 expression and iDC, Mast cells, Tgd, and T helper cells in renal cancer, based on TCGA data.
Figure 5b
Figure 5b
AGBL2 impacts multiple biological processes and correlates with immune infiltration. (G) Analysis of AGBL2 expression correlation with two immunosuppressive factors (CD160 and CTLA4) and two immune cells (iDC and Monocyte), using TISIDB data.(H) Alterations in AGBL2 expression related to the infiltration of immune subpopulations, date from the TISIDB.(I) Kaplan-Meier profile of AGBL2 gene expression in KIRC, categorized by different levels of immune cell infiltration, date from TIMER2.0.
Fig. 6
Fig. 6
AGBL2 promotes AKT phosphorylation. (A–E) Pathway enrichment analysis comparing AGBL2 knockout with control cells; NC denotes negative control.(F) Western blot analysis of AGBL2, p-AKT, AKT and GAPDH in 786-O cells infected with lentiviral solution (pLenti-CMV-AGBL2-GFP-Puro or vector) and treated with DMSO (negative control) or 5 μmol/L parthenolide. Data (n = 3)were analyzed, with statistical significance denoted as *p < 0.05; **p < 0.01; ***p < 0.001; ****p < 0.0001.

Similar articles

References

    1. Hsieh J.J., Purdue M.P., Signoretti S., et al. Renal cell carcinoma. Nat Rev Dis Primers. 2017;3 doi: 10.1038/nrdp.2017.9. Published 2017 Mar 9. - DOI - PMC - PubMed
    1. Sung H., Ferlay J., Siegel R.L., et al. Global cancer statistics 2020: GLOBOCAN estimates of incidence and mortality worldwide for 36 cancers in 185 countries. CA Cancer J Clin. 2021;71(3):209–249. doi: 10.3322/caac.21660. - DOI - PubMed
    1. Siegel R.L., Miller K.D., Jemal A. Cancer statistics, 2017. CA Cancer J Clin. 2017;67(1):7–30. doi: 10.3322/caac.21387. - DOI - PubMed
    1. Nogales E. Structural insight into microtubule function. Annu. Rev. Biophys. Biomol. Struct. 2001;30:397–420. doi: 10.1146/annurev.biophys.30.1.397. - DOI - PubMed
    1. Valiron O., Caudron N., Job D. Microtubule dynamics. Cell. Mol. Life Sci. 2001;58(14):2069–2084. doi: 10.1007/PL00000837. - DOI - PMC - PubMed

LinkOut - more resources