[Preprint]. 2024 Sep 12:rs.3.rs-5065904.
doi: 10.21203/rs.3.rs-5065904/v1.

BMP receptor 2 inhibition regulates mitochondrial bioenergetics to induce synergistic cell death with BCL-2 inhibitors in leukemia and NSLC cells

Affiliations

BMP receptor 2 inhibition regulates mitochondrial bioenergetics to induce synergistic cell death with BCL-2 inhibitors in leukemia and NSLC cells

Ashley Toussaint et al. Res Sq. .

Abstract

Background: Bone morphogenetic protein (BMP) signaling cascade is a phylogenetically conserved stem cell regulator that is aberrantly expressed in non-small cell lung cancer (NSLC) and leukemias. BMP signaling negatively regulates mitochondrial bioenergetics in lung cancer cells. The impact of inhibiting BMP signaling on mitochondrial bioenergetics and the effect this has on the survival of NSLC and leukemia cells are not known.

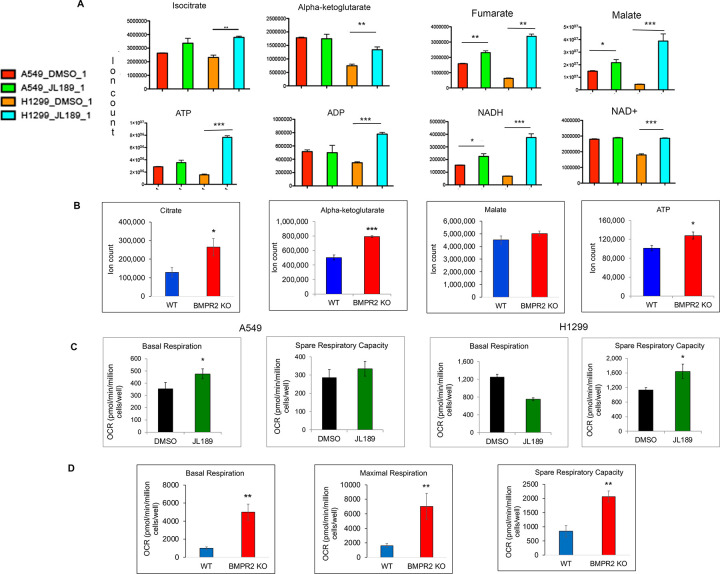
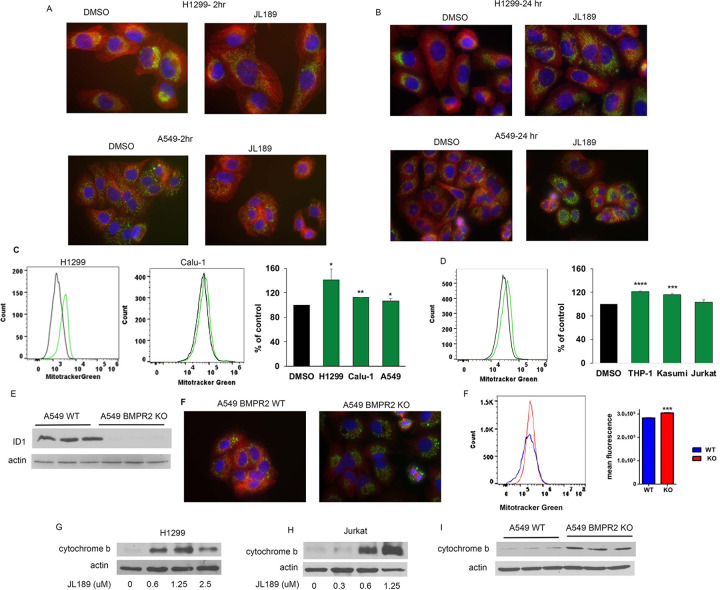
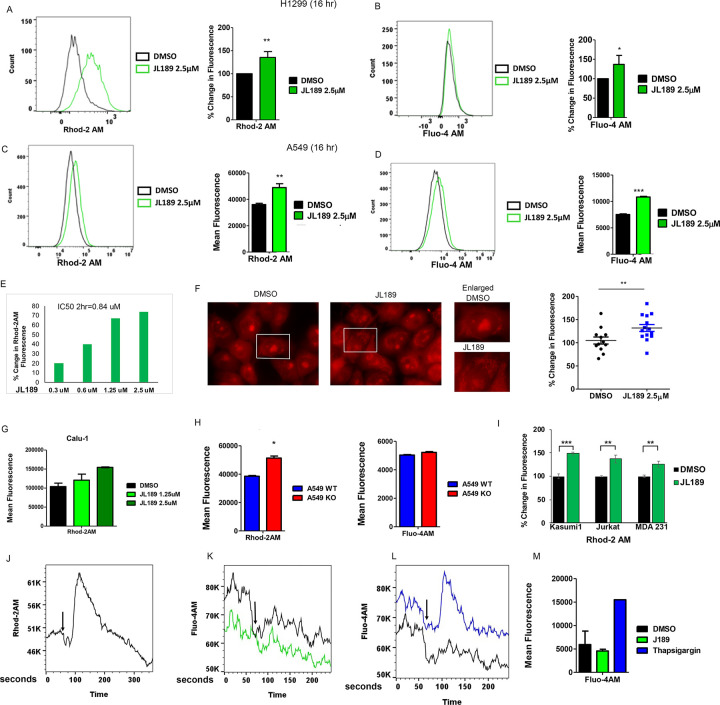
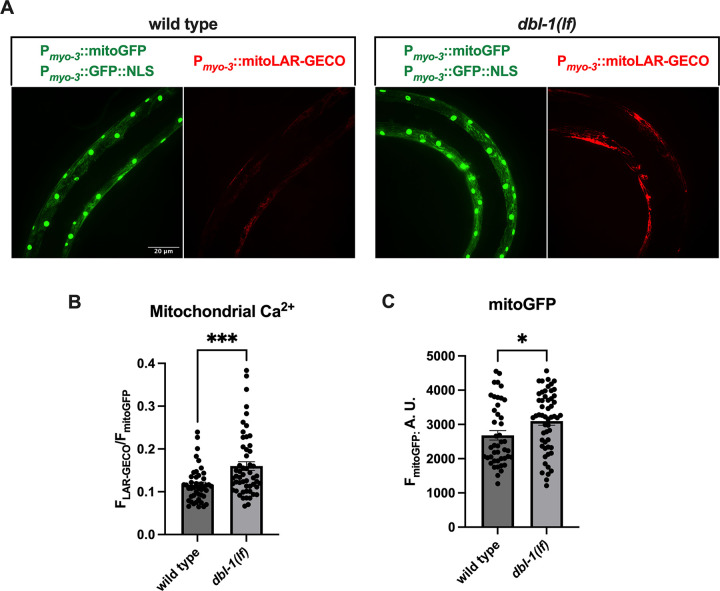
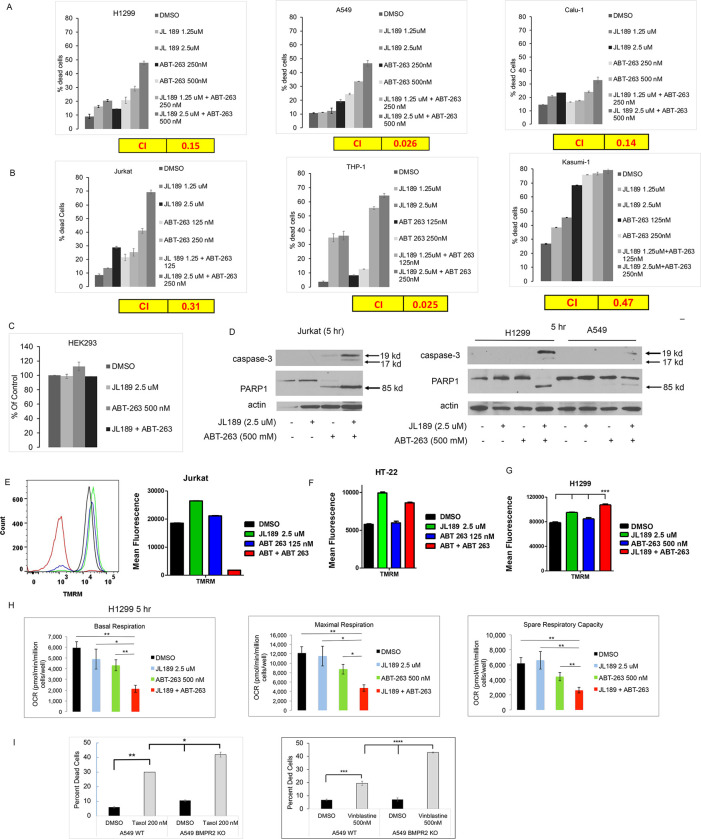
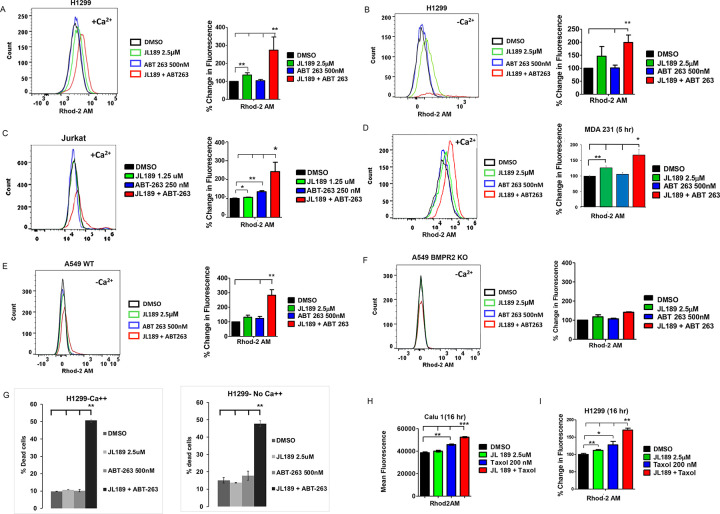
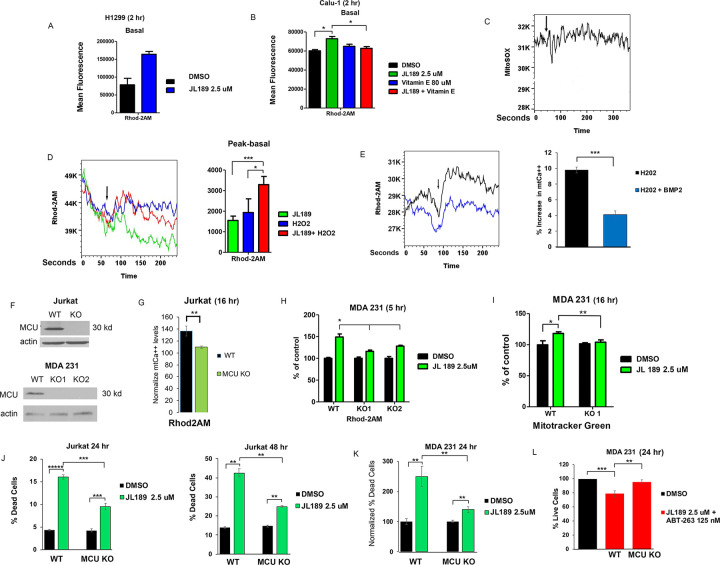
Methods: Utilizing the BMP type 2 receptor (BMPR2) JL189, BMPR2 knockout (KO) in cancer cells, and BMP loss of function mutants in C elegans, we determined the effects of BMPR2 inhibition (BMPR2i) on TCA cycle metabolic intermediates, mitochondrial respiration, and the regulation of mitochondrial superoxide anion (SOA) and Ca++ levels. We also examined whether BMPR2i altered the threshold cancer therapeutics induce cell death in NSLC and leukemia cell lines. KO of the mitochondria uniporter (MCU) was used to determine the mechanism BMPR2i regulates the uptake of Ca++ into the mitochondria, mitochondrial bioenergetics, and cell death.

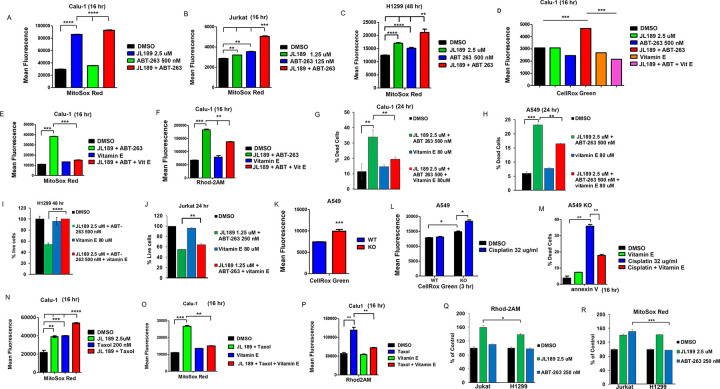
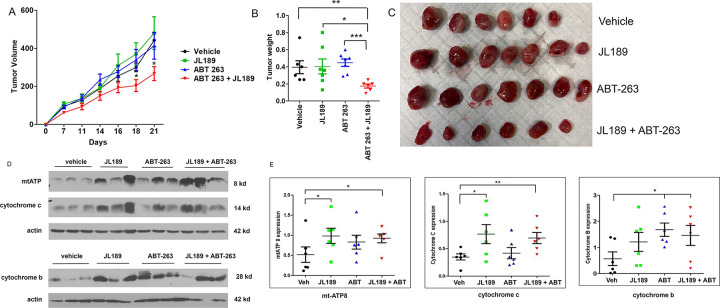
Results: BMPR2i increases mtCa++ levels and enhances mitochondrial bioenergetics in both NSLC and leukemia cell lines that is conserved in C elegans. BMPR2i induced increase in mtCa++ levels is regulated through the MCU, effecting mitochondria mass and cell survival. BMPR2i synergistically induced cell death when combined with BCL-2 inhibitors or microtubule targeting agents in both NSLC and leukemia cells. Cell death is caused by synergistic increase in mitochondrial ROS and Ca++ levels. BMPR2i enhances Ca++ uptake into the mitochondria induced by reactive oxygen species (ROS) produced by cancer therapeutics. Both acute myeloid leukemia (AML) and T-cell lymphoblastic leukemia cells lines were more responsive to the JL189 alone and when combined with venetoclax or navitoclax compared to NSLC.

Keywords: BMP inhibitor; cancer; cell death; free radicals; mitochondrial calcium.


Conflict of interest statement

Competing interests A provisionary patent application has been submitted for the development of BMPR2 inhibitors. There is no active or pending financial agreement regarding these compounds.

Figures

Figure 1
Figure 1. BMPR2i increases TCA cycle intermediates and mitochondrial respiration.
(A) A549 and H1299 lung cancer cell lines were treated with JL189 2.5 mM for 24 hr and then examined for (A) metabolomics done by liquid chromatography-mass spectrometry (LC-MS), (B)Metabolomics were performed comparing TCA cycle intermediates of A549 WT and A549 BMPR2 KO cells (C) Mitochondrial respiration was determined by an Agilent Seahorse analyzer on A549 and H1299 cells treated with JL189 2.5 mM for 24 hr. (D) Comparison of mitochondrial respiration between A549WT and A549 BMPR2 KO cells. The studies were performed 3–4 times
Figure 2
Figure 2. BMPR2i increases mitochondrial mass.
(A-B) Co-immunofluorescent imaging of a-tubulin (red) and TFAM1 (green) with nucleus stained with DAPI (blue) of H1299 and A549 cells treated with JL189 2.5 mM for 2 and 24 hr. Cell treated with JL189 exhibited trafficking of the mitochondria with greater TFAM1 fluorescence after 24 hr. (C)MitoTracker Green fluorescence was analyzed by flow cytometry after 24 hr of treatment with JL189 2.5 mM or DMSO control. The graph represents the mean of 4 studies presented as the percentage of control. (D) Coimmunofluorescent imaging of a-tubulin (red) and TFAM1 (green) in A549 WT and KO cells. (E) MitoTracker Green analysis demonstrate that A549 BMPR2 KO cells have significantly greater fluorescence compared to A549 WT cells. The graph shows mean fluorescence of 4 studies. (F)Western blot analysis of total protein lysate from A549 WT and A549 BMPR2 KO cells demonstrating an increase in cytochrome b.
Figure 3
Figure 3. BMPR2i in lung cancer cells increases mtCa++ levels.
(A-B) H1299 and (C-D) A549 cells treatment with DMSO or JL189 for 16 hr then loaded with Rhod-2AM (mitochondria Ca++) or Fluoro-4AM (cytosol Ca++) and DAPI then examined by flow cytometry. The data represents the mean % change in fluorescence or mean fluorescence of 4 experiments. (E) The IC50 of JL189 to increase Rhod2-AM fluorescence by 50% in H1299 cells treated for 2 hr. (F) Immunofluorescence imaging of H1299 cells loaded with Rhod2AM and then treated with JL189 2.5 mM for 2 hr. Increased fluorescence is noted in the perinuclear organelles (mitochondria) in cells treated with JL189. The Fluorescence in more that 100 cells was quantified by image J and is reported as the percent increase from baseline. (G) Rhod2AM fluorescence of Calu1 cells treated with JL189 for 2 hr. (H) Mean Rhod2-AM and Fluoro-4AM fluorescence of 3–4 studies of A549 WT and A549 BMPR2 cells. (I) Percent increase in Rhod2AM fluorescence of cells treated with JL189. Kasusmi1 and Jurkat cells treated with JL189 1.25 mM for 16 hr. MDA 231 treated with JL189 2.5 mM for 5 hr. Graph represents the mean of 3–4 studies (J) Representative flow cytometry analysis (n=5) of Calu-1 cells loaded with Rhod2AM then treated with JL189 2.5 mM without calcium for 5 minutes. (K-M) Calu1 cells loaded with Fluo-4AM were treated with (K,M) JL189 2.5 mM or (L,M) Thapsigargin 300 nM without calcium and analyzed by flow cytometry for 3 minutes. (M) The graph shows the mean Fluo-4AM fluorescence of 2 studies. Arrows mark the time of treatment.
Figure 4.
Figure 4.. BMP inhibition in C elegans increases mtCa++ and mitochondrial mass.
WT and dbl-1(BMP ligand) lof mutant worms were crossed to generate transgenes expressing the mtCa++ sensor LAR-GECO (red) and mitoGFP (green) under the control of the myo-3 promoter. MitoGFP localizes to the nucleus and mitochondria in muscle and was used to normalize mtCa++ levels and determine mitochondrial mass. The fluorescence intensity was determined by confocal microscopy. A total of six independent trials with a n = ~50 worms were performed to determine the mtCa++ levels and mitochondrial mass. (A-B) The mean fluorescence intensities of LAR-GECO and (A,C) MitoGFP were significantly greater in dbl-1(BMP ligand) lof mutants than in WT.
Figure 5
Figure 5. BMPR2i synergizes with ABT-263 and microtubule-targeting chemotherapeutic agents to induce mitochondrial cell death.
(A) NSLC and (B) leukemia cells were treated with JL189 and ABT-263 alone or in combination with ABT-263 for 48 hours. The percentage of dead cells was determined with trypan blue staining using the Vi-CELL BLU cell viability analyzer. The combination index (CI) < 1.0 indicates synergy which is highlighted in yellow. (C) Cell counts of treated HEK 293 cells. Studies are representative experiments done in duplicate (D) Western blot analysis of cells treated for 5 hr demonstrating the expression of activated caspase-3 and cleaved PARP1 in the combination group. (E)Jurkat cells were treated for 2 hr and the mitochondrial membrane potential (MMP) was determined after loading the cells with TMRM and then analyzed by flow cytometry. (F) TMRM fluorescence of HT-22 cells treated for 5 hr. Graphs represent the mean of 2 studies. (G) TMRM fluorescence of H1299 cells treated for 24 hr. Graphs represent the mean of 3 studies. (H)Mitochondrial respiration was determined by an Agilent Seahorse analyzer of cells treated for 5 hr. The data represents the mean of 3 studies. (I) Cell counts of A549 WT and A549 KO cells treated with Taxol (mean of 3 studies) or vinblastine (mean of 4 studies) for 48 hr.
Figure 6
Figure 6. BMPR2i combined with ABT-263, or Taxol synergistically increases mtCa++ levels.
(A-F, H, I) Cells were treated then loaded with Rhod2AM and DAPI and live cells were examined by flow cytometry. (A,B,C,D,H,I) Graphs represent the percent change of 4 studies. (E-F) Graphs represent the percent change of 2 studies. (A-C, E-F, H-I) Cells were treated for 16 hr, except (D) which was treated for 5 hr. The cell culture media contained Ca++ except for (B, E-F) which did not contain Ca++ in the cell culture media. (G) H1299 cells were treated for 24 hr in cell culture media with or without Ca++. The data represents the mean percentage of dead cell of 2 studies.
Figure 7
Figure 7. BMPR2i combined with ABT-263 or Taxol synergistically increase mtROS, which regulates mtCa++ levels and cell death.
(A-C) Cells were treated with JL189 and ABT-263 alone or in combination then loaded with MitoSox Red or CellRox Green then analysed by flow cytometry. Cells were treated with JL189 2.5 mM combined with ABT-263 500 nM with and without Vitamin E 80 mM. Cells were then loaded with (D) CellRox Green, (E) MitoSox Red, or (F) Rhod2AM and examined by flow cytometry. Graphs represent the mean of 3–4 studies. (G-J) Cells were treated with JL189 + ABT-263 with and without vitamin E 80 mM. The number of dead and live cells determined using Vi-CELL BLU cell viability analyzer. The graphs show the mean of 4 studies reported as the % dead or % live cells. (K) Total total O2· - levels of untreated A549 WT and A549 BMPR2 KO cells are represented as the mean of fluorescence of 4 studies. (L) A549 WT and A549 BMPR2 KO cells were treated with cisplatin for 3 hr and then loaded with CellRox Green. (M) A549 BMPR2 KO cells were treated with cisplatin with or without 80 mM vitamin E then stained with annexin V-stained and apoptotic cells examined by flow cytometry. (L-M) Represent the mean of 2 studies. (N-P) Calu-1 cells were treated with JL189 2.5 mM and Taxol 200 nM with or without Vitamin E 80 mM for 16 hr and then loaded with (N-O) MitoSox Red or (P) Rhod2AM and DAPI. (Q-R) Jurkat and H1299 were treated with JL189 or ABT-263 for 2h hr then loaded with (Q) Rhod2AM or (R) MitoSox Red. (N-O) The results are represented as the mean fluorescence and (Q-R) the % of control of 3 flow cytometry studies.
Figure 8
Figure 8. BMPR2 signaling regulates redox sensing of the MCU.
(A-B) BMPR2i with JL189 increases basal mtCa++ levels that is inhibited with vitamin E. The graphs show the mean Rhod2AM fluorescence of 4 studies cells treated for 2 hr. (C) Representative study of Calu-1 cells loaded with MitSox Red then treated with JL189 2.5 mM and analyzed by flow cytometry for 3 minutes. (D) Calu-1 cells loaded with Rhod-2AM in Ca++ free media, were treated with JL189 2.5 mM, hydrogen peroxide (H2O2), or the combination of JL189 and H2O2 and then analyzed by flow cytometry for 3 minutes. Arrows mark the time of treatment. The graph represents the mean of the peak minus the basal values of 4 experiments. (E) Calu1 cells loaded with Rhod-2AM were treated with H2O2 500 mM or H202 500 mM pretreated with BMP2 ligand 20 ng/ml for 45 minutes and then analyzed by flow cytometry for 3 minutes. The graph represents the mean percent increase from the basal to peak values of 3 experiments. Studies suggest that BMPR2 signaling inhibits ROS- induced uptake of calcium into the mitochondria. (F) Western blot analysis of Jurkat and MDA 231 WT and MCU KO cells. (G-H) Jurkat and MD1 231 WT and MCU KO cells were treated with JL189 2.5 mM or vehicle for 16 or 5 hr. (G) The data represents the mean fluorescence intensity of Rhod2AM+/DAPI- cells of 4 studies normalized to control. (H) Data represent the mean Rhod2AM fluorescence intensity of 2 studies presented as percent change from control. (I) MDA 231 WT and MCU KO cells were treated with JL189 for 16 hr then loaded with MitoTracker Green and analyzed by flow cytometry. The graph shows with mean fluorescence of 6 studies presented as the percent change from control. (J-K) Cell counts of (J) Jurkat and (K) MDA-231 WT and MCU KO cells treated with (J) JL189 for 24 and 48 hr. The graph represents the mean percentage of dead cells of at least 4 studies. (K) Cells were treated for 16–24 hr and % increase in dead cell normalized to control. Data represents the mean of 5 studies. (L) Cell counts of MDA 231 WT and MCU KO cells treated with JL189 combined with ABT-263 for 24 hr. The data are presented as the mean percentage of live cells in 4 studies normalized to the control.
Figure 9
Figure 9. JL189 enhances mitochondrial bioenergetics and synergistically decreases the growth of tumor xenografts when combined with ABT-263.
(A) H1299 cells (2 million) were injected subcutaneously into the flanks of Balbc nude mice. After 12 days, the mice were then treated with vehicle, JL189 30 mg/kg twice daily intraperitoneally (IP), ABT-263 (Navitoclax) 12 mg/kg IP once daily, alone or in combination for 3 weeks. There were 6 mice per group. (A) Tumor volume was measured twice weekly (L x W). (B) Tumor weights were determined on day 23. (C) Photograph of the tumors. (D) Western blot analysis of tumors treated with control, JL189, ABT-263, or JL189 + ABT-263 for 3 weeks. (E) Expression was normalized to that of actin of the 6 tumors in each group.

References

    1. Voeltzel T, Flores-Violante M, Zylbersztejn F, Lefort S, Billandon M, Jeanpierre S, Joly S, Fossard G, Milenkov M, Mazurier F et al. (2018) A new signaling cascade linking BMP4, BMPR1A, ΔNp73 and NANOG impacts on stem-like human cell properties and patient outcome. Cell Death Dis 9:1011. - PMC - PubMed
    1. Langenfeld EM, Bojnowski J, Perone J, Langenfeld J (2005) Expression of bone morphogenetic proteins in human lung carcinomas. Ann Thorac Surg 80:1028–1032 - PubMed
    1. Nickel J, Sebald W, Groppe JC, Mueller TD (2009) Intricacies of BMP receptor assembly. Cytokine Growth Factor Rev 20:367–377 - PubMed
    1. Jiao G, Guo W, Ren T, Lu Q, Sun Y, Liang W, Ren C, Yang K, Sun K (2014) BMPR2 inhibition induced apoptosis and autophagy via destabilization of XIAP in human chondrosarcoma cells. Cell Death Dis 5:e1571. - PMC - PubMed
    1. Katagiri T, Imada M, Yanai T, Suda T, Takahashi N, Kamijo R (2002) Identification of a BMP-responsive element in Id1, the gene for inhibition of myogenesis. Genes Cells 7:949–960 - PubMed

Publication types

LinkOut - more resources