[Preprint]. 2024 Sep 16:rs.3.rs-4875322.
doi: 10.21203/rs.3.rs-4875322/v2.

Cytochrome c oxidase dependent respiration is essential for T cell activation, proliferation and memory formation

Affiliations

Cytochrome c oxidase dependent respiration is essential for T cell activation, proliferation and memory formation

Tatiana N Tarasenko et al. Res Sq. .

Abstract

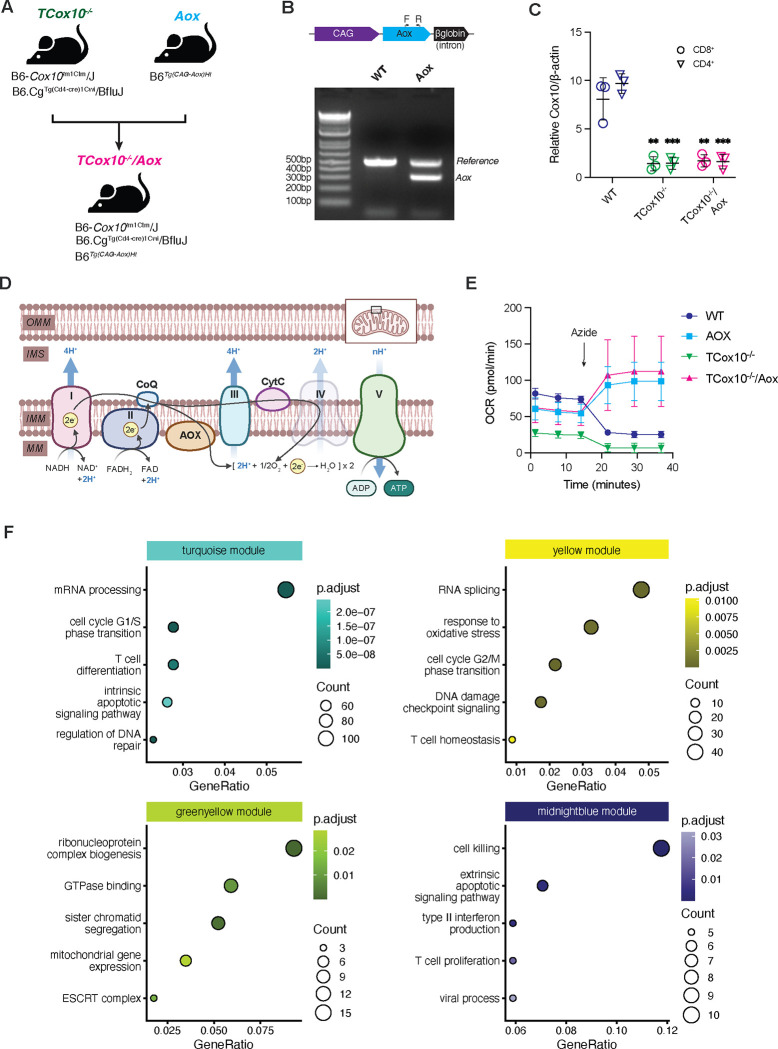
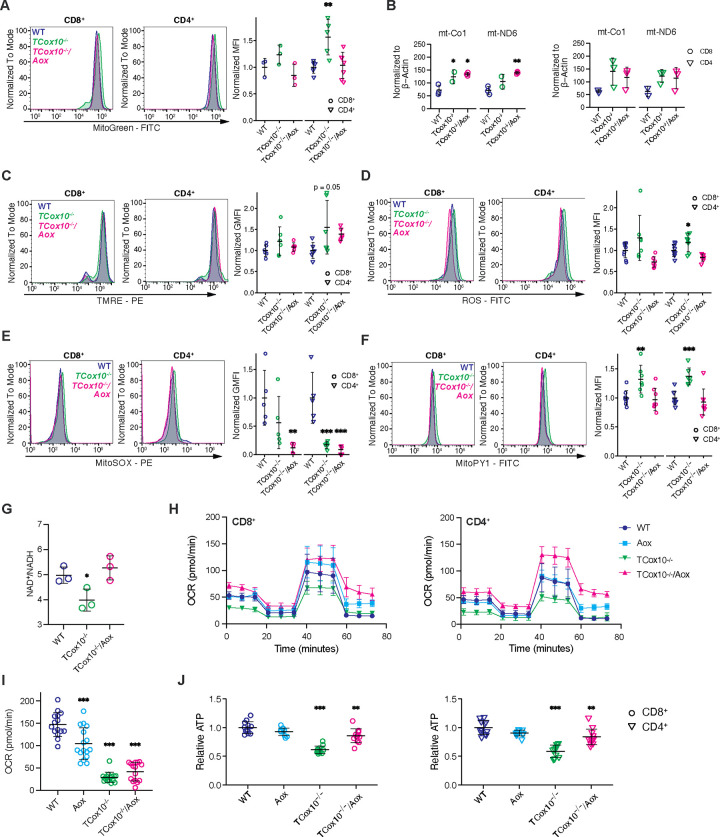
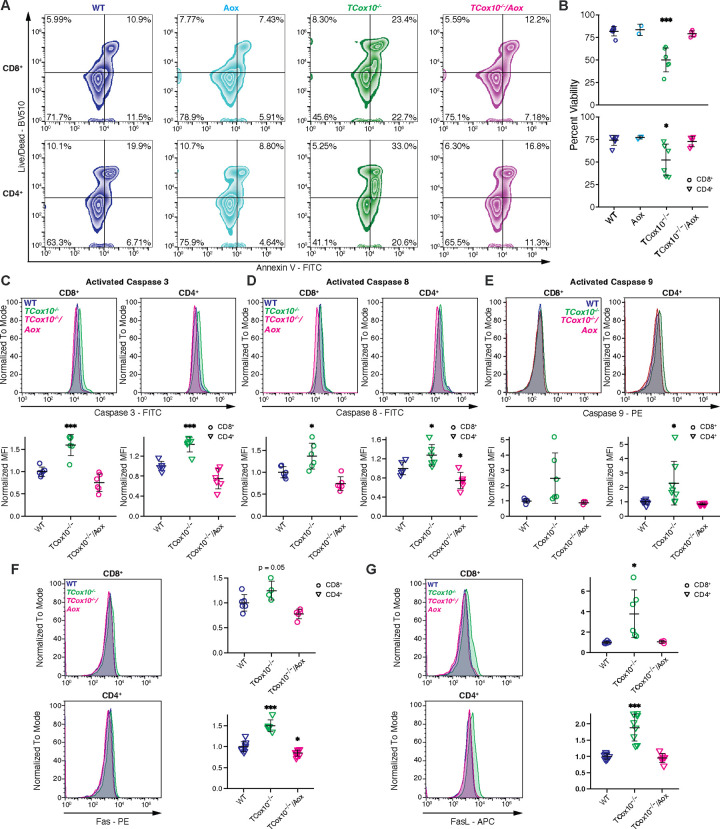
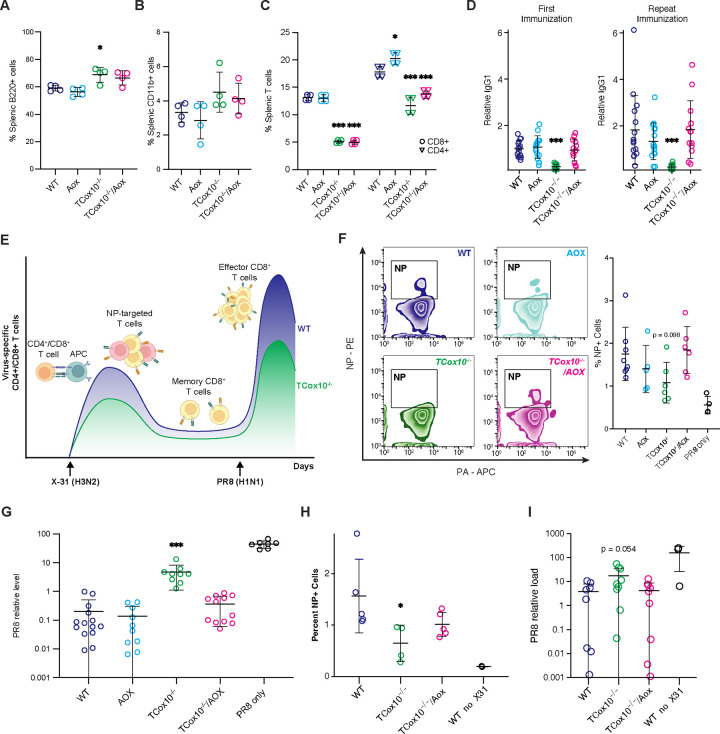
T cell activation, proliferation, and differentiation are fundamentally driven by shifts in cellular metabolism, with mitochondria playing a central role. Cytochrome c oxidase (COX, complex IV) is a key player in this process, as its activity is crucial for apoptosis, mtDNA maintenance, mitochondrial transcription, and mitochondrial respiration (MR), all of which influence T cell fate and function. Despite its known roles, the specific functions of COX required for T cell activity in vivo remain unclear. To isolate the role of MR in T cell function, we reintroduced this capability in COX-deficient T cells using an alternative oxidase (AOX) from Ciona intestinalis. Our findings demonstrate that MR is vital for maintaining metabolic balance during T cell activation by alleviating electron pressure from metabolic reprogramming and preserving redox homeostasis. We further showed that AOX mitigates apoptosis, prevents metabolic disruptions in glycolysis and the tricarboxylic acid cycle, and improves mtDNA maintenance and transcription, indicating that these disturbances are secondary to impaired MR in the absence of COX. Most importantly, the introduction of AOX restored robust effector and memory T cell generation and function in COX-deficient cells. These results highlight the essential role of COX-dependent MR in ensuring cellular health and underscore its pivotal role in T cell proliferation and differentiation.


Conflict of interest statement

Competing interests: MSZ is a co-founder of a start-up company founded to develop therapeutics based on AOX. Additional Declarations: There is NO Competing Interest.

Figures

Fig 1.
Fig 1.. Alternative oxidase acts as a respiratory chain electron acceptor.
(A) Schematic of mouse breeding scheme to generate TCox10−/−/Aox mice. In brief, mice with CD4-Cre driven knockout of Cox10 (TCox10−/− mice) were crossed with mice with systemic AOX expression to generate TCox10−/−/Aox mice. (B) Schematic of Aox transgene (top) and PCR confirmation of successful expression of Aox. (C) qPCR quantification of Cox10 expression in both TCox10−/− and TCox10−/−/AOX mice. (D) Schematic of mitochondrial respiratory chain with exogenous expression of alternative oxidase (AOX). In the absence of complex IV activity (in TCox10−/− mice), AOX accepts electrons passed from complexes I and II to generate water and maintain proton motive force for ATP production. OMM; outer mitochondrial membrane, IMS; inner membrane space, IMM; inner mitochondrial membrane, MM; mitochondrial matrix. (E) Extracellular flux analysis of oxygen consumption rate (OCR) in T cells following treatment with 0.25mM sodium azide. (F) Overrepresentation analysis of four WGCNA modules. Selected enriched pathways are shown for each module. Point color reflects B-H adjusted p value, size reflects enriched genes in the set. Data are representative of one to three independent experiments and indicate mean and standard deviation. (C,E-F) n = 3–5 mice. * p < 0.05, ** p < 0.01, *** p < 0.001 by one-way ANOVA and post-hoc Dunnett test against WT. Specific p values (left to right) are as follows. (C) CD8+, F(2,6) = 22.6, p = 0.0016, Dunnett p = 0.0018, p = 0.0023; CD4+, F(2,6) = 99.59, p < 0.0001, Dunnett p < 0.0001, < 0.0001
Fig 2.
Fig 2.. AOX restores mitochondrial function.
(A) MitoGreen fluorescence in CD8+ and CD4+ T cells. Left, representative density plot; right, quantification of normalized mean fluorescence intensity (MFI). (B) qPCR quantification of mtDNA copy number. Left, CD8+, right, CD4+. (C) TMRE fluorescence in CD8+ and CD4+ T cells. Left, representative density plot; right, quantification of normalized geometric MFI. (D) ROS fluorescence in CD8+ and CD4+ T cells. Left, representative density plot; right, quantification of normalized MFI. (E) ROS fluorescence in CD8+ and CD4+ T cells. Left, representative density plot; right, quantification of normalized geometric MFI. (F) MitoPY1 fluorescence in CD8+ and CD4+ T cells. Left, representative density plot; right, quantification of normalized MFI. (G) NAD+/NADH ratio in T cells. (H) MitoStress Test measuring respiratory chain activity of CD8+ (left) and CD4+ (right) T cells. (I) Complex IV activity determined by oxygen consumption rate (OCR) following the addition of TMPD. (J) Relative ATP levels in CD8+ (left) and CD4+ (right) T cells. Data are representative of 1–3 experiments and indicate mean and standard deviation. (A-F) n = 2–9 mice. (G-J) n = 2–4 mice. * p < 0.05, ** p < 0.01, *** p < 0.001 by one-way ANOVA and post-hoc Dunnett test against WT. Specific p values (left to right) are as follows. (A) CD4+, F(2,15) = 9.249, p = 0.00242, Dunnett p = 0.0029, (B) CD8+, Co1, F(2,5) = 10.1, p = 0.018, Dunnett p = 0.048, 0.0142, Nd6, F(2,5) = 12.93, p = 0.011, Dunnett p = 0.007. (C) CD4+, F(2,15) = 3.12, p = 0.074, Dunnett p = 0.051. (D) CD4+, F(2,21) = 10.29, p = 7.7×10⁻⁴, Dunnett p = 0.045. (E) CD8+, F(2,12) = 6.41, p = 0.013, Dunnett p = 0.007; CD4+, F(2,12) = 18.23, p = 2.3×10⁻⁴, Dunnett p = 6.3×10⁻⁴, 2.7×10⁻⁴. (F) CD8+, F(2,21) = 8.17, p = 0.0024, Dunnett p = 0.0047; CD4+, F(2,21) = 14.69, p = 1.02×10⁻⁴, Dunnett p = 5.4×10⁻⁴. (G) F(2,6) = 7.735, p = 0.022, Dunnett p = 0.048. (I) F(3,58) = 72.85, p < 0.0001, Dunnett p < 0.0001, p < 0.0001, p < 0.0001. (J) CD8, F(3,44) = 39.45, p = 1.55×10⁻¹², Dunnett p = 6.4×10⁻¹³, 1.5×10⁻³; CD4, F(3,44) = 31.61, p = 4.71×10⁻¹¹, Dunnett p = 2.9×10⁻¹², 2.1×10⁻³.
Figure 3.
Figure 3.. AOX normalizes aberrant TCA substrate flux.
(A) Schematic of stable isotope labeling of TCA metabolites from U-13glutamine. Black circles indicate labeled carbons, white circles indicate unlabeled carbons. (B) Quantification of succinate, fumarate, malate, and aspartate (m+4) abundance deriving from glutamine across genotypes. (C) Quantification of m+4 citrate (first TCA turn) and m+2 citrate (second TCA turn) abundance deriving from glutamine across genotypes. (D) 2-NDBG uptake analysis in CD8+ and CD4+ T cells. Left, representative density plots; right, quantification of mean fluorescence intensity (MFI) across genotypes. (E) Schematic of stable isotope labeling of TCA metabolites from U-13glucose. Black circles indicate labeled carbons, white circles indicate unlabeled carbons. (F) Quantification of pyruvate and lactate (m+3) abundance deriving from glucose. (G) Quantification of citrate (m+2) abundance deriving from glucose. (H) Quantification of succinate, fumarate, malate, and aspartate (m+2) abundance deriving from glucose. (I) Quantification of citrate (m+4) abundance deriving from glucose. Data are representative of 1–2 experiments and indicate mean and standard deviation. (B-C) n = 5–7 mice, (D) n = 4 mice, (F-I) n = 5–7 mice. * p < 0.05, ** p < 0.01, *** p < 0.001 by one-way ANOVA and post-hoc Dunnett test against WT. Specific p values (left to right) are as follows. (B) succinate, F(3,20) = 7.96, p = 0.0011, Dunnett p = 0.0007; fumarate, F(3,20) = 7.417, p = 0.0016, Dunnett p = 0.0144; malate, F(3,20) = 9.076, p = 0.0005, Dunnett p = 0.022; aspartate, F(3,20) = 9.753, p = 0.0004, Dunnett p = 0.033, (C) citrate m+4, F(3,20) = 10.77, p = 0.0002, Dunnett p = 0.0277; citrate m+2, F(3,20) = 12.29, p < 0.0001, Dunnett p = 0.0004. (D) CD8+, F(3,12) = 2.36, p = 0.123, Dunnett p = 0.0661; CD4+, F(3,12) = 3.702, p = 0.0428, Dunnett p = 0.0233. (F) pyruvate, F(3,20) = 13.32, p < 0.0001, Dunnett p = 0.0005; lactate F(3,20) = 11.19, p = 0.0002, Dunnett p = 0.0008, (G) F(3,20) = 10.95, p = 0.0002, Dunnett p = 0.0006, (H) succinate, F(3,20) = 10.11, p = 0.0003, Dunnett p = 0.0194; fumarate, F(3,20) = 12.86, p < 0.0001, Dunnett p = 0.0029; malate, F(3,20) = 13.86, p < 0.0001, Dunnett p = 0.0045; aspartate, F(3,20) = 14.86, p < 0.0001, Dunnett p = 0.003, (I) F(3,20) = 15.6, p < 0.0001, Dunnett p = 0.0223.
Figure 4.
Figure 4.. AOX abrogates TCox10−/− proliferation-induced apoptosis.
(A) Representative contour plot of viability analysis in CD8+ and CD4+ T cells using Live/Dead and Annexin V stains. (B) Quantification of viability analysis. (C) Caspase 3 activity in CD8+ and CD4+ T cells. Top, representative density plot; bottom, quantification of normalized mean fluorescence intensity (MFI). (D) Caspase 8 activity in CD8+ and CD4+ T cells. Top, representative density plot; bottom, quantification of normalized MFI. (E) Caspase 9 activity in CD8+ and CD4+ T cells. Top, representative density plot; bottom, quantification of normalized MFI. (F) Fas expression in CD8+ and CD4+ T cells. Left, representative density plot; right, quantification of normalized MFI. (G) FasL expression in CD8+ and CD4+ T cells. Left, representative density plot; right, quantification of normalized MFI. Data are representative of two to three independent experiments and indicate mean and standard deviation. (A-D) n = 2–6 mice, (F-G) n = 3–9 mice. * p < 0.05, ** p < 0.01, *** p < 0.001 by one-way ANOVA and post-hoc Dunnett test against WT. Specific p values (left to right) are as follows. (B) CD8+, F(3,15) = 18.15, p = 2.97×10⁻⁵, Dunnett p = 3.8×10⁻⁵; CD4+, F(3,15) = 5.26, p = 0.011, Dunnett p = 0.0114, (C) CD8+, F(2,15) = 32.25, p = 3.7×10⁻⁶, Dunnett p = 0.00011; CD4+, F(2,15) = 30.62, p = 5.05×10⁻⁶, Dunnett p = 0.0004, 0.0212, (D) CD8+, F(2,15) = 14.1, p = 0.00036, Dunnett p = 0.014; CD4+, F(2,15) = 12.98, p = 0.000534, Dunnett p = 0.034, 0.0484, (E) CD4+, F(2,21) = 6.466, p = 0.00649, Dunnett p = 0.0123, (F) CD8+, F(2,12) = 10.48, p = 0.00233, Dunnett p = 0.0526; CD4+, F(2,21) = 66.97, p = 7.7×10⁻¹⁰, Dunnett p = 4.2×10⁻⁸, p = 0.0149, (G) CD8+, F(2,12) = 6.123, p = 0.0147, Dunnett p = 0.014; CD4+, F(2,21) = 33.1, p = 3.22×10⁻⁷.
Fig 5.
Fig 5.. AOX restores TCox10−/− function in vitro.
(A) Proliferation analysis (Cell Trace Violet) of T cells without and following treatment with 0.25mM sodium azide. (B) Surface expression of T cell activation markers, quantified by mean fluorescence intensity (MFI). (C) Schematic of T cell subtype isolation and differentiation. In brief, splenocytes are isolated from mouse spleen, sorted for naïve T cells (Th0) and activated with subtype-specific factors to differentiate into Th1, Th17, or Tregs. (D) Percentage of cells differentiated into Th1, Th17, or Tregs following activation. (E) Schematic of OT-1 splenocyte differentiation into Teff and Tmem subtypes. (F) Surface expression of Teff and Tmem activation markers between IL-2 or IL-15 differentiated WT and TCox10−/−/Aox T cells. (G) Percent granzyme positive T cells across genotype. (H) Percent dead targets across genotype. (I) Differential expression between IL-15-differentiated WT and TCox10−/−/Aox Tmem cells. Top left, heatmap of significant differentially expressed genes. Top right, normalized expression of Tem and Tcm genes. Bottom left, ORA of significantly upregulated genes in TCox10−/−/Aox Tmem cells. Bottom right, ORA of significantly downregulated genes in TCox10−/−/Aox Tmem cells. Data are representative of at least two independent experiments (with the exception of RNAseq; one experiment) and indicate mean and standard deviation. (A-B), n = 3–8 mice, (D), n = 4–10 mice, (G-I), n = 4–5 mice. * p < 0.05, ** p < 0.01, *** p < 0.001 by one-way ANOVA and post-hoc Dunnett test against WT unless otherwise specified below. Negative controls are not included in statistical calculations. Specific p values (left to right) are as follows. (B), CD8, F(2,13) = 15.4, p = 0.000372, Dunnett p = 0.00018, F(2,13) = 10.08, p = 0.00228, Dunnett p = 0.0017; CD4, F(2,13) = 4.583, p = 0.0312, Dunnett p = 0.0255, F(2,13) = 41.73, p = 2.2×10⁻⁶, Dunnett p = 1.8×10⁻⁶, (D) F(3,36) = 12.04, p < 0.0001, Dunnett p = < 0.0001, F(3,20) = 6.04, p = 0.002, Dunnett p = 0.003 (I) Wald test t stat= −16.37, B-H adjusted p value = 4.31×10−56.
Fig 6.
Fig 6.. Aox restores T cell function in vivo.
(A) Percentage of B220+ B cells isolated from spleen. (B) Percentage of CD11b+ cells isolated from spleen. (C) Percentage of CD8+ or CD4+ T cells isolated from spleen. (D) Relative T cell-dependent antigens (IgG1) detected after first immunization (left) and reimmunization (right). (E) Schematic of deficient development of effector CD8+ T cells (Teff) in TCox10−/− mice following viral antigen rechallenge. Mice are initially exposed to X-31, a mouse-adapted non-lethal H3N2 influenza virus, which stimulates the development of T cells targeted to X-31 peptides, including nucleoprotein (NP). Antigen-specific memory CD8+ T cells (Tmem) persist following the initial infection. Mice are then exposed to PR8, a mouse-adapted lethal H1N1 influenza virus, which shares the NP antigen with X-31. In wildtype mice, this stimulates the generation of abundant NP-targeted Teff cells, but in TCox10−/−mice this response is diminished. (F) Left, contour plot of NP and PA positivity in CD8+ T cells isolated from X31/PR8-exposed mice. Right, quantification of percent NP-positive CD8+ T cells. (G) PR8 relative viral load in X31/PR8-exposed mice. (H-I) Bone marrow transfer experiment wherein bone marrow from CD45.2 mice of indicated genotypes replaces bone marrow from CD45.1 WT mice. (H) PR8 relative viral load following X31/PR8-exposure. (I) Percent NP-positive CD8+ T cells following X31/PR8-exposure. Data are representative of one to four independent experiments and indicate mean and standard deviation. (A-C) n = 4 mice, (D) n = 7–13 mice, (F) n = 5–8 mice, (G) n = 9–14 mice, (H-I) 4–9 mice. * p < 0.05, ** p < 0.01, *** p < 0.001 by one-way ANOVA and post-hoc Dunnett test against WT unless otherwise specified below. Controls are not included in statistical calculations. Specific p values (left to right) are as follows. (A), F(3,12) = 8.318; p = 0.0029, Dunnett p = 0.0160, (C) CD8 F(3,12) = 382.5, p < 0.0001, Dunnett p < 0.0001, p < 0.0001; CD4 (F3,12) = 46.22, p < 0.0001, Dunnett p = 0.0263, p < 0.0001, p = 0.0009, (D) First immunization, F(3,50) = 11.65, p = 6.61×10⁻⁶, Dunnett p = 4.4×10⁻⁵; Repeat immunization, F(3,50) = 5.81, p = 0.002, Dunnett p = 0.0015. (F) F(3,21) = 2.414, p = 0.0952. (G) F(3,41) = 18.75, p = 8.21×10⁻⁸, Dunnett p = 1.3×10⁻⁷, (H) F(2,23) = 3.628, p = 0.0427, (I) F(2,11) = 4.036, p = 0.0485, Dunnett p = 0.032.

References

    1. Peng M. et al. Aerobic glycolysis promotes T helper 1 cell differentiation through an epigenetic mechanism. Science 354, 481–484 (2016). - PMC - PubMed
    1. Wang R.N. et al. The Transcription Factor Myc Controls Metabolic Reprogramming upon T Lymphocyte Activation. Immunity 35, 871–882 (2011). - PMC - PubMed
    1. Sena L.A. et al. Mitochondria Are Required for Antigen-Specific T Cell Activation through Reactive Oxygen Species Signaling. Immunity 38, 225–236 (2013). - PMC - PubMed
    1. Tarasenko T.N. et al. Cytochrome c Oxidase Activity Is a Metabolic Checkpoint that Regulates Cell Fate Decisions During T Cell Activation and Differentiation. Cell Metab 25, 1254–1268 e1257 (2017). - PMC - PubMed
    1. Miranda M., Bonekamp N.A. & Kühl I. Starting the engine of the powerhouse: mitochondrial transcription and beyond. Biological Chemistry 403, 779–805 (2022). - PubMed

Publication types