. 2024 Dec 31;25(1):2398801.
doi: 10.1080/15384047.2024.2398801. Epub 2024 Sep 24.

CD8α Structural Domains Enhance GUCY2C CAR-T Cell Efficacy

Affiliations

CD8α Structural Domains Enhance GUCY2C CAR-T Cell Efficacy

Trevor R Baybutt et al. Cancer Biol Ther. .

Abstract

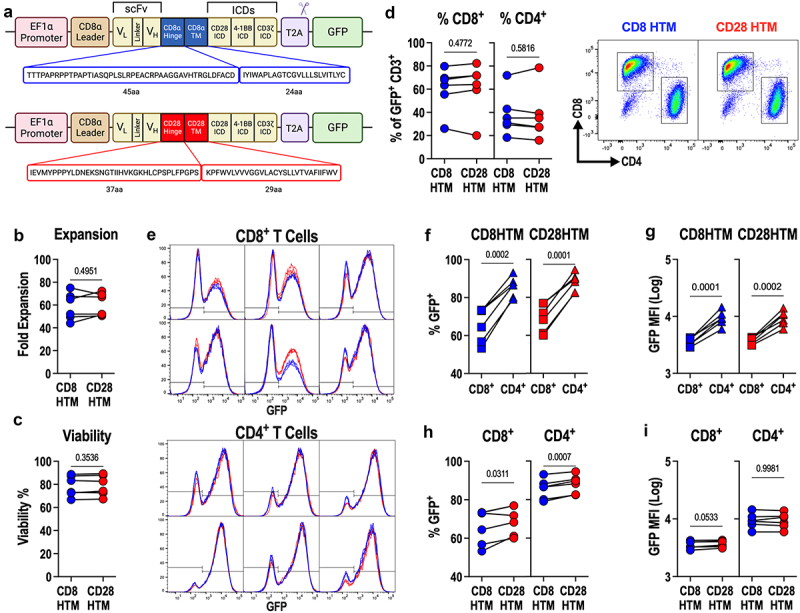
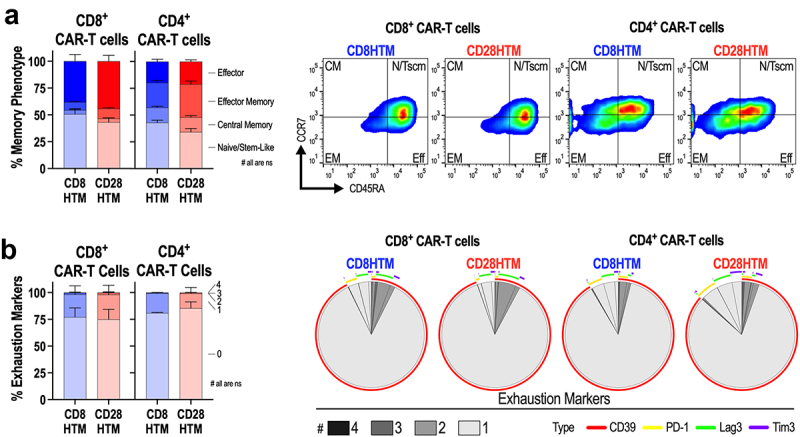
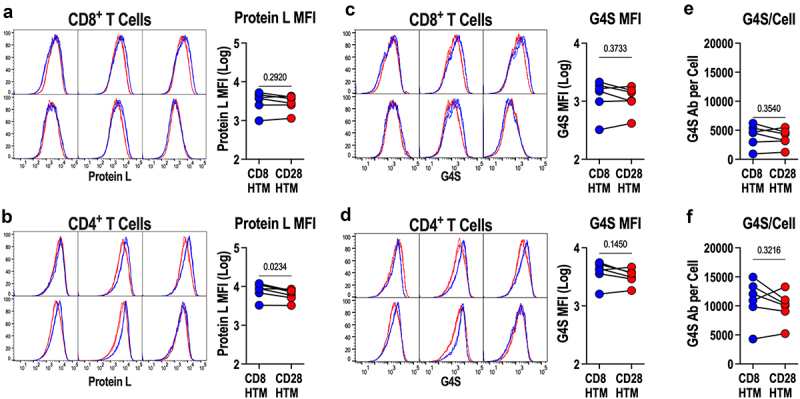
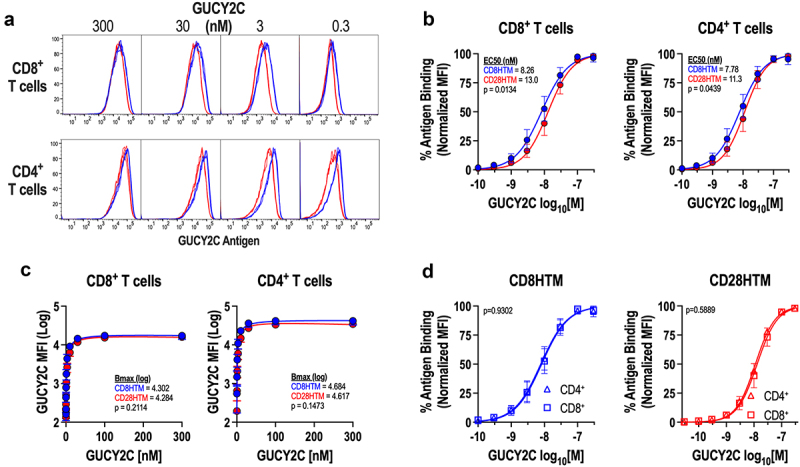
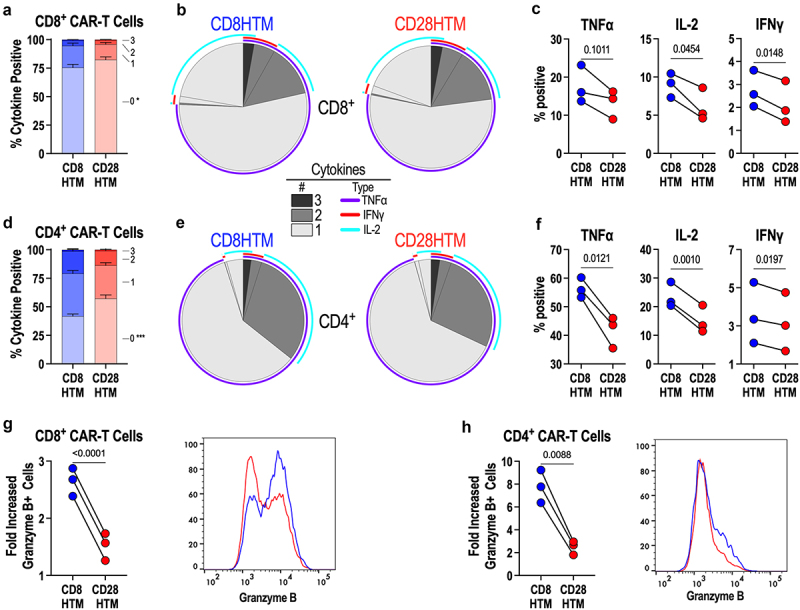
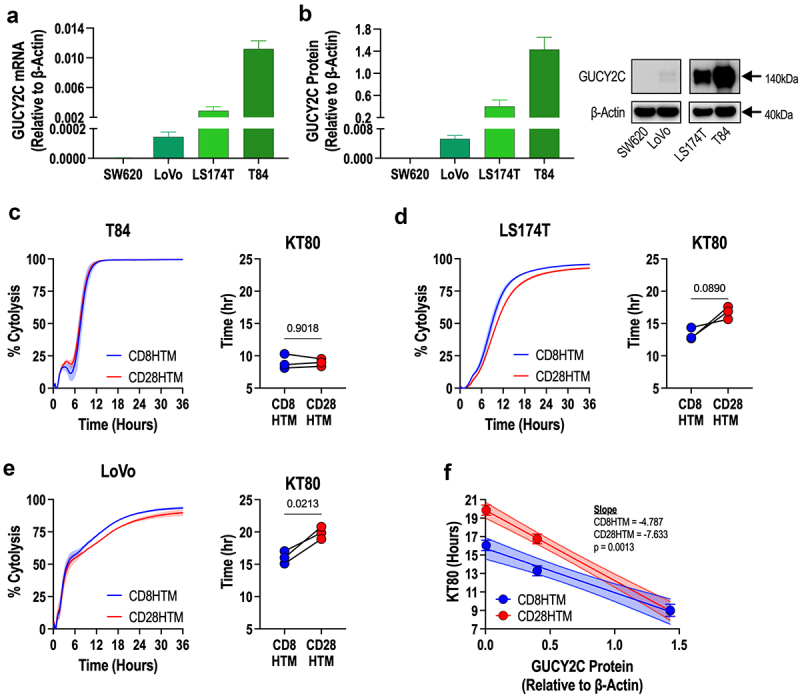
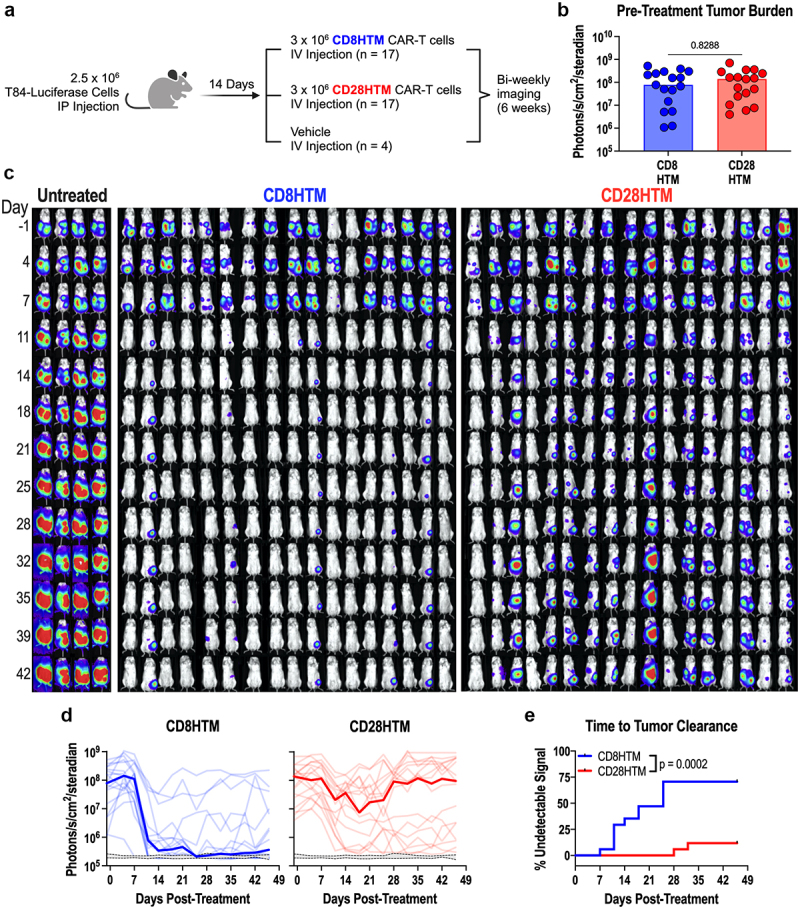
Despite success in treating some hematological malignancies, CAR-T cells have not yet produced similar outcomes in solid tumors due, in part, to the tumor microenvironment, poor persistence, and a paucity of suitable target antigens. Importantly, the impact of the CAR components on these challenges remains focused on the intracellular signaling and antigen-binding domains. In contrast, the flexible hinge and transmembrane domains have been commoditized and are the least studied components of the CAR. Here, we compared the hinge and transmembrane domains derived from either the CD8ɑ or CD28 molecule in identical GUCY2C-targeted third-generation designs for colorectal cancer. While these structural domains do not contribute to differences in antigen-independent contexts, such as CAR expression and differentiation and exhaustion phenotypes, the CD8ɑ structural domain CAR has a greater affinity for GUCY2C. This results in increased production of inflammatory cytokines and granzyme B, improved cytolytic effector function with low antigen-expressing tumor cells, and robust anti-tumor efficacy in vivo compared with the CD28 structural domain CAR. This suggests that CD8α structural domains should be considered in the design of all CARs for the generation of high-affinity CARs and optimally effective CAR-T cells in solid tumor immunotherapy.

Keywords: CAR-T cell therapy; Chimeric antigen receptor; GUCY2C; colorectal cancer.


Conflict of interest statement

T.R. Baybutt reports pending patents related to the submitted work; and CAR-T-related patents licensed to TDT. S.A.W. is a member of the Board of Directors for Targeted Diagnostics & Therapeutics, Inc. which provided research funding that, in part, supported this work and has a license to commercialize inventions related to this work. A.E. Snook reports personal fees from Targeted Diagnostics and Therapeutics (TDT), Inc. and Vittoria Biotherapeutics Inc outside the submitted work; pending patents related to the submitted work; and CAR-T-related patents licensed to TDT.

Figures

Figure 1.
Figure 1.
CD8HTM and CD28HTM GUCY2C CAR-T Production. (a) designs of CD8HTM and CD28HTM CARs. (b-i) CD8HTM and CD28HTM CAR constructs used were from 14-day manufacturing of CAR-T cells from n = 6 donors and matched comparisons between CARs. (b-c) expansion and viability of CD8HTM and CD28HTM CAR-T cell products. (d) CD8+ and CD4+ populations among CAR-transduced T cells. Flow cytometry plots shown. (e) Transduction efficiency (% GFP+) and construct expression (GFP MFI) for all 6 donors. (f-g) comparison of transduction efficiency (f) and construct expression (g) between CD8+ and CD4+ T cells for each CAR. (h-i) comparison of transduction efficiency (h) and construct expression (i) between CD8HTM and CD28HTM CARs for CD8+ and CD4+ T cells. All statistical comparisons are paired T-tests; symbols connected with a line represent a matched donor.
Figure 2.
Figure 2.
CD8HTM and CD28HTM CAR-T products lack exhaustion and possess memory phenotypes. (a) effector, effector memory, central memory, and naïve/stem cell memory-like phenotypes among matched CD8HTM and CD28HTM CAR-T cells produced from n = 3 donors. Representative flow cytometry plots are shown. (b) prevalence of 0 to 4 exhaustion markers expressed among matched CD8HTM and CD28HTM CAR-T cells produced from 3 donors. SPICE plots demonstrating the average number and type of exhaustion marker expression. CD8HTM and CD28HTM memory (a) and exhaustion (b) phenotypes were not statistically different. Statistical analyses used two-way ANOVA adjusted for multiple comparisons. Error bars reflect the standard error of the mean (SEM).
Figure 3.
Figure 3.
CD8HTM and CD28HTM CAR expression. (a-b) surface CD8HTM and CD28HTM CAR expression was examined with protein L among CD8+ (a) and CD4+ (b) CAR-T cells produced from n = 6 donors. (c-d) surface CD8HTM and CD28HTM CAR expression was examined with anti-G4S antibody among CD8+ (c) and CD4+ (d) CAR-T cells produced from 6 donors. (e-f) bound anti-G4S antibodies/cell in c-d were quantified among CD8+ (e) and CD4+ (f) CAR-T cells. Flow cytometry plots in a-d indicate matched CD8HTM and CD28HTM CAR expression for each donor. All statistical comparisons are paired T-tests; symbols connected with a line represent a matched donor.
Figure 4.
Figure 4.
Enhanced CD8HTM CAR affinity compared to CD28HTM CAR. (a-d) purified recombinant GUCY2C extracellular domain was incubated with CD8HTM and CD28HTM CAR-T cells produced from n = 3 donors at varying concentrations (0-300 nM). Bound GUCY2C was detected with a fluorescent secondary antibody and cells were analyzed by flow cytometry. (a) Representative flow cytometry plots comparing CD8HTM and CD28HTM CARs. (b) affinity and EC50 determination for CD8HTM and CD28HTM CARs among CD8+ and CD4+ CAR-T cells. (c) maximum binding (bmax) determination for CD8HTM and CD28HTM CARs among CD8+ and CD4+ CAR-T cells. (d) comparison of CAR affinities between CD8+ and CD4+ T cells for each CAR design. Non-linear regression analysis was performed in b-d with p-value testing for matching curves.
Figure 5.
Figure 5.
Enhanced cytokine production and cytolytic potential by CD8HTM CAR compared to CD28HTM CAR. (a-h) CD8HTM and CD28HTM CAR-T cells produced from n = 3 donors were stimulated with plate-bound recombinant GUCY2C extracellular domain protein, and intracellular cytokines (a-f), and granzyme B (g-h) were quantified by flow cytometry. (a,d) comparison of CD8+ T cells (a) and CD4+ T cells (d) producing 0-3 cytokines between CD8HTM and CD28HTM CARs. * p = .048; *** p = .0005 (b) SPICE plots demonstrating the average number and type of cytokine expression by CD8HTM and CD28HTM CAR-T cells among CD8+ (b) and CD4+ (e) CAR-T cells. Individual cytokine expression comparison between CD8HTM and CD28HTM CAR-T cells among CD8+ (c) and CD4+ (f) CAR-T cells. Granzyme B comparison between CD8HTM and CD28HTM CAR-T cells among CD8+ (g) and CD4+ (h) CAR-T cells. Representative flow cytometry plots are shown. Statistical analyses for a and d were performed using two-way ANOVA adjusted for multiple comparisons. Error bars reflect the SEM. Statistical comparisons for c, f, g, and h are paired T-tests; symbols connected with a line represent a matched donor.
Figure 6.
Figure 6.
Enhanced cytolysis at decreasing antigen densities by CD8HTM CAR compared to CD28HTM CAR. (a-b) GUCY2C mRNA (a) and protein (b) were quantified for colorectal cancer cells spanning from undetectable to high expression. (c-e) cytolysis kinetics and time-to-80%-killing (KT80) comparisons between CD8HTM and CD28HTM CARs from n = 3 donors using T84 (c), LS174T (d), and LoVo (e) cells. (f) Correlation of KT80 and GUCY2C protein levels from n = 3 donor CAR-T cells. Shaded regions surrounding the cytotoxicity curves (c,d,e) represent the SEM. Statistical comparisons for the KT80 graphs (c,d,e) are paired T-tests; symbols connected with a line represent a matched donor. Error bars in (f) represent the SEM; the 95% confidence interval is represented by the shaded region.
Figure 7.
Figure 7.
Enhanced antitumor efficacy of CD8HTM CAR compared to CD28HTM CAR. (a) experimental design (created with BioRender.com/w13b661). (b) Tumor burden comparison between CD8HTM and CD28HTM groups one day before treatment. (c) Longitudinal bioluminescence images. (d) Median (bold) and individual tumor burden comparison between CD8HTM and CD28HTM CAR-T cells. Grey range with dashed lines indicates the 95% confidence interval of baseline daily luminescence in tumor-free mice. (e) Time to tumor clearance comparison between CD8HTM and CD28HTM CAR-T cells determined by the day an animal’s signal reached that of tumor-free mice in d. An unpaired T-test was performed in b. Each dot represents a single animal. A Kaplan-Meier curve was used in e with the Log-rank (Mantel-Cox) test to determine the p-value.

Similar articles

Cited by

References

    1. Albelda SM. CAR T cell therapy for patients with solid tumours: key lessons to learn and unlearn. Nat Rev Clin Oncol. 2024. Jan;21(1):47–16. doi:10.1038/s41571-023-00832-4. - DOI - PubMed
    1. Baybutt TR, Flickinger JC, Caparosa EM, Snook AE. Advances in chimeric antigen receptor T-Cell therapies for solid tumors. Clin Pharmacol Ther. 2019. Jan;105(1):71–78. doi:10.1002/cpt.1280. - DOI - PubMed
    1. Quintanilha JCF, Graf RP, Fisher VA, Oxnard GR, Ellis H, Panarelli N, Lin DI, Li G, Huang RSP, Ross JS, et al. Comparative effectiveness of immune checkpoint inhibitors vs chemotherapy in patients with metastatic colorectal cancer with measures of microsatellite instability, mismatch repair, or tumor mutational burden. JAMA Netw Open. 2023. Jan 3;6(1):e2252244. doi:10.1001/jamanetworkopen.2022.52244. - DOI - PMC - PubMed
    1. Tran E, Robbins PF, Lu Y-C, Prickett TD, Gartner JJ, Jia L, Pasetto A, Zheng Z, Ray S, Groh EM, et al. T-Cell transfer therapy targeting mutant KRAS in cancer. N Engl J Med. 2016. Dec 8;375(23):2255–2262. doi:10.1056/NEJMoa1609279. - DOI - PMC - PubMed
    1. Parkhurst M, Goff SL, Lowery FJ, Beyer RK, Halas H, Robbins PF, Prickett TD, Gartner JJ, Sindiri S, Krishna S, et al. Adoptive transfer of personalized neoantigen-reactive tcr-transduced T cells in metastatic colorectal cancer: phase 2 trial interim results. Nat Med. 2024. Jul 11. doi:10.1038/s41591-024-03109-0. - DOI - PubMed

MeSH terms

LinkOut - more resources