. 2024 Sep;532(9):e25670.
doi: 10.1002/cne.25670.

Human Alzheimer's Disease ATN/ABC Staging Applied to Aging Rhesus Macaque Brains: Association With Cognition and MRI-Based Regional Gray Matter Volume

Affiliations

Human Alzheimer's Disease ATN/ABC Staging Applied to Aging Rhesus Macaque Brains: Association With Cognition and MRI-Based Regional Gray Matter Volume

Carol A Barnes et al. J Comp Neurol. 2024 Sep.

Abstract

The brain changes of Alzheimer's disease (AD) include Abeta (Aβ) amyloid plaques ("A"), abnormally phosphorylated tau tangles ("T"), and neurodegeneration ("N"). These have been used to construct in vivo and postmortem diagnostic and staging classifications for evaluating the spectrum of AD in the "ATN" and "ABC" ("B" for Braak tau stage, "C" for Consortium to Establish a Registry for Alzheimer's Disease [CERAD] neuritic plaque density) systems. Another common AD feature involves cerebral amyloid angiopathy (CAA). We report the first experiment to examine relationships among cognition, brain distribution of amyloid plaques, CAA, tau/tangles, and magnetic resonance imaging (MRI)-determined volume changes (as a measure of "N") in the same group of behaviorally characterized nonhuman primates. Both ATN and ABC systems were applied to a group of 32 rhesus macaques aged between 7 and 33 years. When an immunohistochemical method for "T" and "B" was used, some monkeys were "triple positive" on ATN, with a maximum ABC status of A1B2C3. With silver or thioflavin S methods, however, all monkeys were classified as T-negative and B0, indicating the absence of mature neurofibrillary tangles (NFTs) and hence neuropathologically defined AD. Although monkeys at extremes of the ATN and ABC classifications, or with frequent CAA, had significantly lower scores on some cognitive tests, the lack of fully mature NFTs or dementia-consistent cognitive impairment indicates that fully developed AD may not occur in rhesus macaques. There were sex differences noted in the types of histopathology present, and only CAA was significantly related to gray matter volume.

Keywords: RRID:AB_223647; RRID:AB_2564652; aging; amyloid plaques; phosphorylated tau (ptau).


Figures

Figure 1.
Figure 1.
Delayed Response task performance of adult (<22 years, n=14) and aged (>22 years, n=15) rhesus macaques. A) Monkeys were trained with a 1 second delay between observing the baited object and choosing that object in the choice phase of the task. The number of trials it took the monkey to reach a 90% correct performance level over 3 consecutive days was the “learning score” that is shown in A (with one outlier removed from the plot). B) After the learning criterion was met, delays of 5, 10, 15, 30 and 60 seconds were imposed between object presentation and choice. The percent correct responses over each of these delays were calculated for each monkey and then each age group. Using a two-way repeated ANOVA for delay and age, there is a significant effect of delay (F4,108 = 41.71, p <0.0001) but not for age (F1,27 = 0.642, p = 0.430). C) A composite score was calculated for each monkey, as the average of the delays of 30 and 60 seconds. Shown in A and C is the mean, and the quartiles of the performance values. None of these measures were found to differ statistically between the adult and aged monkeys in this cohort of animals.
Figure 2.
Figure 2.
Delayed nonmatching-to-sample (DNMS) task performance of adult (<22 years, n=16) and aged (>22 years, n=14) rhesus macaques. In this task, a sample object was placed in the center reward well, and the monkey was allowed to collect the reward under it. A ten second delay was imposed between this sample phase of the task and the choice phase. The monkey was then presented a copy of the sample object and a novel object, and the correct response was to choose the novel object (the “nonmatching rule”). When the monkey made 90% correct responses across 100 trials at this 10 second delay, they met the ‘learning criterion’, the mean and quartile results from which are shown in A (with the two outliers excluded from the plot, MMU22119 and MMU36555). B) After the learning criterion was met, delays of 15, 30, 60, 120 and 600 seconds were imposed. The percent correct choices over each delay are shown here as the mean and standard deviation of the mean across all 60 acquisition trials. There were statistically significant effects of age for trials to criterion, % correct during learning and across the 5 delays. The p values from the post hoc tests are shown. C) The composite scores across the delays of 60, 120 and 600 seconds for each animal and each age group are shown here, and were also statistically significant across age.
Figure 3.
Figure 3.
Object Discrimination task performance of adult (<22 years, n=14) and aged (>22 years, n=15) rhesus macaques. The animals were required to learn 4 different pairs of objects, with the same object always being correct in a pair. A) the first measure of ‘learning’ the task was assessed using a state-space model (Smith et al. 2004) that is able to identify the trial at which the animal began to perform above chance on a given object pair. B) the second measure of learning was the percent correct responses for each of the 4 object pairs for each animal over the first 60 trials, which was then averaged to give a composite score for each age group. Both of these measures of learning were found to be statistically different between age groups, with the younger monkeys learning more quickly and having a higher percent correct across objects than did the older monkeys. C) At the end of the 60-trial acquisition period, a 48 hour delay was imposed, and retention of the correct objects in the 4 object pairs was retested over 30 additional trials, with the percent correct for each object for each individual animal averaged across adult and the aged groups, to give a composite score for percent correct retention performance. This age comparison was also statistically different between age groups.
Figure 4.
Figure 4.
Diagrammatic representation of the regional brain distribution and density of amyloid plaques (A), cerebral amyloid angiopathy (CAA; B) and phosphorylated tau (ptau) pathology (C), derived from the means of regional semi-quantitative densities (0 – 3 scale) in the 17 monkeys that were 22 years of age or older. Uncolored brain regions lacked pathology. The greatest densities of amyloid plaques were seen in the amygdala and temporal neocortex. The greatest densities of CAA were seen in the occipital association cortex. The greatest densities of ptau pathology were seen in the amygdala, hippocampus and entorhinal area; no region had any neurofibrillary tangles or dystrophic neurites on staining with thioflavin S or Gallyas silver. See also Table 3b for statistical analysis of plaque, CAA and ptau regional distributions, and Supplementary Tables 1a, b,c for all density scores by region for individual monkeys. Monkey brain templates derived from Bakker et al (2015), with reference to Paxinos et a (2000).
Figure 5.
Figure 5.
Photomicrographs of amyloid plaques (A-H) and CAA (I-L) in brain tissue from aged rhesus macaques. Plaques are stained with the Campbell-Switzer silver stain (A-D), thioflavin S (E, F) and AB IHC (G,H). Plaques are both diffuse (diff plq; G,H) and neuritic (neur plq; G,H) in their morphology. Cerebral amyloid angiopathy is stained with thioflavin S (I-K) and affects both small arteries and larger arterioles (I,J) as well as small arterioles and capillaries (K,L).
Figure 6.
Figure 6.
Photomicrographs of abnormally phosphorylated tau (ptau) pathology, stained with the AT8 antibody, in brain tissue from aged rhesus macaques. Examples are shown of neurons in CA1 hippocampus (A,B), septum (C), amygdala (D, I, J), entorhinal area (E), cingulate gyrus (F), gyrus rectus (G), and parasubiculum (H). Immunoreactive astrocytes (I-K) and an oligodendrocyte (L, coiled body) are also shown.
Figure 7.
Figure 7.
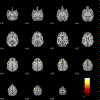
Brain maps showing significantly lower gray matter volumes (colored in dark-reddish to bright-yellow variation, see the color bar at the lower right corner), primarily in frontal areas, in aged monkeys as compared to the adult monkeys. These colored areas are significant at p = 0.005, uncorrected for voxel-wise multiple comparisons. The spatial distribution of gray matter regional differences was significant, with correction using Majority Count Statistics (MCS, see text for details). Numerals in lower left corner of horizontal slices represent the distance (in mm) from z=0 (the dorsoventral reference of the horizontal plane passing through the interaural line). The greatest age groups differences are denoted by the yellow coloration. The t-scores and p-values at peak voxel locations are shown in Supplementary Table 2 together with brain region names/labels. The left side of the display is the left of the brain in the D99-SL Atlas coordinate space.
Figure 8.
Figure 8.
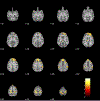
Association of MRI-based regional gray matter volumes with Object Discrimination (OD) learning trial scores. Brain maps showing significant association of gray matter volumes (colored in dark-reddish to bright-yellow variation, see the color bar at the lower right corner) with OD learning trial scores. The significance is p <= 0.005, uncorrected for voxel-wise multiple comparisons. The overall significance of the spatial distribution pattern was assessed using Majority Count Statistics (MCS, see text for details). The integers in the lower left corner of each horizontal slice represent the distance (in mm) from z=0 (the dorsoventral reference of the horizontal plane passing through the interaural line). The t-scores and p-values at peak voxel locations are shown in Supplementary Table 5 together with brain region names/labels. The left side of the display is the left of the brain in the D99-SL Atlas coordinate space.
Figure 9.
Figure 9.
Association of MRI-based regional gray matter volumes with Object Discrimination (OD) learning accuracy score. Brain maps showing significant association of gray matter volumes (colored in dark-reddish to bright-yellow variation, see the color bar at the lower right corner) with OD learning accuracy scores. The significance is p <= 0.005, uncorrected for voxel-wise multiple comparisons. The overall significance of the spatial distribution pattern was assessed using Majority Count Statistics (MCS, see text for details). The integers in the lower left corner of each horizontal slice represent the distance (in mm) from z=0 (the dorsoventral reference of the horizontal plane passing through the interaural line). The t-scores and p-values at peak voxel locations are shown in Supplementary Table 6 together with brain region names/labels. The left side of the display is the left of the brain in the D99-SL Atlas coordinate space.
Figure 10.
Figure 10.
Association of MRI-based regional gray matter volumes with Object Discrimination (OD) retention score. Brain maps showing significant association of gray matter volumes (colored in dark-reddish to bright-yellow variation, see the color bar at the lower right corner) with OD retention scores. The significance is p <= 0.005, uncorrected for voxel-wise multiple comparisons. The overall significance of the spatial distribution pattern was assessed using Majority Count Statistics (MCS, see text for details). The integers in the lower left corner of each horizontal slice represent the distance (in mm) from z=0 (the dorsoventral reference of the horizontal plane passing through the interaural line). The t-scores and p-values at peak voxel locations are shown in Supplementary Table 7 together with brain region names/labels. The left side of the display is the left of the brain in the D99-SL Atlas coordinate space.
Figure 11.
Figure 11.
Association of MRI-based regional gray matter volumes with CAA density scores (CAA-ALL). Brain maps showing significant associations of gray matter volumes, most prominently in occipital and parietal cortical regions but also in multiple other brain regions including some in frontal and temporal lobes as well as subcortical regions such as caudate nucleus and cerebellar cortex (colored in dark-reddish to bright-yellow variation, see the color bar at the lower right corner) with CAA-ALL. The significance is p <= 0.005, uncorrected for voxel-wise multiple comparisons. The overall significance of the spatial distribution pattern was assessed using Majority Count Statistics (MCS, see text for details). The integers in the lower left corner of each horizontal slice represent the distance (in mm) from z=0 (the dorsoventral reference of the horizontal plane passing through the interaural line). The t-scores and p-values at peak voxel locations are shown in Supplementary Table 8 together with brain region names/labels. The left side of the display is the left of the brain in the D99-SL Atlas coordinate space.

Similar articles

Cited by

References

    1. Alexander GE, Chen K, Aschenbrenner M, Merkley TL, Santerre-Lemmon LE, Shamy JL, Skaggs WE, Buonocore MH, Rapp PR, & Barnes CA (2008). Age-related regional network of magnetic resonance imaging gray matter in the rhesus macaque. The Journal of Neuroscience, 28(11), 2710–2718. 10.1523/JNEUROSCI.1852-07.2008 - DOI - PMC - PubMed
    1. Andreadis A, Brown WM, & Kosik KS (1992). Structure and novel exons of the human .tau. Gene. Biochemistry, 31(43), 10626–10633. 10.1021/bi00158a027 - DOI - PubMed
    1. Arriagada PV, Growdon JH, Hedley-Whyte ET, & Hyman BT (1992). Neurofibrillary tangles but not senile plaques parallel duration and severity of Alzheimer’s disease. Neurology, 42(3), 631–631. 10.1212/WNL.42.3.631 - DOI - PubMed
    1. Bachevalier J, Landis LS, Walker LC, Brickson M, Mishkin M, Price DL, & Cork LC (1991). Aged monkeys exhibit behavioral deficits indicative of widespread cerebral dysfunction. Neurobiology of Aging, 12(2), 99–111. - PubMed
    1. Bachevalier J, & Mishkin M (1986). Visual recognition impairment follows ventromedial but not dorsolateral prefrontal lesions in monkeys. Behavioural Brain Research, 20(3), 249–261. 10.1016/0166-4328(86)90225-1 - DOI - PubMed

MeSH terms