. 2024 Aug 13;9(18):e180114.
doi: 10.1172/jci.insight.180114.

Metabolic landscape of the healthy pancreas and pancreatic tumor microenvironment

Affiliations

Metabolic landscape of the healthy pancreas and pancreatic tumor microenvironment

Monica E Bonilla et al. JCI Insight. .

Abstract

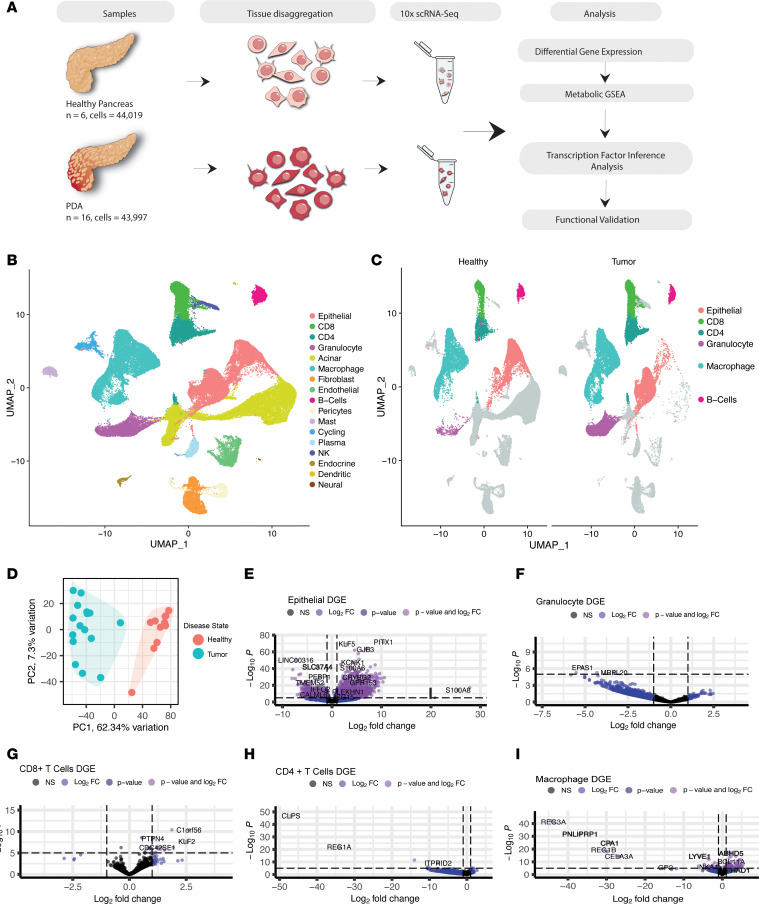
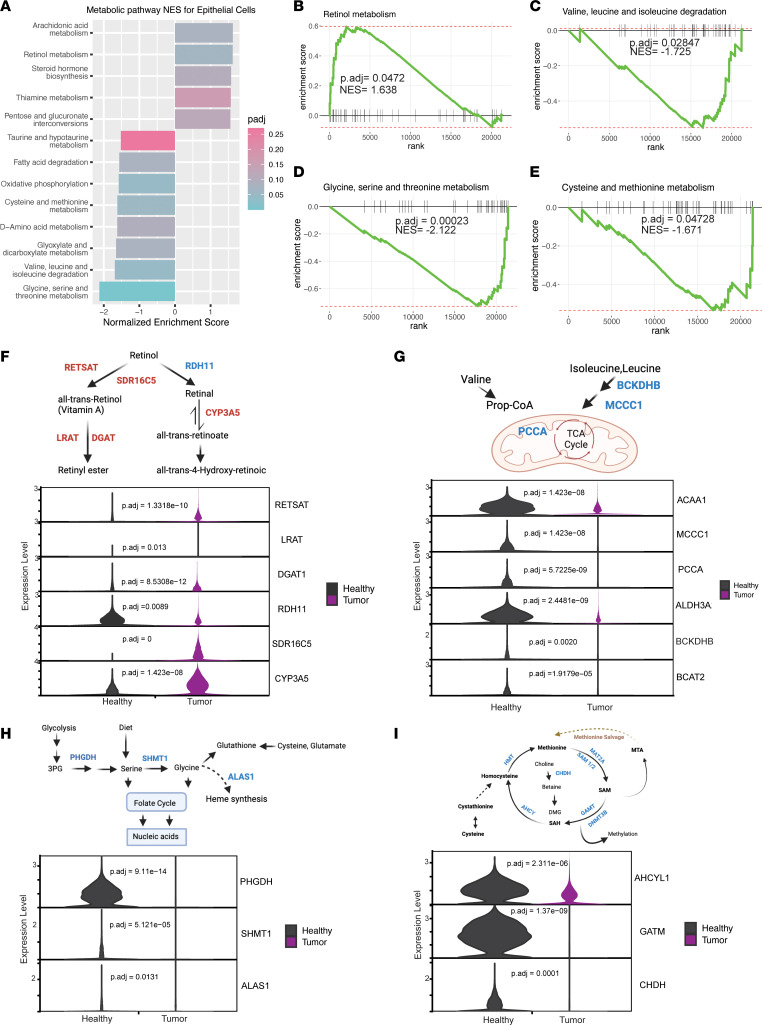
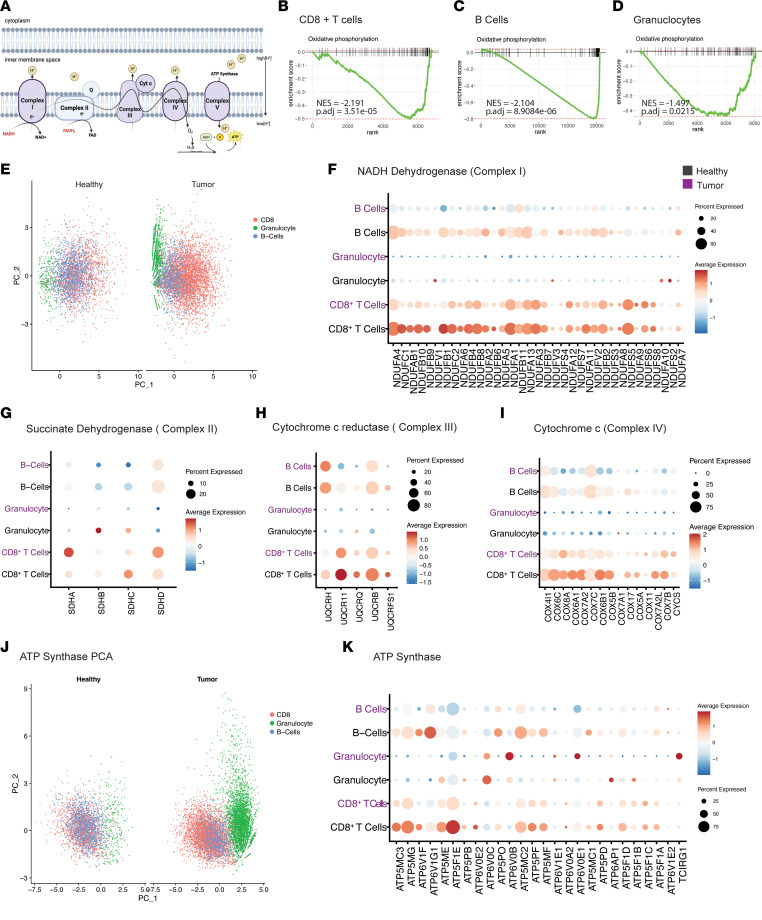
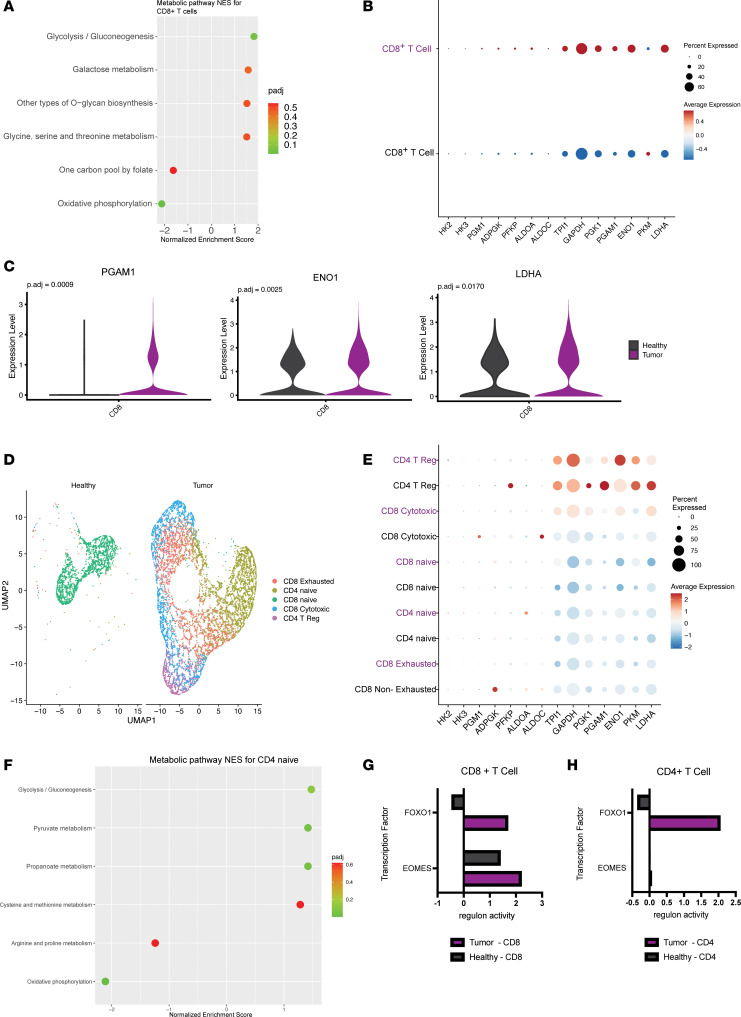
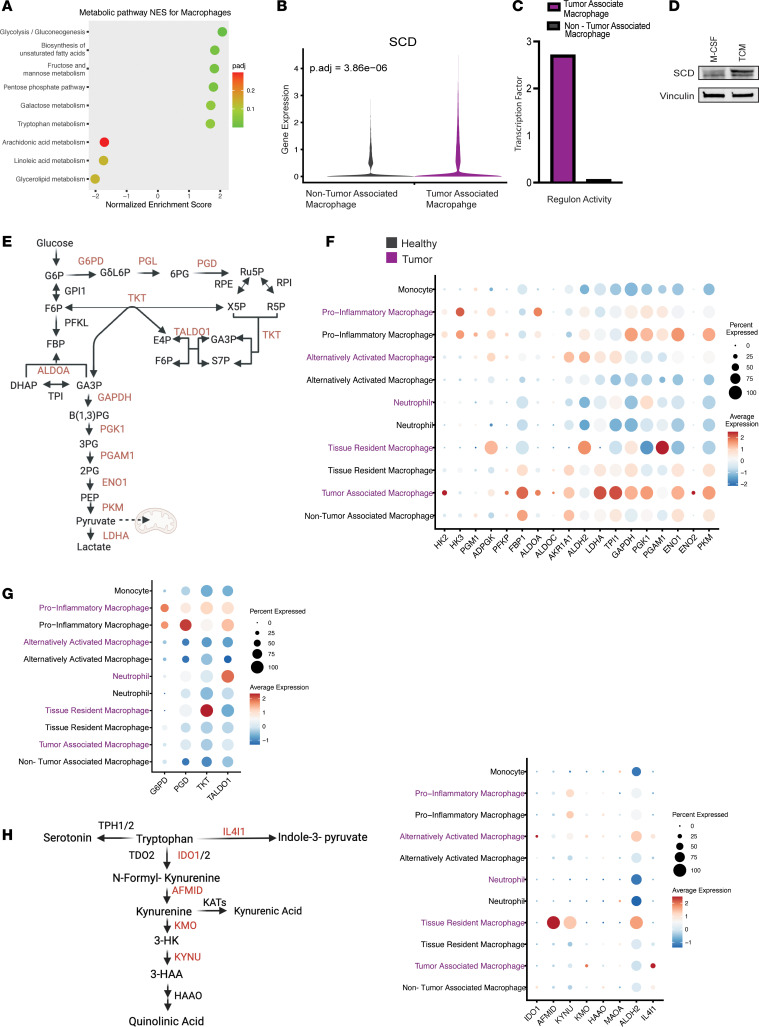
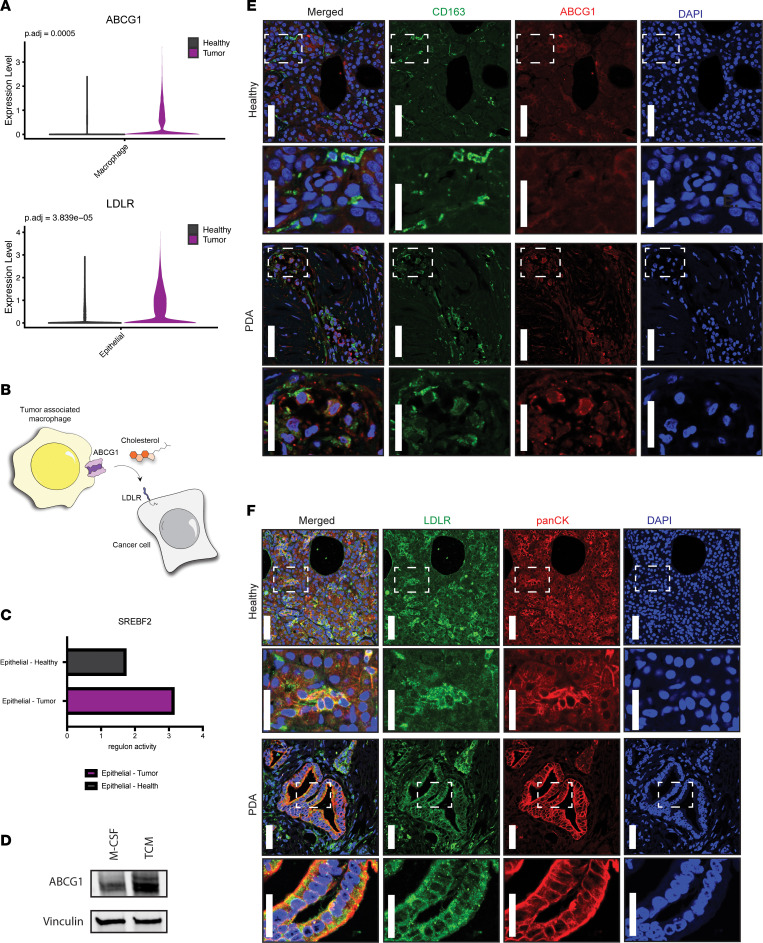
Pancreatic cancer, one of the deadliest human malignancies, is characterized by a fibro-inflammatory tumor microenvironment and wide array of metabolic alterations. To comprehensively map metabolism in a cell type-specific manner, we harnessed a unique single-cell RNA-sequencing dataset of normal human pancreata. This was compared with human pancreatic cancer samples using a computational pipeline optimized for this study. In the cancer cells we observed enhanced biosynthetic programs. We identified downregulation of mitochondrial programs in several immune populations, relative to their normal counterparts in healthy pancreas. Although granulocytes, B cells, and CD8+ T cells all downregulated oxidative phosphorylation, the mechanisms by which this occurred were cell type specific. In fact, the expression pattern of the electron transport chain complexes was sufficient to identify immune cell types without the use of lineage markers. We also observed changes in tumor-associated macrophage (TAM) lipid metabolism, with increased expression of enzymes mediating unsaturated fatty acid synthesis and upregulation in cholesterol export. Concurrently, cancer cells exhibited upregulation of lipid/cholesterol receptor import. We thus identified a potential crosstalk whereby TAMs provide cholesterol to cancer cells. We suggest that this may be a new mechanism boosting cancer cell growth and a therapeutic target in the future.

Keywords: Bioinformatics; Cancer; Macrophages; Oncology.


Conflict of interest statement

Conflict of interest: In the past 3 years, CAL has consulted for Astellas Pharmaceuticals, Odyssey Therapeutics, Third Rock Ventures, and T-Knife Therapeutics and is an inventor on patents pertaining to Kras-regulated metabolic pathways, redox control pathways in pancreatic cancer, and targeting the glutamic-oxaloacetic transaminase 1/malic enzyme 1 pathway as a therapeutic approach (US Patent No: 2015126580-A1, 05/07/2015; US Patent No: 20190136238, 05/09/2019; International Patent No: WO2013177426-A2, 04/23/2015).

Figures

Figure 1
Figure 1. Data composition and workflow.
(A) Schematic of single-cell sequencing performed on 6 healthy pancreata procured from a collaboration with the Gift of Life Michigan, a center for organ and tissue procurement, and 16 pancreatic cancer samples: 10 from surgical resections and 6 from fine needle biopsies at the University of Michigan. Followed by analysis workflow. (B) Uniform manifold approximation and projection (UMAP) visualization of all identified cell types present in the pancreatic microenvironment. (C) UMAP visualization of cell types that demonstrated significant metabolic alterations in the pancreatic cancer samples compared with healthy human pancreas tissue when GSEA was performed with metabolic gene sets. (D) Principal component analysis (PCA) plot of healthy human pancreata samples and PDA samples. (EI) Volcano plots of DGE by cell type. Genes that are significantly up- (top right) and downregulated (top left) in tumor versus heathy and the gene symbols are included for representative differentially expressed genes.
Figure 2
Figure 2. Metabolic coadaptations in pancreatic cancer cells.
(A) Significantly altered metabolic pathways in epithelial cells derived from pancreatic cancer samples (n = 16) compared with healthy pancreas samples (n = 6), with corresponding normalized enrichment scores (NES) and adjusted P values from GSEA. (BE) GSEA enrichment plots of significantly up- or downregulated metabolic pathways in cancer cells with corresponding NES and adjusted P values. (F) Schematic of retinol metabolism, blue corresponding to differentially decreased genes and red to differentially increased in tumor-derived epithelial cells. Violin plots of selected retinol metabolism genes comparing healthy to tumor, with adjusted P values for significantly differentially expressed genes. (G) Schematic of valine, leucine, and isoleucine degradation. Violin plots of selected valine, leucine, and isoleucine metabolism genes comparing healthy with tumor, with adjusted P values for significantly differentially expressed genes. (H) Schematic of glycine, serine, and threonine metabolism. Violin plots of selected glycine, serine, and threonine metabolism genes comparing healthy with tumor, with adjusted P values for significantly differentially expressed genes. (I) Schematic of cysteine and methionine metabolism. Violin plots of cysteine and methionine metabolism genes comparing healthy with tumor, with adjusted P values for significantly differentially expressed genes.
Figure 3
Figure 3. Downregulation of oxidative phosphorylation in immune cells.
(A) Schematic of electron transport chain (ETC). (BD) GSEA enrichment plots demonstrating oxidative phosphorylation is significantly downregulated in CD8+ T cells, B cells, and granulocytes derived from PDA samples, compared with healthy human pancreas tissue, with corresponding NES and adjusted P values. (E) PCA visualization based on the expression of genes driving complex I in B cells, granulocytes, and CD8+ T cells in healthy human and PDA samples. (FI) Dot plot visualization based on the average expression and percentage of cells expressing genes driving complexes I, II, III, and IV, respectively, in B cells, granulocytes, and CD8+ T cells in healthy human (black) and PDA samples (purple). (J) PCA visualization based on the expression of genes driving ATP synthase in B cells, granulocytes, and CD8+ T cells in healthy human and PDA samples. (K) Dot plot visualization of cells expressing ATP synthase–related genes and percentage expressing these genes in immune cells from tumor tissue (purple) and healthy tissue (black).
Figure 4
Figure 4. Metabolic rewiring of T cells in the pancreatic cancer microenvironment.
(A) Significantly altered pathways in CD8+ T cells from PDA samples compared with CD8+ T cells derived from the healthy tissue. (B) Dot plot visualization of the average expression and percentage of cells expressing genes driving glycolysis in CD8+ T cells from tumor tissue (purple) and healthy tissue (black). (C) Violin plots of the expression of selected differentially expressed glycolysis metabolism genes comparing CD8+ T cells from tumor samples with those from healthy samples. (D) UMAP visualization of CD4+ and CD8+ T cell populations in the tumor and healthy tissue. (E) Dot plot visualization of the average expression and percentage of cells expressing genes driving glycolysis in CD4+ and CD8+ T cell populations from tumor tissue (purple) and healthy tissue (black). (F) Significantly altered pathways in CD4+ naive cells from PDA samples compared with healthy naive CD4+ cells. (G and H) Transcription factor analysis showing regulon activity scores of FOXO1 and EOMES in CD8+ T cells in tumor and healthy samples.
Figure 5
Figure 5. Metabolic alterations in TAMs.
(A) Significantly altered metabolic pathways in macrophages derived from pancreatic cancer samples compared with healthy pancreas samples, with corresponding NES and adjusted P values. (B) Violin plot of the expression of stearoyl-CoA desaturase (SCD) in macrophages in tumor and healthy samples, showing differential expression. (C) Transcription factor analysis showing regulon activity of PPARG in macrophages in tumor and healthy samples. (D) Western blot, where protein expression of SCD is higher in murine bone marrow–derived monocytes treated with TCM compared with control condition with M-CSF. (E) Glucose and PPP schematic. (F) Dot plot visualization of genes driving glycolysis displaying average expression and percentage expressed in macrophages in tumor (purple) and healthy pancreas tissue (black). (G) Dot plot visualization of genes driving PPP that do not overlap with glycolysis, displaying average expression and percentage expressed macrophages in tumor (purple) and healthy pancreas tissue (black). (H) Tryptophan metabolism schematic, with dot plot visualization of genes driving tryptophan metabolism, displaying average expression and percentage expressed in macrophages in tumor (purple) and healthy pancreas tissue (black).
Figure 6
Figure 6. Metabolic cellular crosstalk between epithelial cells and TAMs.
(A) Violin plots showing ABCG1 is significantly upregulated in TAMs, and LDLR is significantly upregulated in tumor-derived epithelial cells. (B) Schematic of TAMs increasing ABCG1 (cholesterol exporter) expression. Cancer cells increase expression of a corresponding lipid/cholesterol receptor LDLR. (C) Transcription factor analysis showing SREBF2 regulon activity score is increased in tumor-derived epithelial cells. (D) Western blot, where protein expression of ABCG1 is 1.7 times higher in murine bone marrow–derived monocytes treated with TCM compared with control condition with M-CSF. (E) Immunofluorescence of CD163 (green), ABCG1 (red), and DAPI (blue) in healthy human pancreas and PDA. (F) Immunofluorescence of LDLR (green), panCK (red), and DAPI (blue) in healthy human pancreas and PDA. Immunofluorescence from E and F is representative of 3 healthy individuals and 3 individuals with PDA, with staining performed twice per sample. For the low-magnification images, the scale bar is 50 μm, and for the zoomed insets, the scale bar is 25 μm.

References

    1. Siegel RL, et al. Cancer statistics, 2024. CA Cancer J Clin. 2024;74(1):12–49. doi: 10.3322/caac.21820. - DOI - PubMed
    1. Sarantis P, et al. Pancreatic ductal adenocarcinoma: treatment hurdles, tumor microenvironment and immunotherapy. World J Gastrointest Oncol. 2020;12(2):173–181. doi: 10.4251/wjgo.v12.i2.173. - DOI - PMC - PubMed
    1. Ying H, et al. Genetics and biology of pancreatic ductal adenocarcinoma. Genes Dev. 2016;30(4):355–385. doi: 10.1101/gad.275776.115. - DOI - PMC - PubMed
    1. Tsujikawa T, et al. Quantitative multiplex immunohistochemistry reveals myeloid-inflamed tumor-immune complexity associated with poor prognosis. Cell Rep. 2017;19(1):203–217. doi: 10.1016/j.celrep.2017.03.037. - DOI - PMC - PubMed
    1. Halbrook CJ, et al. Differential integrated stress response and asparagine production drive symbiosis and therapy resistance of pancreatic adenocarcinoma cells. Nat Cancer. 2022;3(11):1386–1403. doi: 10.1038/s43018-022-00463-1. - DOI - PMC - PubMed