. 2024 Aug 13;9(18):e178453.
doi: 10.1172/jci.insight.178453.

Pyruvate metabolism dictates fibroblast sensitivity to GLS1 inhibition during fibrogenesis

Affiliations

Pyruvate metabolism dictates fibroblast sensitivity to GLS1 inhibition during fibrogenesis

Greg Contento et al. JCI Insight. .

Abstract

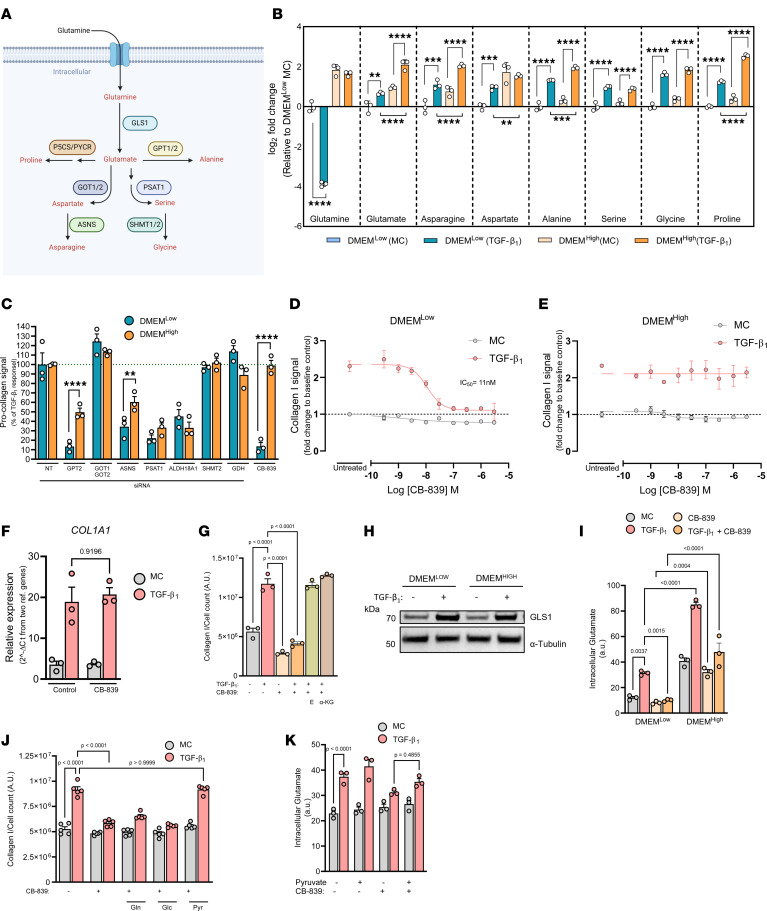
Fibrosis is a chronic disease characterized by excessive extracellular matrix production, which leads to disruption of organ function. Fibroblasts are key effector cells of this process, responding chiefly to the pleiotropic cytokine transforming growth factor-β1 (TGF-β1), which promotes fibroblast to myofibroblast differentiation. We found that extracellular nutrient availability profoundly influenced the TGF-β1 transcriptome of primary human lung fibroblasts and that biosynthesis of amino acids emerged as a top enriched TGF-β1 transcriptional module. We subsequently uncovered a key role for pyruvate in influencing glutaminase (GLS1) inhibition during TGF-β1-induced fibrogenesis. In pyruvate-replete conditions, GLS1 inhibition was ineffective in blocking TGF-β1-induced fibrogenesis, as pyruvate can be used as the substrate for glutamate and alanine production via glutamate dehydrogenase (GDH) and glutamic-pyruvic transaminase 2 (GPT2), respectively. We further show that dual targeting of either GPT2 or GDH in combination with GLS1 inhibition was required to fully block TGF-β1-induced collagen synthesis. These findings embolden a therapeutic strategy aimed at additional targeting of mitochondrial pyruvate metabolism in the presence of a glutaminolysis inhibitor to interfere with the pathological deposition of collagen in the setting of pulmonary fibrosis and potentially other fibrotic conditions.

Keywords: Cell biology; Collagens; Fibrosis; Glucose metabolism; Metabolism.


Conflict of interest statement

Conflict of interest: RCC declares receiving funding for some of this work from a collaborative framework agreement between UCL and Chiesi Farmaceutici S.p.A.

Figures

Figure 1
Figure 1. The TGF-β1–induced transcriptome is sensitive to media composition.
(A and B) Volcano plots showing differentially expressed genes (DEGs) in (A) DMEMlo and (B) DMEMhi of pHLFs stimulated with TGF-β1 (1 ng/mL) for 24 hours with cutoff values q ≤ 0.05 and fold-change ± 1.5. (n = 3.) (C) Overlap diagram of DEGs between DMEMlo and DMEMhi. (D) Network plot of enriched Reactome terms of DEGs shared between DMEMlo and DMEMhi. (E) Supernatants collected from pHLFs stimulated with TGF-β1 (1 ng/mL) for 48 hours and hydroxyproline quantified using HPLC (n = 3), representative of 5 independent experiments. (F and G) Dot plots showing top 20 enriched KEGG terms in (F) DMEMlo and (G) DMEMhi. Data are presented as mean ± SD and differences evaluated between groups with 2-way ANOVA with Tukey’s multiple-comparison testing. NES, normalized enrichment score.
Figure 2
Figure 2. TGF-β1–modulated intracellular amino acid pools influence metabolic vulnerabilities.
(A) Glutaminolysis schematic. GOT, glutamic-oxaloacetic transaminase; ASNS, asparagine synthetase; PSAT1, phosphoserine aminotransferase 1; SHMT1/2, serine hydroxymethyltransferase 1/2. (B) Intracellular levels of amino acids in DMEMlo or DMEMhi stimulated with TGF-β1 (1 ng/mL) for 48 hours (n = 3). (C) Supernatants collected from pHLFs stimulated with TGF-β1 following transfection with nontargeting siRNA for control and CB-839–treated groups (1 μM) or targeted siRNA and hydroxyproline quantified (n = 3). (D and E) pHLFs were grown in DMEMlo or DMEMhi and preincubated with increasing concentrations of CB-839 before TGF-β1 stimulation and collagen I deposition assessed by macromolecular crowding assay. Data are expressed as collagen I signal as fold-change of media control (0.1% DMSO). (F) COL1A1 mRNA levels 24 hours after TGF-β1 stimulation from pHLFs growing in DMEMlo and 1 μM CB-839. (G) Collagen deposition quantified 48 hours after TGF-β1 stimulation from pHLFs growing in DMEMlo and 1 μM CB-839 with supplementation of dimethylated forms of glutamate (E, 4 mM) and α-ketoglutarate (4 mM). (H) Immunoblot of intracellular protein lysates from pHLFs 24 hours following TGF-β1 stimulation grown in DMEMlo or DMEMhi. (I) pHLFs were grown in DMEMlo or DMEMhi and stimulated with TGF-β1 and CB-839 for 48 hours and glutamate measured by HPLC (n = 3). (J) pHLFs were grown in DMEMlo supplemented with glutamine (1.3 mM), glucose (20 mM), or pyruvate (1 mM) before preincubation with 1 μM CB-839 before TGF-β1 stimulation and collagen I deposition assayed by macromolecular crowding assay. (K) Intracellular glutamate levels in pHLFs grown in DMEMlo supplemented with pyruvate (1 mM) and preincubation with CB-839 for 1 hour before TGF-β1 stimulation and quantification achieved using HPLC (n = 3). Data are presented as mean ± SD. Two-way ANOVA with Tukey’s multiple-comparison testing. **P < 0.01, ***P < 0.001, ****P < 0.0001.
Figure 3
Figure 3. Exogenous pyruvate supports the TCA cycle under GLS1 restriction.
(A) Schematic showing [U-13C]-glucose routing to pyruvate and relevant TCA cycle intermediates and amino acids. (BE) Intracellular isotopolog levels and fractional enrichment of specified metabolites in pHLFs grown in DMEMlo supplemented with [U-13C]-glucose (5 mM) and preincubated with media control (0.1% DMSO) or 1 μM CB-839 for 1 hour before stimulation with TGF-β1 (1 ng/mL) for 48 hours and quantification using LC-MS (n = 3). (FM) Intracellular levels of specified metabolites or (L and M) fractional enrichment in pHLFs grown in DMEMlo supplemented with [U-13C]-glucose (5 mM) or [U-13C]-pyruvate (1 mM) and preincubated with media control (0.1% DMSO) or 1 μM CB-839 for 1 hour before stimulation with TGF-β1 (1 ng/mL) for 48 hours and quantification using LC-MS (n = 3). (N and O) Collagen deposition quantified 48 hours after TGF-β1 (1 ng/mL) stimulation from pHLFs growing in DMEMlo and 1 μM CB-839 with supplementation of acetate (1 mM) or dichloroacetate (DCA, 10 mM).
Figure 4
Figure 4. Exogenous pyruvate supports amino acid biosynthesis under GLS1 restriction.
(A) Pathway analysis using MetaboAnalyst 5.0 of metabolites with high [U-13C]-pyruvate enrichment in 1 μM CB-839–treated and TGF-β1–stimulated (1 ng/mL) pHLFs following 48 hours. (BJ) Intracellular isotopolog levels, (FI) fractional enrichment, and (J) total abundance of specified metabolites in pHLFs grown in DMEMlo supplemented with [U-13C]-glucose (5 mM) or [U-13C]-pyruvate (1 mM) and preincubated with media control (0.1% DMSO) or 1 μM CB-839 for 1 hour before stimulation with TGF-β1 (1 ng/mL) for 48 hours and quantification using LC-MS (n = 3).
Figure 5
Figure 5. Pyruvate confers resistance to GLS1 inhibition through GDH-driven glutamate and GPT2-driven alanine biosynthesis.
(A) Intracellular amino acid levels of pHLFs supplemented with dimethyl-α-ketoglutarate (4 mM) with 1 μM CB-839 and TGF-β1 (1 ng/mL) for 48 hours. (B) pHLFs were supplemented with dimethyl-α-ketoglutarate (4 mM) or pyruvate (1 mM) and preincubated with 1 μM CB-839 or 50 μM EGCG before stimulation with TGF-β1 (1 ng/mL) for 48 hours, and collagen I deposition was assessed by macromolecular crowding assay. (C) pHLFs were preincubated with increasing concentrations of EGCG for 1 hour before being stimulated with TGF-β1 (1 ng/mL) for 48 hours, and collagen I deposition was assessed by macromolecular crowding assay. (D) pHLFs were transfected with nontargeting (NT) siRNA or siRNA targeting GDH, cells were preincubated with 1 μM CB-839 and dimethyl-α-ketoglutarate (4 mM) before stimulation with TGF-β1 (1 ng/mL), and intracellular glutamate levels were quantified by HPLC after 48 hours. (E and F) pHLFs were treated with 1 μM CB-839 for 1 hour prior to TGF-β1 (1 ng/mL) stimulation for 24 hours, and RNA was quantified using quantitative PCR. (G) Immunoblot from pHLFs 24 hours following TGF-β1 stimulation (1 ng/mL) and 1 μM CB-839. (H) pHLFs were treated with 1 μM CB-839 for 1 hour supplemented with alanine or proline (500 μM) prior to TGF-β1 (1 ng/mL) stimulation for 48 hours, and collagen I deposition was assessed by macromolecular crowding assay. (I) pHLFs were supplemented with alanine (500 μM) before stimulation with TGF-β1 (1 ng/mL) and CB-839 (1 μM) for 48 hours, with intracellular proline measured by HPLC (n = 3). (J) pHLFs were treated as in B with alanine (500 μM) or pyruvate (1 mM) supplementation prior to a 1-hour preincubation with 20 μM l-cycloserine or 50 μM EGCG before stimulation with TGF-β1 (1 ng/mL) for 48 hours, and collagen I deposition was assessed by macromolecular crowding assay. (K) Schematic showing pyruvate and glutamine routing into the TCA cycle. Data are presented as mean ± SD, and differences were evaluated between groups with 2-way ANOVA with Tukey’s multiple-comparison testing.
Figure 6
Figure 6. GLS1 and GDH are expressed by activated fibroblasts in IPF.
(AC) mRNA expression of indicated genes in GEO GSE110147 between a control lung and IPF lung. Patient numbers are indicated. Box plots show the interquartile range, median (line), and minimum and maximum (whiskers). (DF) mRNA expression of indicated genes in GEO GSE135893 comparing 4 fibroblast subpopulations found in IPF lung tissue. (G) Pathway analysis (KEGG) of 1,244 upregulated genes (P < 0.05) derived from comparing control lung myofibroblasts and IPF lung myofibroblasts. (H and I) IPF lung tissue double-immunofluorescence staining for (H) GLS1 and α–smooth muscle actin and (I) GDH and α–smooth muscle actin. Arrows indicate myofibroblast-concentrated regions in representative images shown of 3 patients with IPF.
Figure 7
Figure 7. Dual inhibition of GLS1 and GDH prevents TGF-β1–induced collagen secretion in precision-cut ex vivo lung slices.
(A) Schematic illustrating the experimental process for precision-cut ex vivo lung tissue slices (PCLS) and showing immunohistochemical visualization of cell nuclei (DAPI) and tissue structure (collagen I). (B) Tissue slice viability quantified via reduction of resazurin (560/590 nm excitation/emission). (C) PCLS were treated with 1 μM CB-839 or 50 μM EGCG before stimulation with TGF-β1 (10 ng/mL) for 72 hours and soluble pro-collagen quantification via reverse-phase HPLC detection of hydroxyproline. Data are presented as mean ± SD, and differences are evaluated between groups with 2-way ANOVA with Tukey’s multiple-comparison testing.
Figure 8
Figure 8. Proposed mechanism by which pyruvate routing under GLS1-inhibited conditions sustains fibrogenesis through GDH and GPT2.
TGF-β1 increases GLS1 expression, which leads to a conversion of intracellular glutamine levels to glutamate, which supports alanine and proline biosynthesis, necessary for a TGF-β1–induced collagen response. Following GLS1 restriction, glutamate, alanine, and proline levels decrease, which are capable of being sustained by exogenous pyruvate, which supplies glutamate through TCA cycle routing. Preventing this routing by inhibition of GDH or preventing alanine biosynthesis by inhibition of GPT2 are 2 strategies to effectively limit the TGF-β1–induced collagen response under GLS1 restriction. TGF-β1, transforming growth factor β1; GLS1, glutaminase 1; GDH, glutamate dehydrogenase; GPT2, glutamic-pyruvic transaminase 2.

References

    1. Wynn TA. Common and unique mechanisms regulate fibrosis in various fibroproliferative diseases. J Clin Invest. 2007;117(3):524–529. doi: 10.1172/JCI31487. - DOI - PMC - PubMed
    1. Lee AS, et al. The burden of idiopathic pulmonary fibrosis: an unmet public health need. Respir Med. 2014;108(7):955–967. doi: 10.1016/j.rmed.2014.03.015. - DOI - PubMed
    1. King TE, et al. Idiopathic pulmonary fibrosis: relationship between histopathologic features and mortality. Am J Respir Crit Care Med. 2001;164(6):1025–1032. doi: 10.1164/ajrccm.164.6.2001056. - DOI - PubMed
    1. Richeldi L, et al. Efficacy and safety of nintedanib in idiopathic pulmonary fibrosis. N Engl J Med. 2014;370(22):2071–2082. doi: 10.1056/NEJMoa1402584. - DOI - PubMed
    1. King TE, et al. A phase 3 trial of pirfenidone in patients with idiopathic pulmonary fibrosis. N Engl J Med. 2014;370(22):2083–2092. doi: 10.1056/NEJMoa1402582. - DOI - PubMed

MeSH terms