. 2024 Nov 11;52(20):12351-12377.
doi: 10.1093/nar/gkae811.

p53-dependent crosstalk between DNA replication integrity and redox metabolism mediated through a NRF2-PARP1 axis

Affiliations

p53-dependent crosstalk between DNA replication integrity and redox metabolism mediated through a NRF2-PARP1 axis

Gamal Ahmed Elfar et al. Nucleic Acids Res. .

Abstract

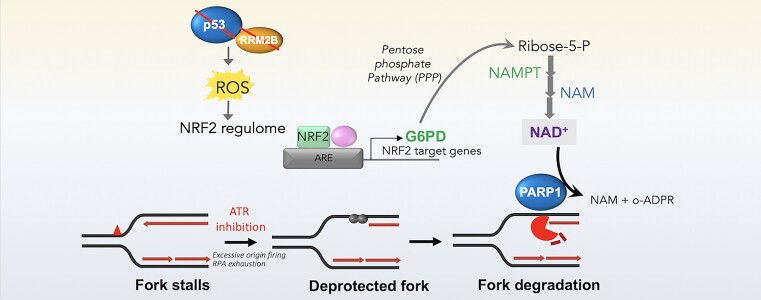
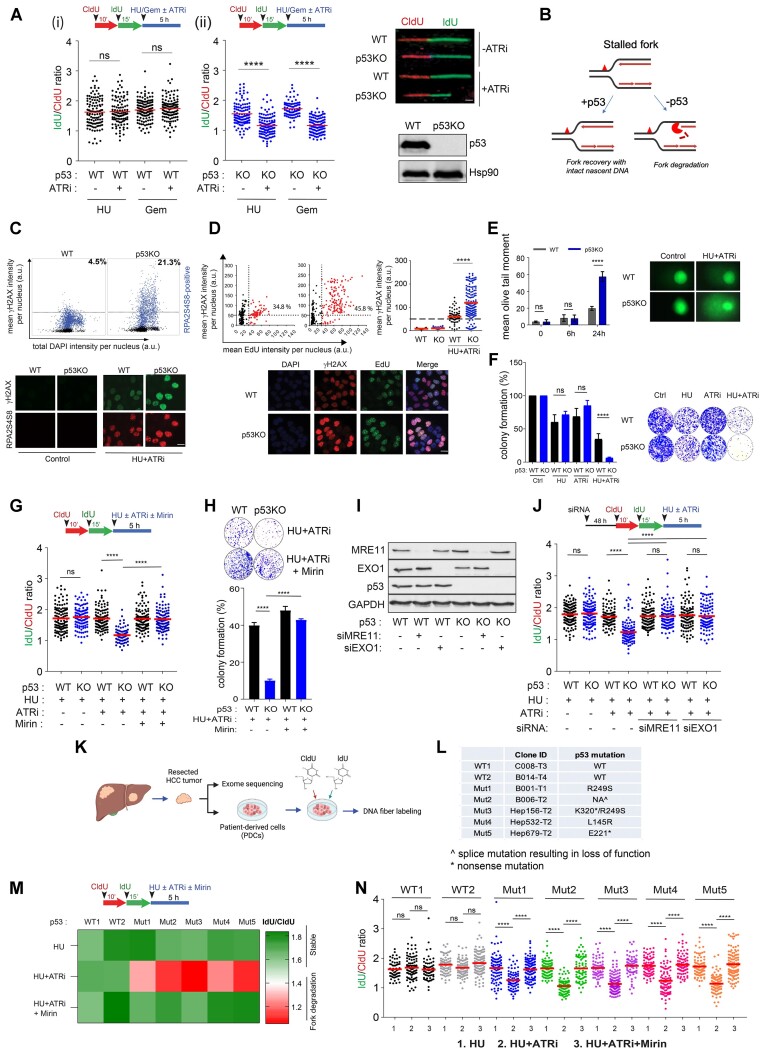
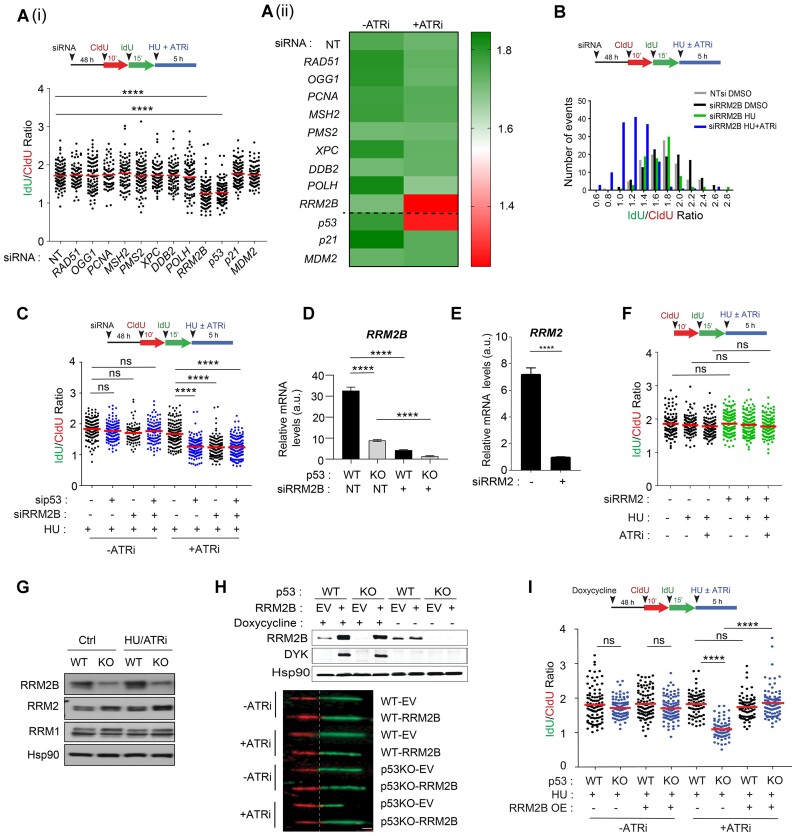
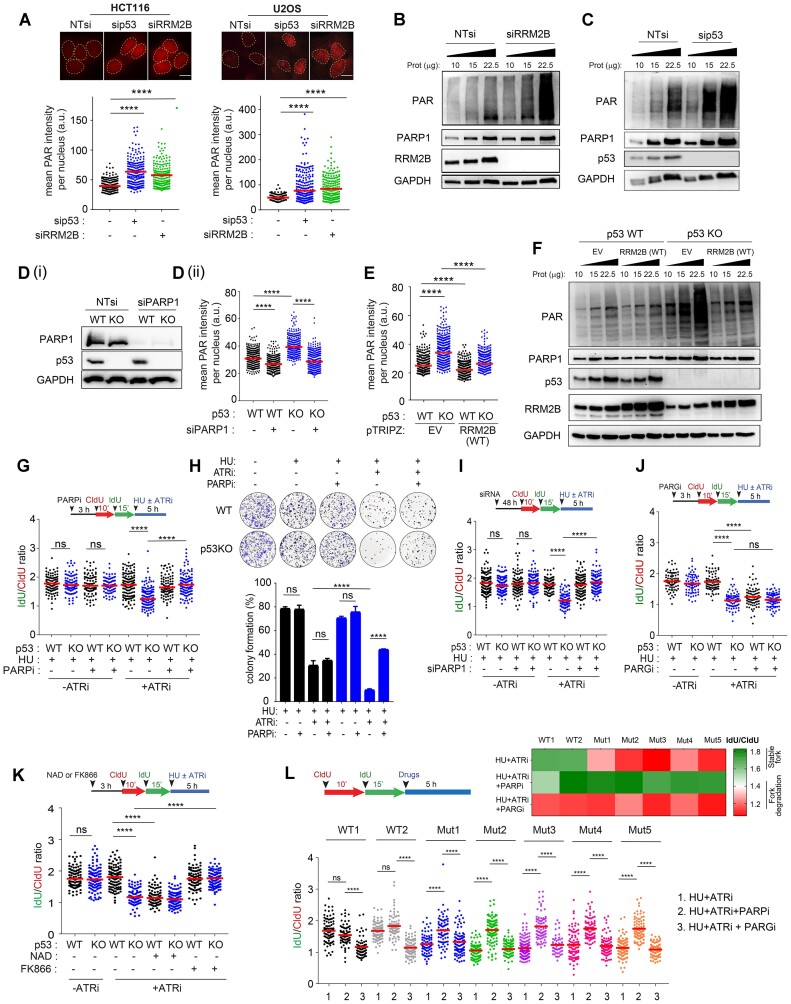
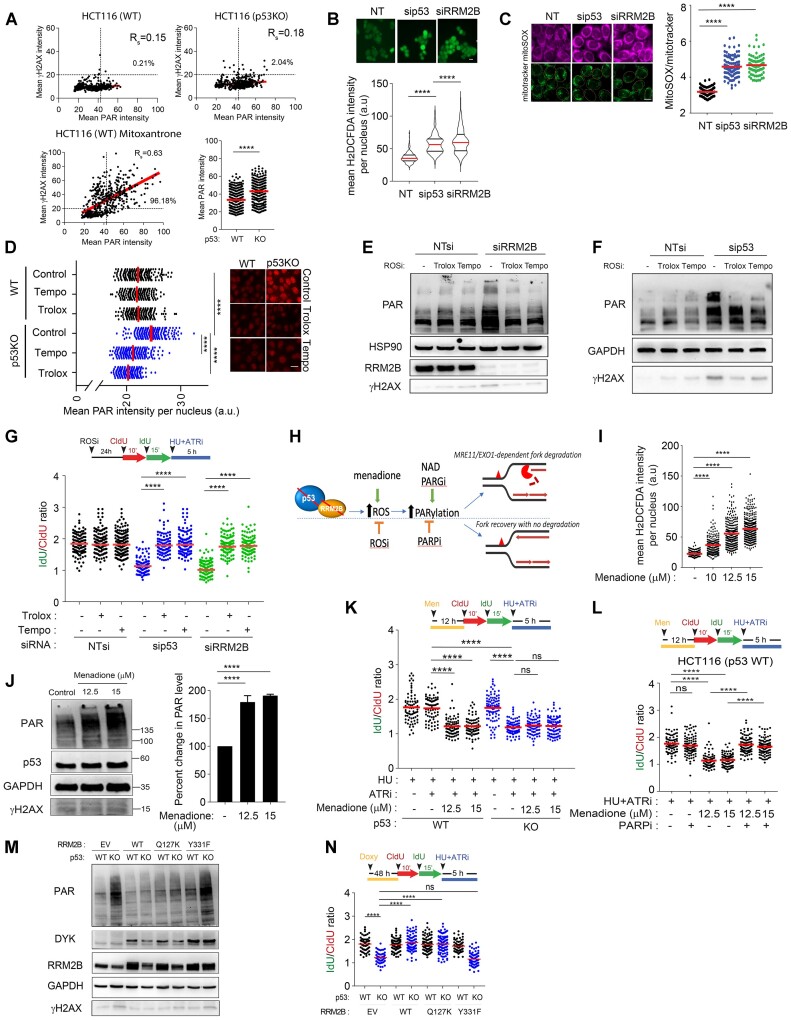
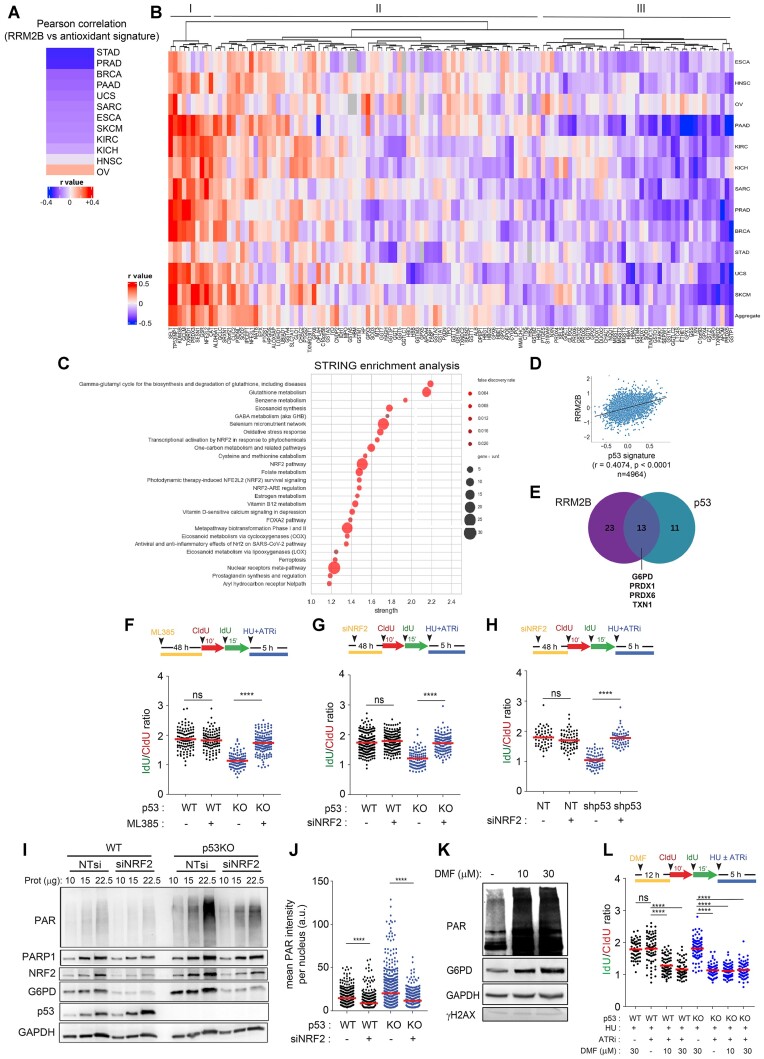
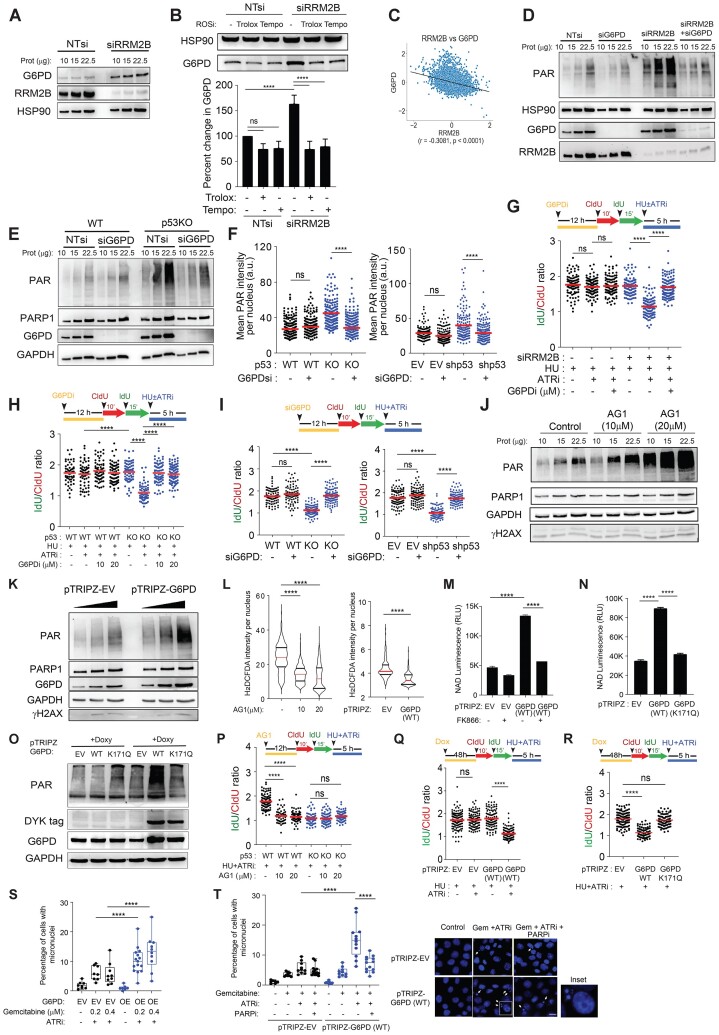
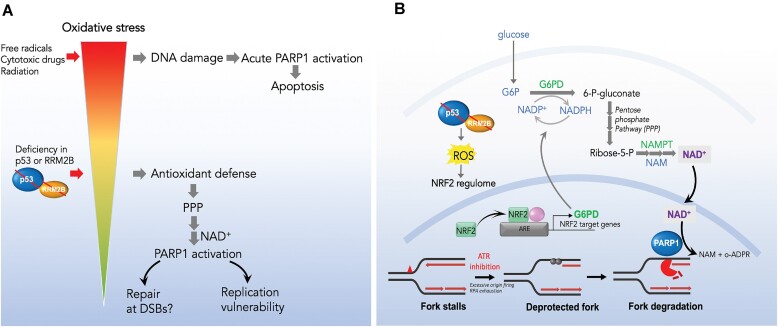
Mechanisms underlying p53-mediated protection of the replicating genome remain elusive, despite the quintessential role of p53 in maintaining genomic stability. Here, we uncover an unexpected function of p53 in curbing replication stress by limiting PARP1 activity and preventing the unscheduled degradation of deprotected stalled forks. We searched for p53-dependent factors and elucidated RRM2B as a prime factor. Deficiency in p53/RRM2B results in the activation of an NRF2 antioxidant transcriptional program, with a concomitant elevation in basal PARylation in cells. Dissecting the consequences of p53/RRM2B loss revealed a crosstalk between redox metabolism and genome integrity that is negotiated through a hitherto undescribed NRF2-PARP1 axis, and pinpoint G6PD as a primary oxidative stress-induced NRF2 target and activator of basal PARylation. This study elucidates how loss of p53 could be destabilizing for the replicating genome and, importantly, describes an unanticipated crosstalk between redox metabolism, PARP1 and p53 tumor suppressor pathway that is broadly relevant in cancers and can be leveraged therapeutically.


Figures

Graphical Abstract
Graphical Abstract
Figure 1.
Figure 1.
Loss of p53 promotes MRE11/EXO1-directed fork degradation at deprotected forks. (A), Schematic of the fork degradation assay in (i) HCT116 parental (WT) and (ii) isogenic p53KO cells. Red and green indicate CldU and IdU labeling, respectively, prior to replication stress induced either by HU (2 mM) or gemcitabine (1 μM) and in the presence or absence of an ATR inhibitor (ATRi), VE-821 (2 μM). IdU/CIdU ratios of individual replication forks presented in a scatterplot. Representative of at least three independent experiments. Right: Representative images of single DNA fibers shown. Scale bar, 50 μm. n > 100. Immunoblots showing p53 protein levels in HCT116 parental (WT) and isogenic p53KO cells. Hsp90 included as loading control. (B) Schematic model illustrating the fate of deprotected stalled forks in cells, in the presence or absence of p53. (C) Quantitative image-based cytometry (QIBC) of HCT116 cells treated with HU (2 mM) and ATRi (2 μM) for 6 h. Cells were co-immunostained for γH2AX (Millipore, JBW301) and RPA2S4S8 (Novus Biologicals, NBP1-23017). Mean γH2AX, RPA2S4S8 and total DAPI intensity per nucleus were quantified and plotted. n > 4000. Representative IF images are shown (bottom). Scale bar, 20 μm. (D) Percentages of EdU/γH2AX co-immunostained cells are indicated in HCT116 parental (WT) and p53KO cells pulsed-labelled with EdU (10 μM) for 15 min followed by treatment with HU (2 mM) and ATRi (2 μM) for 6 h. Mean γH2AX intensity per nucleus also plotted (right). Representative IF images shown (bottom). Scale bar, 20 μm. (E) HCT116 parental (WT) and p53KO cells treated with HU (2mM) and ATRi (2 μM) at the indicated timepoints were subjected to a comet assay and mean olive tail moment plotted. Experiments in (C) to (E) are repeated three times with similar results. (F) Colony forming assay of HCT116 (WT) and p53KO cells treated with HU (2 mM) and in the presence or absence of an ATR inhibitor VE-821 (2 μM) for 24 h and recovered in fresh media for eight days. DMSO-treated control included (Ctrl). Colonies are quantified and expressed as percentage of DMSO-treated controls. Representative of n = 3 independent experiments. (G), Schematic of the fork degradation assay in HCT116 parental (WT) and isogenic p53KO cells with or without mirin (50 μM). HU (2 mM) in the presence or absence of ATRi (2 μM) used as indicated. Representative of at least three independent experiments. (H) Colony forming assay of HCT116 (WT) and p53KO cells treated with or without mirin (50 μM) in the presence of HU (2 mM) and ATRi (2 μM) (24 h). Representative of n = 3 experiments. Colonies are quantified and expressed as percentage of DMSO-treated controls. (I) Western blot to validate the knockdown efficiencies of MRE11- and EXO1-targeted siRNAs in HCT116 cells (WT and p53KO). Representative of n = 2 experiments. (J) Schematic of the fork degradation assay in HCT116 parental (WT) and isogenic p53KO cells in HCT116 parental (WT) and p53 KO cells transfected with MRE11- or EXO1-targeted siRNAs. HU (2 mM) in the presence or absence of ATRi (2 μM) were used as indicated. Representative of at least three independent experiments. (K) Hepatocellular Carcinoma (HCC) patient-derived cells (PDCs) were subjected to whole exome sequencing and their p53 genetic status determined, and indicated in (L, M). Schematic of the fork degradation assay in p53 wildtype and p53 mutant HCC PDCs shown, to assess effects of HU (2 mM), ATRi (2 μM) and mirin (50 μM) on nascent DNA stability. IdU/CldU ratios for individual replication forks were calculated and mean of IdU/CldU ratios are represented in a heatmap, as well as in a scatterplot in (N). Representative of n = 3 independent experiments. In (A), (G), (J) and (N), mean of IdU/CldU ratios indicated by a horizontal red bar and P value was calculated from n ≥ 100 DNA fibers using Mann–Whitney test (P< 0.0001 ****).
Figure 2.
Figure 2.
RRM2B is a prime p53-dependent factor that determines nascent DNA resiliency. (A) (i) Schematic of the fork degradation assay in HCT116 parental (WT) cells transfected with siRNAs against the indicated DNA damage responsive genes and p53-regulated canonical target genes p21 and MDM2. Cells were treated with HU (2 mM) and ATR inhibitor (2 μM). Mean of IdU/CldU ratios represented in scatterplot and in (ii) heatmap. Controls (-ATRi) are included here and in Supplementary Figure S2A(ii) and A(iii). (B) Schematic of the fork degradation assay in HCT116 parental (WT) cells transfected with siRNAs against RRM2B (siRRM2B). Non-targeting (NT) siRNAs used as control. Histogram of IdU/CldU ratios of individual replication forks plotted in GraphPad Prism. Transfected cells were treated with HU (2 mM), and with or without ATRi (2 μM). Representative of three independent experiments. (C) Schematic of the fork degradation assay in HCT116 parental (WT) cells transfected with siRNAs targeting p53 or RRM2B. Cells were treated with HU (2 mM) and in the presence or absence of ATR inhibitor (2 μM). Representative of n = 3 independent experiments. (D) RRM2B transcript levels were quantified in HCT116 (WT) and p53KO cells transfected with siRNAs against RRM2B (siRRM2B) or NT siRNAs. (E) qPCR analysis of transcript levels of RRM2 in HCT116 parental (WT) cells transfected with siRNAs against RRM2 (siRRM2). (F) Schematic of the fork degradation assay in HCT116 parental (WT) cells transfected with siRNAs targeting RRM2. Treatment with HU (2 mM) in the presence or absence of ATR inhibitor (2 μM) as indicated. IdU/CldU ratios of individual replication forks were plotted. Experiment was repeated three times with similar results. (G) Immunoblots showing RRM2B, RRM2 and RRM1 protein levels in HCT116 parental (WT) and p53KO cells treated with HU (2 mM) and ATR inhibitor (2 μM) (6 h). DMSO-treated cells as control (Ctrl). Results are representative of n = 3. (H) Stable expression of pTRIPZ-RRM2B(DYK) in HCT116 parental (WT) and p53KO cells. EV represent empty pTRIPZ vector control. Induced expression of RRM2B-DYK achieved using doxycycline (1.5 μg/ml) treatment for 48 h. DYKDDDDK Tag antibody (CST, #2368) detects exogenous RRM2B(DYK) protein and anti-RRM2B antibody detects total RRM2B protein in immunoblots. Representative images of single DNA fibers. Scale bar, 50 μm. (I) Schematic of the fork degradation assay in HCT116 parental (WT) cells and isogenic p53KO cells overexpressing wildtype RRM2B (OE). Empty pTRIPZ vector used as control (EV). Treatment with HU (2 mM) in the presence or absence of ATR inhibitor (2 μM) as indicated. Scatterplot showing IdU/CldU ratios in individual experimental condition. In (A), (C), (F) and (I), mean of IdU/CldU ratios indicated by a red horizontal bar and P value was calculated from n ≥ 100 DNA fibers using Mann–Whitney test (P< 0.0001 ****; ns = not significant). qPCR or western blots in (G) and (H) were repeated independently at least three times with similar results.
Figure 3.
Figure 3.
p53/RRM2B loss results in hyperPARylation compromising nascent fork stability. (A) sip53 or siRRM2B-transfected HCT116 and U2OS parental cells were immunostained for total PAR (anti-PAR [10H] antibody, Abcam ab14459). Mean PAR intensity per nucleus was measured and plotted. Representative immunofluorescent images were shown (top). n ≥ 200 in each condition. Scale bar, 20 μm (mean ± SD; n = 3; two-tailed t-test). (B, C), Total cellular PARylation was analysed in whole cell lysates (WCL) harvested from sip53- or siRRM2B-transfected HCT116 cells. Total protein from WCL loaded on gel indicated in μg. (D)(i) HCT116 parental (WT) and p53KO cells were transfected with siPARP1 or non-targeting (NT) siRNAs. Western blot showing knockdown of PARP1 in HCT116 parental (WT) cells and p53KO cells. (ii) siRNA-transfected cells were immunostained using anti-PAR [10H] antibody (Abcam ab14459). Mean PAR intensity per nucleus was measured and plotted. n ≥ 200 in each condition. (mean ± SD; n = 3; two-tailed t-test). (E) Mean PAR intensity per nucleus was measured in HCT116 parental (WT) and p53KO cells with stable expression of pTRIPZ-RRM2B(WT). EV represent pTRIPZ empty vector control. Induced expression of RRM2B(WT) achieved using doxycycline (1.5 μg/ml, 48 h). n ≥ 200 in each condition (mean ± SD; n = 3; two-tailed t-test). (F) HCT116 parental (WT) and p53KO cells with stable expression of pTRIPZ-RRM2B(WT) or pTRIPZ-empty vector (EV) were subjected to western blot analysis of total PAR (anti-PAR [10H] antibody, Abcam ab14459). Overexpression of RRM2B was verified using anti-RRM2B antibody. Total protein from WCL loaded on gel indicated in μg. (G) Schematic of the fork degradation assay in HCT116 parental (WT) cells and p53KO cells pretreated with PARPi (50 μM). HU (2 mM) in the presence or absence of ATRi (2 μM) were used as indicated. IdU/CIdU ratios for individual replication forks plotted. Representative of n = 3 experiments. (H) Colony forming assay was performed on HCT116 parental (WT) and p53KO cells following treatment with HU (2 mM)/ATRi (2 μM) ± PARPi (50 μM) for 24 h before recovery in fresh media for eight days. Experiment is repeated independently at least three times with similar results. (I) Schematic of the fork degradation assay in HCT116 parental (WT) cells and p53KO cells transfected with pooled targeted siRNAs against PARP1. Cells were subjected to 2 mM HU treatment in the presence or absence of ATRi (2 μM), as indicated. IdU/CIdU ratios for individual replication forks plotted. Representative of n = 3 experiments. (J) Schematic of the fork degradation assay in HCT116 parental (WT) cells and p53KO cells pretreated with PARG inhibitor (0.6 μM). Cells were subjected to 2 mM HU treatment in the presence or absence of ATRi (2 μM), as indicated. IdU/CIdU ratios for individual replication forks plotted. Representative of n = 3 experiments. (K) Schematic of the fork degradation assay in HCT116 parental (WT) cells and p53KO cells pretreated with NAD (1 mM) or FK866 (1 μM). Cells were then subjected to 2 mM HU treatment in the presence or absence of ATRi (2 μM), as indicated. IdU/CIdU ratios for individual replication forks plotted. Representative of n = 3 experiments. (L) Schematic of the fork degradation assay in hepatocellular carcinoma (HCC) patient-derived cells. Cells were pretreated with PARPi (50 μM) or PARGi (0.6 μM) as indicated, followed by HU (2 mM) and ATR inhibitor (2 μM). Mean of IdU/CldU ratios shown in heatmap. IdU/CIdU ratios for individual replication forks plotted. Representative of n = 3 experiments. In (G), (I), (J), (K) and (L), results are representative of at least n = 3 independent experiments. Mean of IdU/CldU ratios indicated by a red horizontal bar and P value was calculated from n ≥ 100 DNA fibers using Mann–Whitney test (P< 0.0001 ****; ns = not significant). Western blots in (B), (C), (D) and (F), were repeated independently at least three times with similar results.
Figure 4.
Figure 4.
Oxidative stress induced hyper-PARylation underpins fork degradation in RRM2B/p53-deficient cells. (A), Single-cell dual IF analysis was performed using anti-PAR [10H] (Abcam, ab14459) and anti-γH2AX (Abcam, ab2893) antibodies. Mean γH2AX and PAR intensities per nucleus were quantified. Percentages of cells positively stained for γH2AX and PAR as indicated, in untreated HCT116 cells (WT) and p53KO cells, and in mitoxantrone-treated HCT116 cells (WT) cells (1.25 μM, 6 h). Bottom right panel: Mean PAR intensity per nucleus in HCT116 cells (WT) and p53KO were represented in a scatterplot. Representative of n = 3 independent experiments and n ≥ 200 in each condition. (B) Mean H2DCFDA (2′,7′-dichlorofluorescin diacetate) (Invitrogen, D399) intensity per nucleus of sip53 or siRRM2B-transfected HCT116 parental (WT) cells quantified and plotted. Representative images shown. Scale bar, 20 μm (mean ± SD; n = 3; two-tailed t-test). (C) MitoSOX/Mitotracker ratios were quantified in sip53 or siRRM2B-transfected HCT116 parental (WT) cells and plotted. Representative images on the left of the graph. Scale bar, 20 μm (mean ± SD; n = 3; two-tailed t-test). (D) Total PARylation was detected by immunofluorescence using anti-PAR antibody (Abcam, ab14459) in HCT116 WT and p53KOcells following treatment with Tempo (1 mM) or Trolox (0.2 mM). Mean PAR intensity per nucleus was measured and plotted. Representative images shown. Scale bar, 20 μm (mean ± SD; n = 3; two-tailed t-test). (E) Total cellular PARylation in siRRM2B- or (F) sip53-transfected HCT116 parental (WT) cells were treated with Trolox (0.2 mM) or Tempo (1 mM) and analysed by western blot. (G) Schematic of the fork degradation assay in HCT116 parental (WT) transfected with sip53 or siRRM2B and pretreated with Tempo (1 mM) or Trolox (0.2 mM). Cells were subjected to HU (2 mM) in the presence or absence of ATRi (2 μM). IdU/CIdU ratios for individual replication forks plotted. Representative of n = 3 experiments. (H) Schematic diagram illustrating oxidative stress induced PARylation as key factors influencing the stability of nascent DNA at stalled deprotected forks. (I, J) HCT116 cells (WT) cells were treated with an oxidative stress inducer, menadione, at the indicated concentrations for 12 h. Mean H2DCFDA (Invitrogen, D399) intensity per nucleus quantified and plotted in (I), and total cellular PARylation was analysed in western blot using an anti-PAR antibody (CST, 83732). γH2AX (Abcam, ab2893) was also detected as a surrogate marker of DNA damage. PAR levels were quantified (mean ± SD; n = 3; two-tailed t-test). (K) Schematic of the fork degradation assay in HCT116 parental (WT) and p53KO cells pre-treated with menadione, and then subjected to HU (2 mM) in the presence or absence of ATRi (2 μM). IdU/CIdU ratios for individual replication forks plotted. Representative of n = 3 experiments. (L) Schematic of the fork degradation assay in HCT116 parental (WT) cells pre-treated or not with menadione. Cells were then subjected to treatment with HU (2 mM) and ATRi (2 μM), and in the presence or absence of olaparib (50 μM). IdU/CIdU ratios for individual replication forks plotted. Representative of n = 3 experiments. (M) pTRIPZ-RRM2B(Q127K) and pTRIPZ-RRM2B (Y331F) were stably expressed in HCT116 parental (WT) and p53KO cells, under doxycycline induction (1.5 μg/ml, 48 h). Total PARylation was analysed in western blot using an anti-PAR antibody (CST, 83732). (N) Schematic of the fork degradation assay in HCT116 parental (WT) and p53KO cells overexpressing WT RRM2B, RRM2B(Q127K) or RRM2B(Y331F). pTRIPZ-EV (empty vector) included as control. Cells were treated with doxycycline (Doxy) (1.5 μg/ml, 48 h) prior to the fork degradation experiment. IdU/CIdU ratios for individual replication forks plotted. Representative of n = 3 experiments. In (G), (K), (L) and (N), red horizontal bar represent mean of CldU/IdU ratios; P value was calculated from n ≥ 100 DNA fibers using Mann–Whitney test (P< 0.0001 ****; ns = not significant). Data representative of n = 3 independent experiments. Western blots in (E), (F), (J) and (M) were repeated independently at least three times with similar results. GAPDH or HSP90 were used as loading control.
Figure 5.
Figure 5.
A NRF2-PARP1 axis connects redox homeostasis to replication fork integrity. (A) Heatmap showing the Pearson correlation coefficient (r value) of RRM2B gene expression (log2 normalized) against an antioxidant gene signature for 12 TCGA transcriptome datasets (STAD: Stomach Adenocarcinoma; PRAD: Prostate Adenocarcinoma; BRCA: Breast Invasive Carcinoma; PAAD: Pancreatic Adenocarcinoma; UCS: Uterine Carcinosarcoma; SARC: Sarcoma; ESCA: Oesophageal Carcinoma; SKCM: Skin Cutaneous Melanoma; KIRC: Kidney Renal Clear Cell Carcinoma; KICH: Kidney Chromophobe; HNSC: Head and Neck Squamous Cell Carcinoma; OV: Ovarian Carcinoma). A negative r value indicates that the variables tested are inversely related. All results are significant at P< 0.0001. (B), The Pearson correlation coefficients of the expression of each gene in the antioxidant gene signature (log2 normalized, 125 genes) against RRM2B expression (log2 normalized) were calculated across 12 TCGA datasets (as described in A). Tumor samples n = 4964. A hierarchical heatmap was constructed to depict the Pearson correlation coefficient (r value). All results achieved significance at P< 0.001. (C) Genes are clustered in (D), according to their Pearson correlation coefficient (r value). STRING enrichment analysis (WikiPathways) of genes identified in cluster III in (B) sorted by enrichment strength, Log10(observed/expected), with false discovery rate and observed gene count indicated. Similar gene enrichment analysis was performed using a p53 gene signature instead of RRM2B gene expression (Supplementary Table S3). (D) Pearson correlation coefficient (r value) between RRM2B gene expression and p53 gene signature score that predicts for wildtype p53 functionality were calculated across 12 TCGA transcriptome datasets used in (A) and (B) (tumor samples n = 4964). (E) Venn diagram showing overlap of antioxidant genes that are enriched with reduced RRM2B gene expression or reduced p53 gene signature score, identified by their Pearson correlation coefficient (r value). Pearson correlation coefficient of r←0.1 (P< 0.001) was used as a cut-off. Four NRF2 target antioxidant genes are commonly enriched (G6PD, PRDX1, PRDX6 and TXN1). (F) Schematic of the fork degradation assay in HCT116 parental (WT) and p53KO cells pretreated with an NRF2 inhibitor, ML385 (30 μM, 48 h). Cells were subjected to HU (2 mM) in the presence of ATRi (2 μM). IdU/CIdU ratios for individual replication forks plotted. Representative of n = 3 experiments. (G) Schematic of the fork degradation assay in HCT116 parental (WT) and p53KO cells transfected with NRF2-targeted siRNAs. Cells were subjected to HU (2 mM) in the presence of ATRi (2 μM). IdU/CIdU ratios for individual replication forks plotted. Representative of n = 3 experiments. (H) Schematic of the fork degradation assay in HCT116 parental (WT) stably transfected with shp53 or empty vector (EV) control. As in (G), cells were transfected with NRF2-targeted siRNAs. Cells were subjected to HU (2 mM) in the presence of ATRi (2 μM). IdU/CIdU ratios for individual replication forks plotted. Representative of n = 3 experiments. (I) Total PARylation in HCT116 (WT) and p53KO cells transfected with NRF2-targeted siRNAs was analysed by western blot using an anti-PAR antibody (CST, 83732). Total PARP1, NRF2, G6PD and p53 protein expression was also detected in immunoblots. GAPDH was used as a loading control. (J) HCT116 parental (WT) cells transfected with siNRF2 were immunostained for total PAR (anti-PAR [10H] antibody, Abcam ab14459). Mean PAR intensity per nucleus were quantified and plotted. n ≥ 200 in each condition (mean ± SD; n = 3; two-tailed t-test). (K) HCT116 parental (WT) cells were treated with dimethyl fumarate (DMF, NRF2 activator) at 10 or 30 μM for 12 h. Total PARylation, G6PD and γH2AX protein expression analysed by western blot. GAPDH used as a loading control. (L) Schematic of the fork degradation assay in HCT116 parental (WT) and p53KO cells pretreated with Dimethyl Fumarate (DMF) (10 or 30 μM, 12 h). Cells were subjected to HU (2 mM) in the presence or absence of ATRi (2 μM). IdU/CIdU ratios for individual replication forks plotted. Representative of n = 3 experiments. In (F), (G), (H) and (l) red horizontal bar represents mean of CldU/IdU ratios; P value was calculated from n ≥ 100 DNA fibers using Mann–Whitney test (P< 0.0001 ****; ns = not significant). Data Representative of n = 3 independent experiments. Western blots in (I) and (J) were repeated independently at least three times with similar results. GAPDH was used as loading control.
Figure 6.
Figure 6.
NRF2-dependent G6PD activation underlies the replication vulnerability in p53/RRM2-deficient cells. (A) HCT116 (WT) cells transfected with siRRM2B. G6PD protein expression analysed in whole cell lysates by western blot. Representative of n = 3 experiments. (B) siRRM2B or non-targeting (NT) siRNA-transfected HCT116 (WT) cells were treated with antioxidants, Trolox (0.2 mM) or Tempo (1 mM) for 12 h. Total G6PD protein was detected using western blot. Ratios of G6PD to HSP90 (loading control) were calculated and plotted (mean ± SD; n = 3; two-tailed t-test). (C) Scatterplot showing normalized (log2) gene expression values of RRM2B and G6PD expression in aggregated 12 TCGA databases (tumor samples n = 4964) represented in Figure 5A. Pearson correlation coefficient indicated, r = –0.3081, P< 0.001. (D) Parental HCT116 (WT) cells were transfected with siRRM2B and/or siG6PD. Total PARylation detected using an anti-PAR antibody (CST, 83732). Specific knockdown of RRM2B and G6PD validated by western blot. (E) HCT116 (WT) and p53KO cells were transfected with siG6PD. Total PARylation detected by western blot using an anti-PAR antibody (CST, 83732). (F) Immunostaining for PAR (Abcam ab14459) was performed in HCT116 (WT) and isogenic p53KO cells transfected with siG6PD, or in HCT116 cells stably transfected with short hairpin RNA against p53 (shp53) or empty vector (EV) as control. Mean PAR intensity per nucleus was quantified and plotted (mean ± SD; n = 3; two-tailed t-test). (G) Schematic of the fork degradation assay in HCT116 parental (WT) cells transfected with siRRM2B and treated with G6PDi (20 μM, 12 h). Cells were subjected to HU (2 mM) in the presence or absence of ATRi (2 μM). IdU/CIdU ratios for individual replication forks plotted. Representative of n = 3 experiments. (H) Schematic of the fork degradation assay in HCT116 parental (WT) and isogenic p53KO cells pre-treated with G6PDi (10 or 20 μM, 12 h). Cells were subjected to HU (2 mM) in the presence or absence of ATRi (2 μM). IdU/CIdU ratios for individual replication forks plotted. Representative of n = 3 experiments. (I) Schematic of the fork degradation assay in HCT116 parental (WT) cells and isogenic p53KO cells transfected with G6PD-targeted siRNAs, or in HCT116 (WT) cells harboring shp53 or empty vector (EV) control transfected with G6PD-targeted siRNAs. IdU/CIdU ratios for individual replication forks plotted. Representative of n = 3 experiments. (J) Total PARylation in HCT116 (WT) cells treated with a selective G6PD activator (AG1) (10 or 20 μM, 12 h) was detected using an anti-PAR [10H] antibody (Abcam ab14459). PARP1 and γH2AX were also detected in immunoblots. (K) Stable expression of pTRIPZ-G6PD and pTRIPZ-EV (empty vector) in HCT116 parental (WT) cells. Total PARylation detected using an anti-PAR antibody (CST, 83732) in western blot. Total PARP1, G6PD and γH2AX proteins were detected. (L) Mean H2DCFDA intensities per nucleus were quantified and plotted in HCT116 cells pre-treated with specific G6PD inducer AG1 (10 or 20 μM, 12 h), or in HCT116 (WT) cells stably expressing pTRIPZ-G6PD(WT)-DYK and pTRIPZ-EV (empty vector). (M) NAD levels were measured in HCT116 (WT) cells stably expressing pTRIPZ-G6PD(WT)-DYK or pTRIPZ-EV (control) and treated with FK866 (1 μM, 12 h) (mean ± SD; n = 3; two-tailed t-test). (N) NAD levels were measured in HCT116 (WT) cells stably expressing pTRIPZ-G6PD(WT)-DYK or pTRIPZ-G6PD(K171Q)-DYK. pTRIPZ-EV included as control (mean ± SD; n = 3; two-tailed t-test). (O) Total PARylation in HCT116 (WT) cells stably expressing pTRIPZ-G6PD(WT)-DYK, pTRIPZ-G6PD(K171Q)-DYK or pTRIPZ-EV detected using an anti-PAR antibody (CST, 83732). Induced expression of G6PD(WT)-DYK or G6PD(K171Q)-DYK was achieved by doxycycline (1.5 μg/ml, 48 h) and detected using an DYKDDDDK Tag antibody (CST, #2368) by western blot. Total G6PD was also detected using an anti-G6PD antibody. (P) Schematic of the fork degradation assay in HCT116 parental (WT) cells and isogenic p53KO cells pretreated with AG1 at the indicated concentrations. Cells were then exposed to HU (2 mM) and ATRi (2 μM). IdU/CIdU ratios for individual replication forks plotted. Representative of n = 3 experiments. (Q) Schematic of the fork degradation assay in HCT116 parental (WT) cells stably expressing pTRIPZ-G6PD or pTRIPZ-EV (empty vector). G6PD(WT)-DYK was induced by doxycycline (1.5 μg/ml, 48 h). Cells were then exposed to HU (2 mM) in the presence or absence of ATRi (2 μM). IdU/CIdU ratios for individual replication forks plotted. Representative of n = 3 experiments. (R) Schematic of the fork degradation assay in parental (WT) cells stably expressing pTRIPZ-G6PD(WT)-DYK, pTRIPZ-G6PD(K171Q)-DYK or pTRIPZ-EV (empty vector). Cells were treated with doxycycline (1.5 μg/ml, 48 h) and then exposed to HU (2 mM) and ATRi (2 μM). IdU/CIdU ratios for individual replication forks plotted. Representative of n = 3 experiments. (S) Percentages of cells with micronuclei were quantified in HCT116 parental (WT) cells stably expressing G6PD(WT)-DYK or pTRIPZ-EV (empty vector). Cells were treated with doxycycline (1.5 μg/ml, 48 h), followed by gemcitabine (0.2 or 0.4 μM, 24 h). Cells were recovered in fresh media for 48 h before micronuclei were assessed by DAPI staining and immunofluorescence. (T) As in s, Percentages of cells with micronuclei were quantified in HCT116 parental (WT) cells stably expressing G6PD(WT)-DYK or pTRIPZ-EV (empty vector) and drugged with gemcitabine (0.4 μM) in the presence or absence of olaparib (PARPi, 50 μM) for 24 h. Cells were recovered in fresh media for 48 h before micronuclei were assessed by DAPI staining. In (S) and (T), P value was calculated by Mann–Whitney test (P< 0.0001 ****; ns = not significant; n = 3). In (G), (H), (I), (P), (Q) and (R), red horizontal bar represent mean of CldU/IdU ratios; P value was calculated from n ≥ 100 DNA fibers using Mann–Whitney test (P< 0.0001 ****; ns = not significant). Western blots in (A), (B), (D), (E), (J), (K) and (O) were repeated independently at least three times with similar results. GAPDH or HSP90 were used as loading controls.
Figure 7.
Figure 7.
p53/RRM2B deficiency promotes the activation of NRF2-PARP1 axis and fork degradation. (A) The diagram illustrates a conceptual model wherein mild oxidative stress induced by the loss of p53/RRM2B triggers the activation of PARP1 through the Pentose Phosphate Pathway (PPP). Sustained PARP1 activation confers replication forks vulnerabilities that drive replication catastrophe and subsequent lethality in the absence of functional p53 or RRM2B. This distinguishes from acute and excessive oxidative stress generated by a variety of pathological conditions, driving DNA damage and PARP1 activation. (B) A proposed model providing a mechanistic insight into the activation of NRF2/G6PD in the absence of p53/RRM2B, specifically in response to mild reactive oxygen species (ROS). This activation leads to an enhanced production of NAD+ through the salvage pathway. The augmented NAD+ levels subsequently trigger PARP1 activation, which, in turn, instigates unscheduled degradation of replication forks at deprotected stalled sites induced by ATR inhibition. ATR inhibition induces unscheduled origin firing which potentially results in an exhaustion of RPA in cells and deprotection of stalled forks, rendering them susceptible to fork degradation induced by hyperPARylation.

References

    1. Yeeles J.T., Poli J., Marians K.J., Pasero P.. Rescuing stalled or damaged replication forks. Cold Spring Harb. Perspect. Biol. 2013; 5:a012815. - PMC - PubMed
    1. Berti M., Cortez D., Lopes M.. The plasticity of DNA replication forks in response to clinically relevant genotoxic stress. Nat. Rev. Mol. Cell Biol. 2020; 21:633–651. - PubMed
    1. Cimprich K.A., Cortez D.. ATR: an essential regulator of genome integrity. Nat. Rev. Mol. Cell Biol. 2008; 9:616–627. - PMC - PubMed
    1. Casper A.M., Nghiem P., Arlt M.F., Glover T.W.. ATR regulates fragile site stability. Cell. 2002; 111:779–789. - PubMed
    1. Cortez D., Guntuku S., Qin J., Elledge S.J.. ATR and ATRIP: partners in checkpoint signaling. Science. 2001; 294:1713–1716. - PubMed

Grants and funding