. 2024 Sep 24:13:e85601.
doi: 10.7554/eLife.85601.

Time-resolved proximity proteomics uncovers a membrane tension-sensitive caveolin-1 interactome at the rear of migrating cells

Affiliations

Time-resolved proximity proteomics uncovers a membrane tension-sensitive caveolin-1 interactome at the rear of migrating cells

Eleanor Martin et al. Elife. .

Abstract

Caveolae are small membrane pits with fundamental roles in mechanotransduction. Several studies have shown that caveolae flatten out in response to increased membrane tension, thereby acting as a mechanosensitive membrane reservoir that buffers acute mechanical stress. Caveolae have also been implicated in the control of RhoA/ROCK-mediated actomyosin contractility at the rear of migrating cells. However, how membrane tension controls the organisation of caveolae and their role in mechanotransduction remains unclear. To address this, we systematically quantified protein-protein interactions of caveolin-1 in migrating RPE1 cells at steady state and in response to an acute increase in membrane tension using biotin-based proximity labelling and quantitative mass spectrometry. Our data show that caveolae are highly enriched at the rear of migrating RPE1 cells and that membrane tension rapidly and reversibly disrupts the caveolar protein coat. Membrane tension also detaches caveolin-1 from focal adhesion proteins and several mechanosensitive regulators of cortical actin including filamins and cortactin. In addition, we present evidence that ROCK and the RhoGAP ARHGAP29 associate with caveolin-1 in a manner dependent on membrane tension, with ARHGAP29 influencing caveolin-1 Y14 phosphorylation, caveolae rear localisation, and RPE1 cell migration. Taken together, our work uncovers a membrane tension-sensitive coupling between caveolae and the rear-localised F-actin cytoskeleton. This provides a framework for dissecting the molecular mechanisms underlying caveolae-regulated mechanotransduction pathways.

Keywords: APEX2; caveolae; caveolin-1; cavin; cell biology; cell migration; human; mechanobiology; membrane tension; proximity proteomics.


Conflict of interest statement

EM, RG, GD, AL No competing interests declared

Figures

Figure 1.
Figure 1.. Dynamics of caveolae at the rear of migrating RPE1 cells.
(A) RPE1 cells were fixed and stained with anti-Cav1 antibodies. The rear localisation index (fold enrichment at the rear) was determined by measuring the Cav1 intensity at the cell front and the cell rear (n = 36 cells). Scale bar 10 µm. (B) Pearson’s correlation analysis of fixed RPE1 cells stably expressing cavin1-A2E stained with anti-Cav1 antibodies. (C) Time-lapse images of RPE1 cells stably transfected with Cavin1-A2E migrating on a glass coverslip. The front-rear distribution of Cavin1-A2E in each frame of the movie was measured using line scans. The mean localisation was plotted. Error bars indicate SEM. Scale bar 10 µm. (D) Time-lapse images of RPE1 cells stably transfected with Cavin3-miniSOG-mCherry migrating on a glass coverslip. The front-rear distribution of Cavin3 in each frame of the movie was measured using line scans. The mean localisation was plotted. Error bars indicate SEM. Scale bar 10µm. (E) Time-lapse images of RPE1 cells stably transfected with cavin3-miniSOG-mCherry migrating on in a collagen matrix. Scale bar 5 µm. (F) Time-lapse images of RPE1 cells stably transfected with cavin3-miniSOG-mCherry showing a sudden rear retraction. Scale bar 10µm. (G) Temporal relationship between front protrusion, rear retraction, and cell area of the cell shown in (F). (G) Temporal relationship between front protrusion, rear retraction, and aspect ratio (cell shape) of the cell shown in (F).
Figure 1—figure supplement 1.
Figure 1—figure supplement 1.. Characterisation of caveolae rear localisation in RPE1 cells.
(A) RPE1 cells stably transfected with cavin1-A2E were fixed and stained with anti-Cav1 antibody. Note the colocalisation of Cav1 and cavin1 at the rear (arrows). The Golgi apparatus (*) is stained with anti-Cav1 antibody but not the cavin1 fusion protein. (B) Quantification of cavin1 rear localisation in fixed cells. A representative confocal image of cavin1-A2E stably expressed in RPE1 cells is shown. The front-rear distribution of cavin1-A2E was measured in 30 individual cells using line scans. In addition, the rear localisation index (fold enrichment at the rear) was determined by measuring the cavin1 intensity at the cell front and the cell rear (n = 30 cells). (C) Time-lapse images of RPE1 cells stably transfected with Cavin3-miniSOG-mCherry migrating on a glass coverslip. The front-rear distribution of Cavin3 in each frame of the movie was measured using line scans. The mean localisation was plotted. Error bars indicate SEM. (D) Time-lapse images of RPE1 cells stably transfected with cavin3-miniSOG-mCherry showing a sudden rear retraction. (E) Temporal relationship between front protrusion, rear retraction, and cell area of the cell shown in (D). (F) Temporal relationship between front protrusion, rear retraction, and aspect ratio (cell shape) of the cell shown in (D). Scale bars 10 µm.
Figure 1—figure supplement 2.
Figure 1—figure supplement 2.. Caveolae become transiently aligned along the front/rear axis in migrating RPE1 cells.
(A) Time-lapse images of RPE1 cells stably transfected with Cavin3-miniSOG-mCherry. The movie starts with an unpolarised cell state. Cavin3 becomes aligned in ‘stripes’ as the cell establishes a front and a rear (small arrows). A sudden rear retraction at 200 min is accompanied with an accumulation of cavin3 at the rear (large arrowheads). The cell then starts to migrate. (B) Time-lapse images showing the alignment of cavin3 in ‘filamentous stripes’ (small arrows) in a migrating RPE1 cell. Scale bars 10 µm.
Figure 2.
Figure 2.. Electron tomography of caveolae at the RPE1 cell rear.
(A) Electron tomography of caveolae and caveolar networks at the rear of RPE1 cells stably transfected with Cavin3-miniSOG-mCherry. Two slices of the tomogram are shown. Note that individual caveolae are interconnected. (B) 3D surface model of the tomogram shown in (A), showing interconnected clusters, or rosettes, of caveolae. Scale bar in (A) and (B) is 100 nm.
Figure 3.
Figure 3.. Proximity labelling of caveolae in RPE1 cells stably expressing Cav1-APEX2-EGFP.
(A) Western blot of stable RPE1 cell lines expressing either Cav1-A2E or NES-A2E fusion proteins. The membrane was probed with anti-Cav1 antibodies. (B) Confocal fluorescence microscopy of Cav1-A2E RPE1 cells stained with anti-PTRF/cavin1 antibodies. Boxed regions are magnified in the bottom panel. Nuclei were counterstained with DAPI. Scale bar 10 µm. (C) Transmitted light image of Cav1-A2E RPE1 cells after APEX2 labelling and plastic embedding (left) and correlative TEM image of the same cell (right). (D) Representative TEM micrographs of serial TEM sections of the cell shown in (C) (boxed regions). Note the specific labelling and abundance of caveolae at the cell rear. (E) Cav1-A2E-expressing cells were incubated in the absence or presence of biotin phenol and/or hydrogen peroxide. Cell lysates were separated by SDS-PAGE, blotted onto PVDF membrane, and probed with streptavidin-HRP. (F) Confocal microscopy of Cav1-A2E RPE1 cells after proximity labelling with APEX2. Cells were fixed and stained with fluorescent streptavidin (Alexa Fluor 555) to visualise biotinylated proteins. Nuclei were counterstained with DAPI. Scale bar 10 µm.
Figure 3—figure supplement 1.
Figure 3—figure supplement 1.. Characterisation of the Cav1-A2E RPE1 cell lines.
(A) RPE1 cells stably transfected with Cav1-A2E were fixed and stained with anti-cavin1 antibodies. Note the pronounced colocalisation and the enrichment of Cav1-A2E and cavin1 at the cell rear. Note that cavin1, but not Cav1, is found in the nucleus (circle). Scale bar 10 µm. (B) Time-lapse images of RPE1 cells stably transfected with Cav1-A2E migrating on a glass coverslip. The front-rear distribution of Cav1-A2E in each frame of the movie was measured using line scans. The mean localisation was plotted. Error bars indicate SEM. Scale bar 10 µm. (C) Western blot analysis of protein lysates from RPE1 cells stably expressing Cav1-A2E or NES-A2E fusion proteins. The membrane was probed with anti-GFP antibodies. (D) Representative immunofluorescence stainings of Cav1-A2E RPE1 cells at isotonic (NT) and hypotonic (HYPO) conditions, and after recovery from hypo-osmotic shock (REC). Cells were co-stained with anti-PTRF/cavin1 antibodies. Scale bar 20 µm. (E) H2O2 ramp of NES-A2E-expressing RPE1 cells pre-incubated for 30 min with 0.5 mM biotin phenol. Increasing concentrations of H2O2 were used during the biotinylation reaction to determine the optimal H2O2 concentration for further experiments. (F) Confocal microscopy of NES-A2E cells after proximity labelling with APEX2. Cells were fixed and stained with fluorescent streptavidin (Alexa Fluor 555) to visualise biotinylated proteins. Nuclei were counterstained with DAPI. Scale bar 20 µm.
Figure 4.
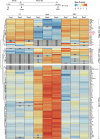
Figure 4.. The caveolin-1 interactome is enriched in cortical actin regulators and focal adhesion proteins and is highly sensitive to membrane tension.
(A) Experimental set-up used for APEX2-mediated proximity biotinylation and LC-MS/MS. After proximity labelling, cells were lysed and biotinylated proteins were captured using magnetic streptavidin beads. Purified proteins were on bead-digested with trypsin and the recovered peptides analysed by LC-MS/MS. Three individual replicates were analysed. (B) Diagram summarising the LC-MS/MS analysis and the total number of proteins significantly enriched in each treatment compared to the NES control. Only proteins identified in all three replicates in at least one of the three samples were considered for further analysis. Label-free quantification (LFQ) was used to define specific Cav1 interactomes and to determine quantitative changes upon hypo-osmotic shock and recovery. (C) Volcano plots showing proteins significantly enriched in NT, HYPO, and REC samples compared to the NES control sample. Only proteins with a p-value <0.05 and a logFC > 0 were considered for further analysis. (D) Volcano plots comparing the NT and REC, NT and HYPO, and REC and HYPO samples. Cav1-A2E fusion protein and the core caveolar proteins are highlighted. (E) Heatmap of z-scored LFQ quantified protein groups differentially enriched across the treatments. NA indicates not identified. See Figure 3—figure supplement 1 for a complete analysis. (F) Z-scores of caveolar proteins under NT, HYPO and REC conditions. (G) Gene Ontology (GO) Cellular Component analysis for proteins enriched under NT and REC conditions (see E). (H) PPI network of the Cav1 proximity proteome. Only proteins significantly enriched in both the NT and REC samples were considered (i.e., 26 co-recovered proteins). Solid lines indicate interactions retrieved from databases (BioGRID, Reactome, BioCarta), dotted lines indicate interactions retrieved from a hand-curated literature search (see Supplementary file 2).
Figure 4—figure supplement 1.
Figure 4—figure supplement 1.. Quantitative proximity proteomics of Cav1-APEX2-EGFP in response to hypo-osmotic shock.
Heatmap of 111 z-scored LFQ quantified protein groups differentially enriched across the three treatments (non-treated [NT, control], hypo-osmotic shock [HYPO], and recovery from hypo-osmotic shock [REC]). All three replicates are shown. NA indicates not identified.
Figure 5.
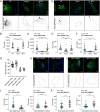
Figure 5.. Proximity ligation assays (PLA) reveal dynamic interactions between caveolae and the cortical actin cytoskeleton during changes in membrane tension.
(A–D) PLA in the Cav1-A2E RPE1 cell line using anti-GFP and anti-PTRF/cavin1 (A, B), anti-FLNA (C), or anti-CTTN (D) antibodies as indicated. (E, F) PLA in RPE1 cells transfected with EHD2-A2E using anti-GFP and anti-Cav1 antibodies. (G) Quantification of rear-localised PLA signals based on data shown in panels (A–F). (H–K) Effect of ROCK inhibition on PLA in the Cav1-A2E RPE1 cell line using the indicated combinations of antibodies. Cells were incubated for 5 min in hypo-osmotic medium containing 10 µM Y-27632 or DMSO (control) and then transferred to isotonic medium for 30 min in the absence (DMSO) or presence of Y-27632. The graphs in (B, C, D, F, J, K) show the quantifications of the PLA signals per cell. 30 cells from three independent experiments were quantified for each treatment. The number of PLA dots per cell is presented with the mean values ± SD. The bottom panels in (A, E, H, I) show the PLA signal masks used for counting. Statistical significance was calculated using a Wilcoxon test. ns = p>0.05, ***p≤0.001. All scale bars 20 µm.
Figure 5—figure supplement 1.
Figure 5—figure supplement 1.. Proximity ligation assays (PLA) in Cav1-A2E RPE1 cells using CTTN and FLNA antibodies.
(A, B) Representative images of PLA on Cav1-A2E-expressing RPE1 cells using anti-GFP antibodies and anti-FLNA (A) or anti-CTTN antibodies (B). (C) Control PLA of Cav1-A2E cells. Samples were probed only with anti-GFP primary antibody and both PLA probes. GFP and DAPI signals used to determine cell boundaries are shown in the upper panels in (A–C), while the bottom panels show the PLA signal masks used for counting. (D, E) Representative immunofluorescence images of fixed Cav1-A2E cells co-stained with anti-FLNA (D) or anti-CTTN antibodies (E). Scale bars 20 µm.
Figure 5—figure supplement 2.
Figure 5—figure supplement 2.. Proximity ligation assays (PLA) in Cav1-A2E RPE1 cells using ROCK1 and HSPB1 antibodies.
(A, B) Representative images of PLA on Cav1-A2E-expressing RPE1 cells using anti-GFP antibodies and anti-HSPB1 (A) or anti-ROCK1 antibodies (B). GFP and DAPI signals used to determine cell boundaries are shown in the upper panels in (A) and (B), while the bottom panels show the PLA signal masks used for counting. Scale bars 20 µm. (C) PLA quantification of the data shown in (A) and (B). (D) Pathway enrichment analysis of proteins that are significantly enriched in the REC and HYPO samples compared to NT. (E, F) Representative immunofluorescence images of fixed Cav1-A2E cells co-stained with anti-HSPB1 (E) or anti-ROCK1 antibodies (F). Scale bars 20 µm.
Figure 6.
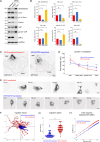
Figure 6.. Evidence for a functional connection between caveolae and ARHGAP29.
(A) RPE1 cells were transfected with siRNAs against ARHGAP29, caveolin-1, or non-targeting siRNAs and analysed by western blotting 48 hr post-transfection. (B) Quantification of western blot analysis shown in (A). Ratios normalised to the GAPDH loading control are displayed relative to the intensity of the control siRNA transfection for each protein indicated. Data represent the mean ± SD of 3–4 independent experiments. Statistical significance was calculated using an unpaired t-test. ns = p>0.05, *p≤0.05, **p≤0.01, ***p≤0.001. (C) RPE1 cells were transfected with A2E-ARHGAP29 or NES-A2E, fixed, and stained with anti-Cav1 antibodies. Scale bar 5 µm. (D) Quantification of Cav1 rear localisation based on data shown in (C). Error bars indicate mean ± SEM *p≤0.05, ***p≤0.001, Wilcoxon test (n = 18 cells per condition). (E) Still images of RPE1 cells transfected with NES-A2E (top) or A2E-ARHGAP29 (bottom) imaged live by spinning disk confocal microscopy. Scale bars 10 µm. (F–H) Migration tracks (F), migration speed (G), and mean squared displacement (H) of RPE1 cells transfected with A2E-ARHGAP29 or NES-A2E. Quantification was performed on three independent experiments and a total of ~60 cells per sample. Statistical significance in (G) was calculated using an unpaired t-test; ***p≤0.001.
Figure 6—figure supplement 1.
Figure 6—figure supplement 1.. Knockdown of Cav1 in RPE1 cells does not affect the transcription of YAP or YAP target genes.
qPCR analysis of control and caveolin-1 siRNA-transfected RPE1 cells. Data is derived from three independent technical replicates. Error bars indicate SEM. ***p≤0.001.
Figure 6—figure supplement 2.
Figure 6—figure supplement 2.. Overexpression and siRNA-mediated knockdown of ARHGAP29.
(A–D) Migration tracks (A), migration speed (B), displacement (C), and mean squared displacement (D) of RPE1 cells transfected with esiRNAs against ARHGAP29 or non-targeting esiRNAs. Quantification was performed on two independent experiments. (E) RPE1 cells transfected with A2E-ARHGAP29 were fixed and stained with anti-Cav1 antibodies and fluorescently labelled phalloidin (Alexa Fluor 555). Scale bar 10 µm. Note that cortical areas enriched in ARHGAP29 show reduced Cav1 signals. The fluorescence intensities of ARHGAP29 and Cav1 in such cortical areas were measured and normalised against the intensities on the whole cell level. The ARHGAP29/Cav1 ratio is plotted, showing an approximately threefold enrichment of ARHGAP29 over Cav1. (F) RPE1 cells transfected with A2E-ARHGAP29 were fixed and stained with anti-PTRF/cavin1 antibodies and fluorescently labelled phalloidin (Alexa Fluor 555). Asterisks (*) indicate two untransfected control cells. White arrowheads indicate enrichment of PTRF/cavin1 at the cell rear. Red arrowheads indicate actin and ARHGAP29 at the cell rear. Scale bar 10 µm. (G) 2D and 3D heat maps of two untransfected control cells (asterisks in A) and an A2E-ARHGAP29 transfected cells. White arrowheads indicate the position of the cell rear. Note the loss of PTRF/cavin1 enrichment at the cell rear in cells transfected with A2E-ARHGAP29.
Figure 7.
Figure 7.. Model of caveolae dynamics and function at the rear of migrating cells.
Low membrane tension promotes caveolae formation at the cell rear, whilst high membrane tension causes caveolae to flatten out, which is accompanied by the dissociation of cavin1/PTRF, EHD2, and Pacsin2 from membrane-embedded Cav1 scaffolds. The linkage between the cortical F-actin network and Cav1 scaffolds is also lost at high membrane tension. Caveolae or Cav1 scaffolds promote RhoA/ROCK signalling, MLC phosphorylation, and cell rear retraction, possibly by recruiting the RhoGEF Ect2 and ROCK to the cell rear. ARHGAP29 may be recruited to the cell rear at low membrane tension to suppress RhoA signalling, leading to reduced Cav1 Y14 phosphorylation, increased membrane tension, and caveolae flattening.

Update of

  • doi: 10.1101/2022.12.13.520222

References

    1. Baldassarre M, Razinia Z, Burande CF, Lamsoul I, Lutz PG, Calderwood DA. Filamins regulate cell spreading and initiation of cell migration. PLOS ONE. 2009;4:e7830. doi: 10.1371/journal.pone.0007830. - DOI - PMC - PubMed
    1. Bisaria A, Hayer A, Garbett D, Cohen D, Meyer T. Membrane-proximal F-actin restricts local membrane protrusions and directs cell migration. Science. 2020;368:1205–1210. doi: 10.1126/science.aay7794. - DOI - PMC - PubMed
    1. Bravo-Cordero JJ, Magalhaes MAO, Eddy RJ, Hodgson L, Condeelis J. Functions of cofilin in cell locomotion and invasion. Nature Reviews. Molecular Cell Biology. 2013;14:405–415. doi: 10.1038/nrm3609. - DOI - PMC - PubMed
    1. Chai Q, Wang XL, Zeldin DC, Lee HC. Role of caveolae in shear stress-mediated endothelium-dependent dilation in coronary arteries. Cardiovascular Research. 2013;100:151–159. doi: 10.1093/cvr/cvt157. - DOI - PMC - PubMed
    1. Cheng JPX, Mendoza-Topaz C, Howard G, Chadwick J, Shvets E, Cowburn AS, Dunmore BJ, Crosby A, Morrell NW, Nichols BJ. Caveolae protect endothelial cells from membrane rupture during increased cardiac output. The Journal of Cell Biology. 2015;211:53–61. doi: 10.1083/jcb.201504042. - DOI - PMC - PubMed