

Host population structure and species resolution reveal prophage transmission dynamics
- PMID: 39315801
- PMCID: PMC11481511
- DOI: 10.1128/mbio.02377-24
Host population structure and species resolution reveal prophage transmission dynamics
Abstract
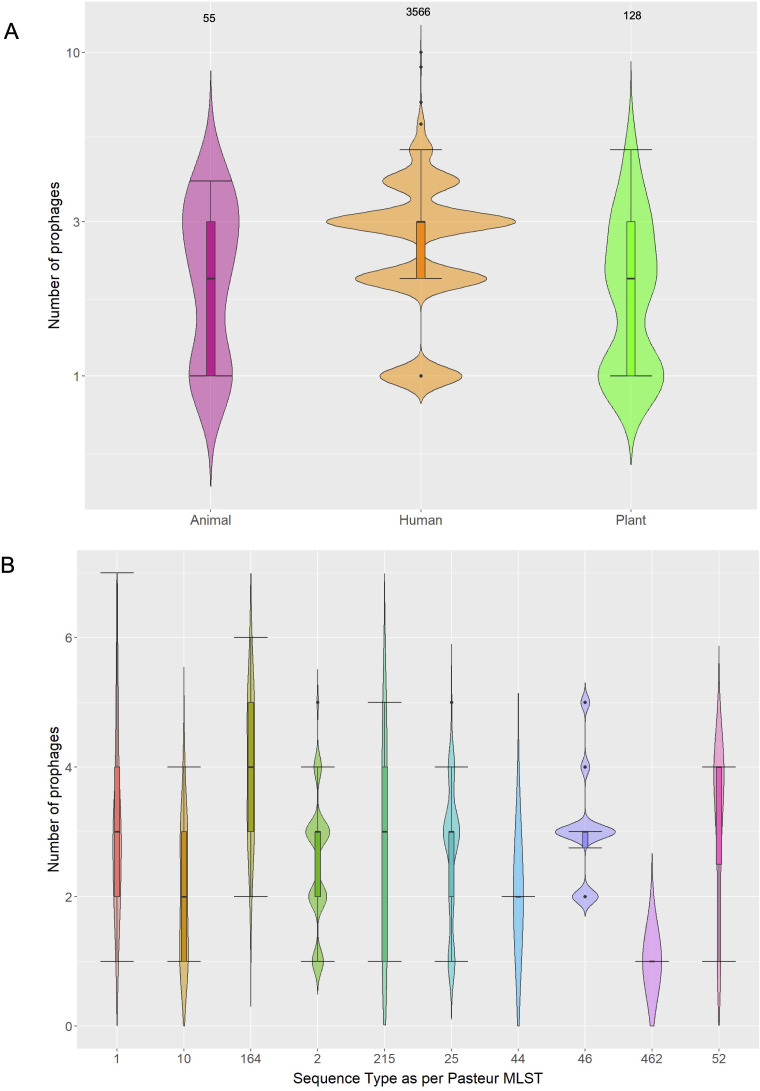
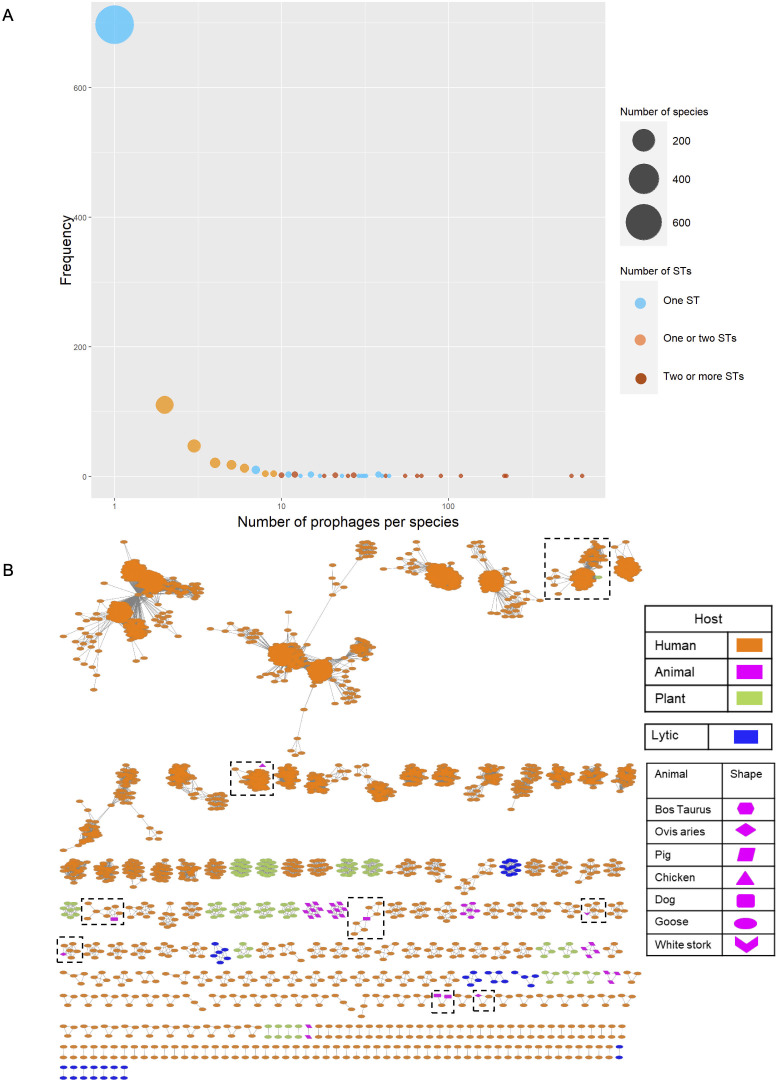
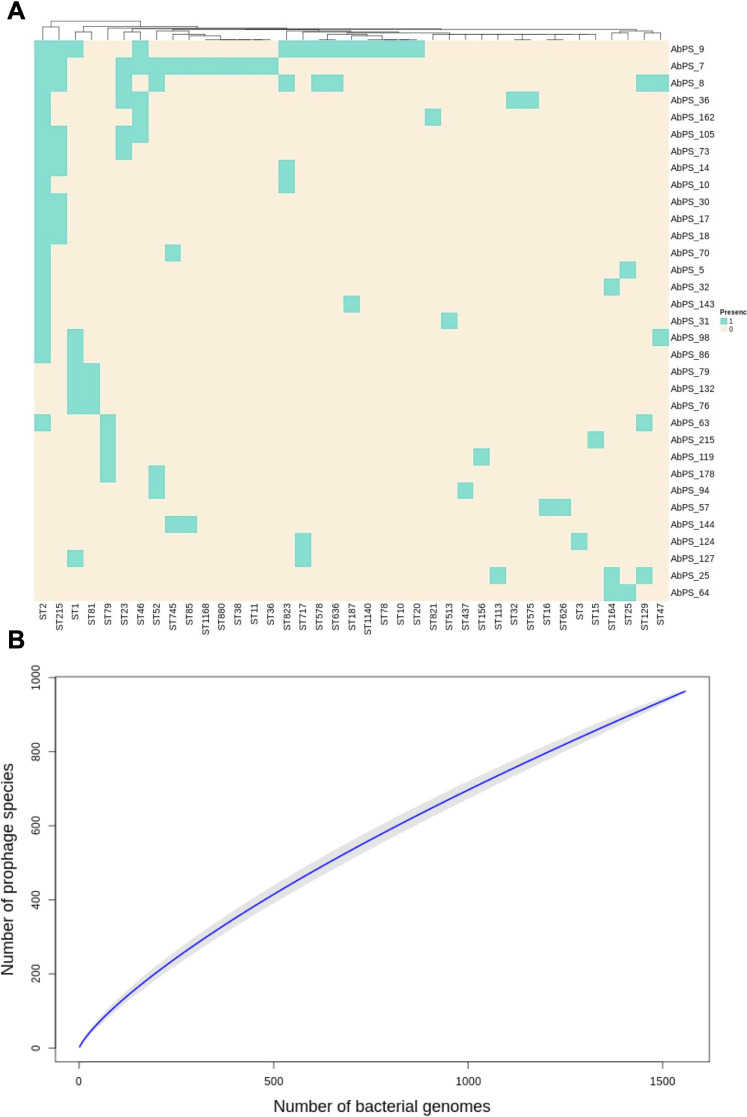
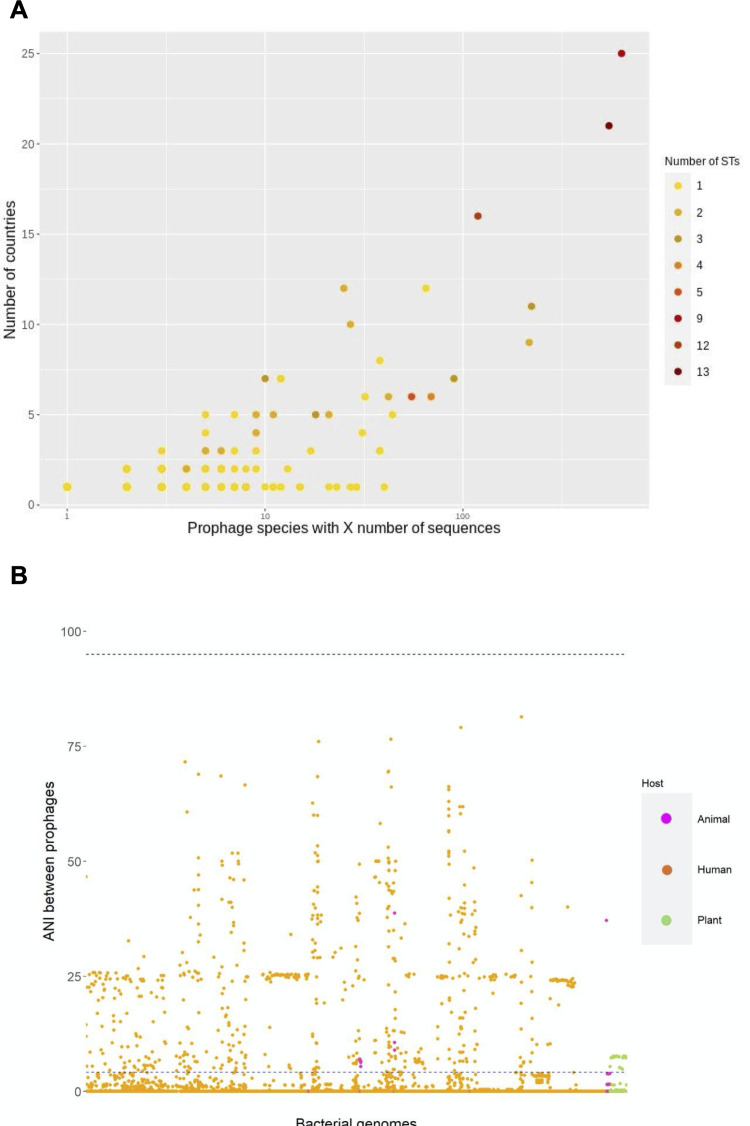
Much knowledge about bacteriophages has been obtained via genomics and metagenomics over the last decades. However, most studies dealing with prophage diversity have rarely conducted phage species delimitation (aspect 1) and have hardly integrated the population structure of the host (aspect 2). Yet, these two aspects are essential in assessing phage diversity. Here, we implemented an operational definition of phage species (clustering at 95% identity, 90% coverage) and integrated the host's population structure to understand prophage diversity better. Gathering the most extensive data set of Acinetobacter baumannii phages (4,152 prophages + 122 virulent phages, distributed in 46 countries in the world), we show that 91% (875 out of 963) of the prophage species have four or fewer prophages per species, and just five prophage species have more than 100 prophages. Most prophage species have a narrow host range and are geographically restricted; yet, very few have a broad host range being well spread in distant lineages of A. baumannii. These few broad host range prophage species are not only cosmopolitan but also the most abundant species. We also noted that polylysogens had very divergent prophages, belonging to different prophage species, and prophages can easily be gained and lost within the bacterial lineages. Finally, even with this extensive data set, the prophage diversity has not been fully grasped. Our study highlights how integrating the host population structure and a solid operational definition of phage species allows us to better appreciate phage diversity and its transmission dynamics.
Importance: Much knowledge about bacteriophages has been obtained via genomics and metagenomics over the last decades. However, most studies dealing with prophage diversity have rarely conducted phage species delimitation (aspect 1) and have hardly integrated the population structure of the host (aspect 2). Yet, these two aspects are essential in assessing phage diversity. Here, we implemented an operational definition of phage species (clustering at 95% identity, 90% coverage) and integrated the host's population structure to understand prophage diversity better. Gathering the most extensive data set of Acinetobacter baumannii phages, we show that most prophage species have four or fewer prophages per species, and just five prophage species have more than 100 prophages. Most prophage species have a narrow host range and are geographically restricted; yet, very few have a broad host range being well spread in distant lineages of A. baumannii. These few broad host range prophage species are cosmopolitan and the most abundant species. Prophages in the same bacterial genome are very divergent, and prophages can easily be gained and lost within the bacterial lineages. Finally, even with this extensive data set, the prophage diversity has not been fully grasped. This study shows how integrating the host population structure and clustering at the species level allows us to better appreciate phage diversity and its transmission dynamics.
Keywords: ANI; Acinetobacter baumannii; bacteriophage genetics; phage species; population genomics; prophages; species definition.
Conflict of interest statement
The authors declare no conflict of interest.
Figures
Similar articles
-
A modular view of the bacteriophage genomic space: identification of host and lifestyle marker modules.Res Microbiol. 2011 Oct;162(8):737-46. doi: 10.1016/j.resmic.2011.06.006. Epub 2011 Jun 28. Res Microbiol. 2011. PMID: 21767638
-
Identification and characterization of Faecalibacterium prophages rich in diversity-generating retroelements.Microbiol Spectr. 2025 Feb 4;13(2):e0106624. doi: 10.1128/spectrum.01066-24. Epub 2024 Dec 31. Microbiol Spectr. 2025. PMID: 39745426 Free PMC article.
-
Emergence of a Competence-Reducing Filamentous Phage from the Genome of Acinetobacter baylyi ADP1.J Bacteriol. 2016 Nov 4;198(23):3209-3219. doi: 10.1128/JB.00424-16. Print 2016 Dec 1. J Bacteriol. 2016. PMID: 27645387 Free PMC article.
-
Phage hunters: Computational strategies for finding phages in large-scale 'omics datasets.Virus Res. 2018 Jan 15;244:110-115. doi: 10.1016/j.virusres.2017.10.019. Epub 2017 Nov 1. Virus Res. 2018. PMID: 29100906 Review.
-
An overview on Vibrio temperate phages: Integration mechanisms, pathogenicity, and lysogeny regulation.Microb Pathog. 2022 Apr;165:105490. doi: 10.1016/j.micpath.2022.105490. Epub 2022 Mar 17. Microb Pathog. 2022. PMID: 35307601 Review.
Cited by
-
Geographic variation in abundance and diversity of Acinetobacter baumannii Vieuvirus bacteriophages.Front Microbiol. 2025 Jan 28;16:1522711. doi: 10.3389/fmicb.2025.1522711. eCollection 2025. Front Microbiol. 2025. PMID: 39935639 Free PMC article.
-
Exploring Viral Interactions in Clavibacter Species: In Silico Analysis of Prophage Prevalence and Antiviral Defenses.Life (Basel). 2025 Jan 27;15(2):187. doi: 10.3390/life15020187. Life (Basel). 2025. PMID: 40003596 Free PMC article.
-
Synergistic antibacterial activity of curcumin and phage against multidrug-resistant Acinetobacter baumannii.Sci Rep. 2025 Mar 15;15(1):8959. doi: 10.1038/s41598-025-94040-y. Sci Rep. 2025. PMID: 40089540 Free PMC article.
References
-
- Casas V, Miyake J, Balsley H, Roark J, Telles S, Leeds S, Zurita I, Breitbart M, Bartlett D, Azam F, Rohwer F. 2006. Widespread occurrence of phage-encoded exotoxin genes in terrestrial and aquatic environments in Southern California. FEMS Microbiol Lett 261:141–149. doi:10.1111/j.1574-6968.2006.00345.x - DOI - PubMed
MeSH terms
Grants and funding
LinkOut - more resources
Full Text Sources
