

Adhesion of Crithidia fasciculata promotes a rapid change in developmental fate driven by cAMP signaling
- PMID: 39315810
- PMCID: PMC11520290
- DOI: 10.1128/msphere.00617-24
Adhesion of Crithidia fasciculata promotes a rapid change in developmental fate driven by cAMP signaling
Abstract
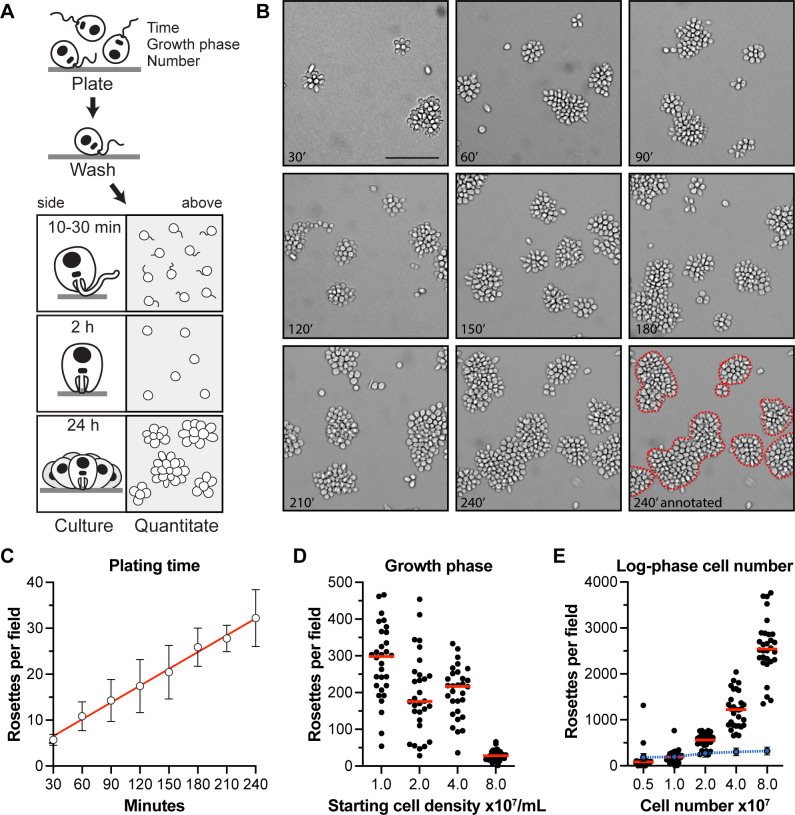
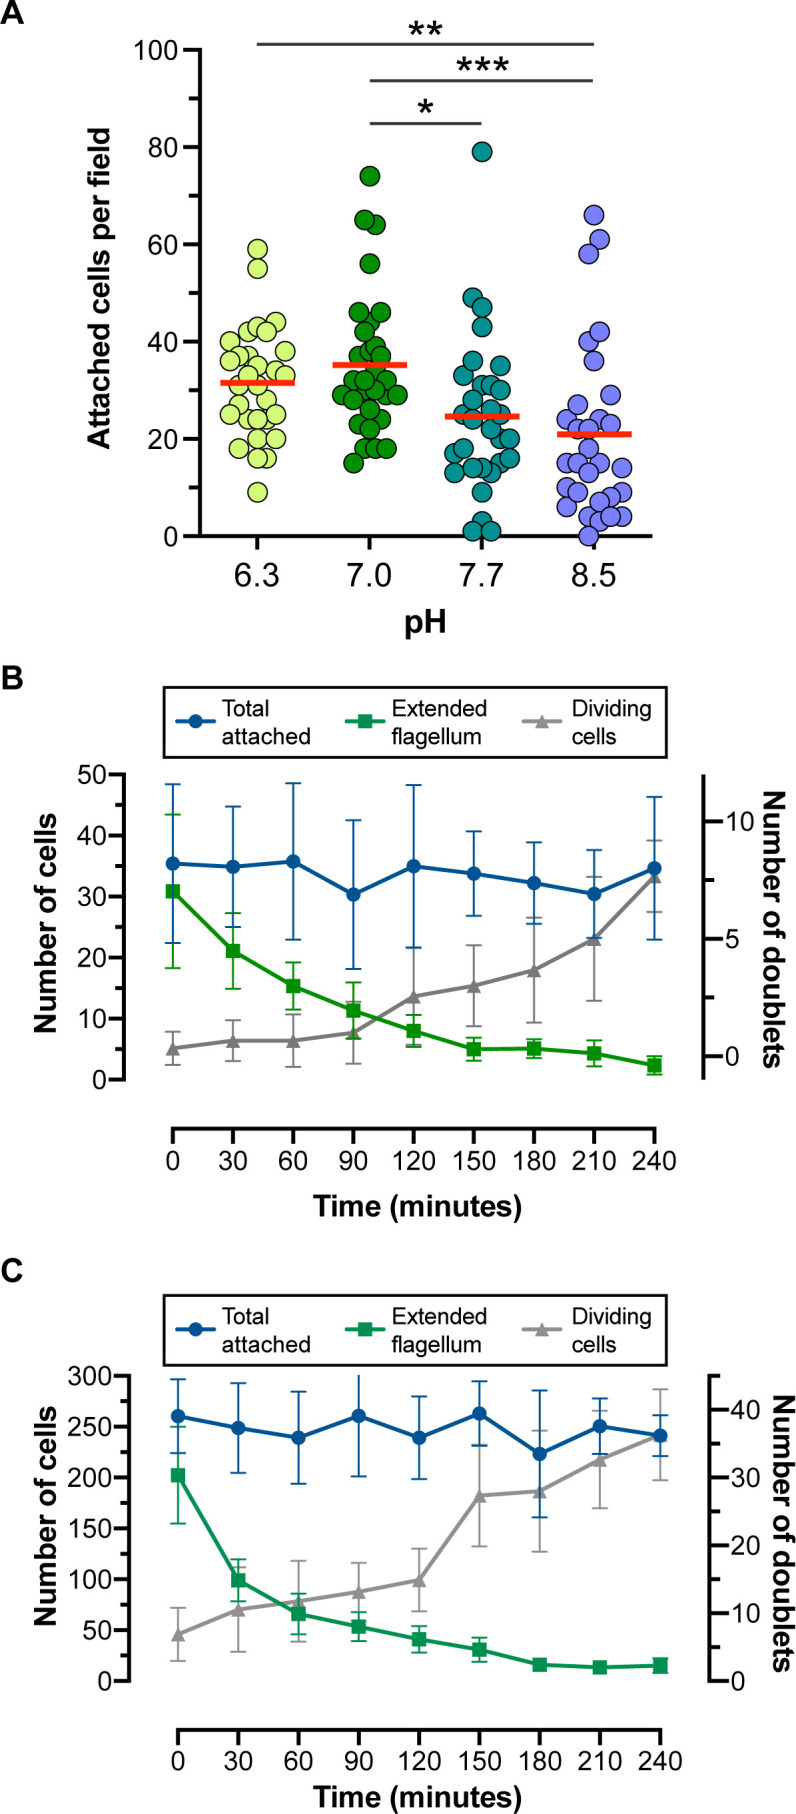
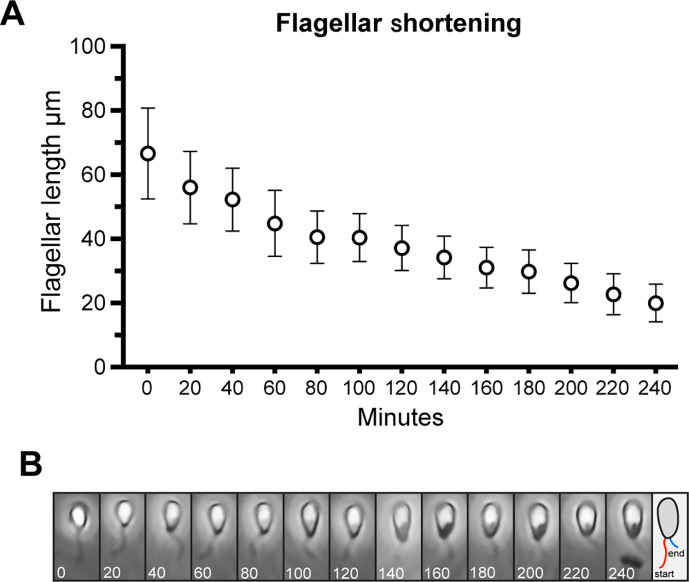
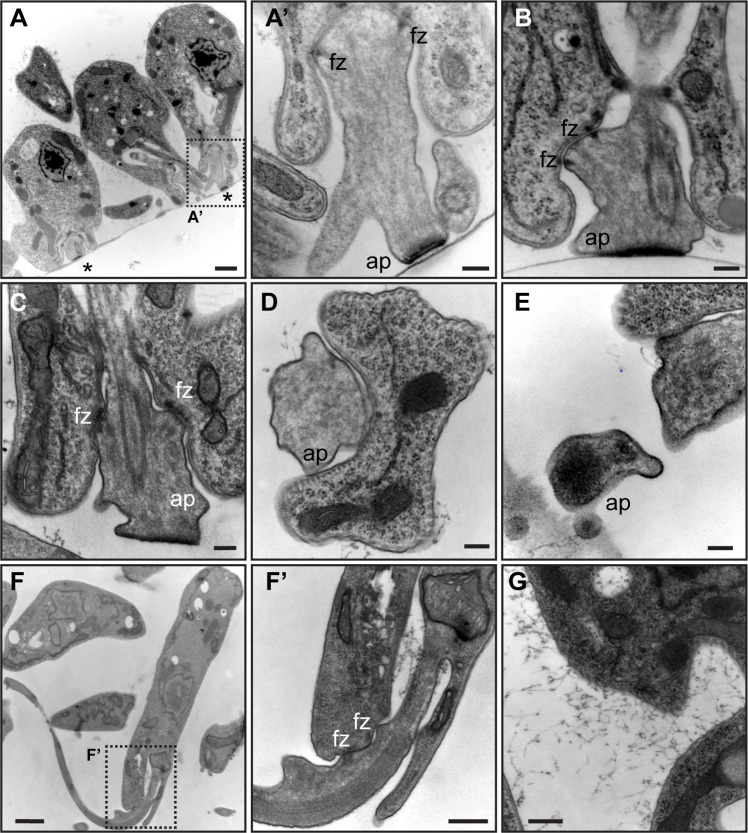
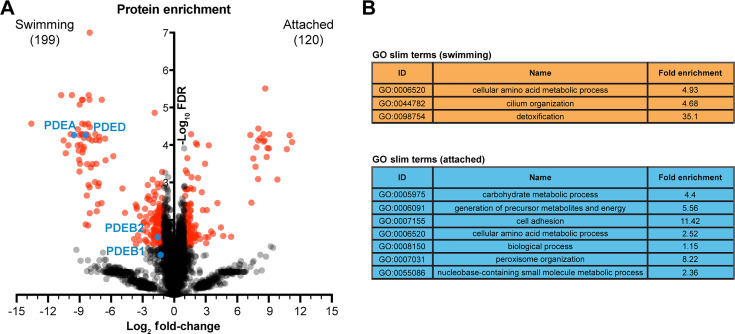
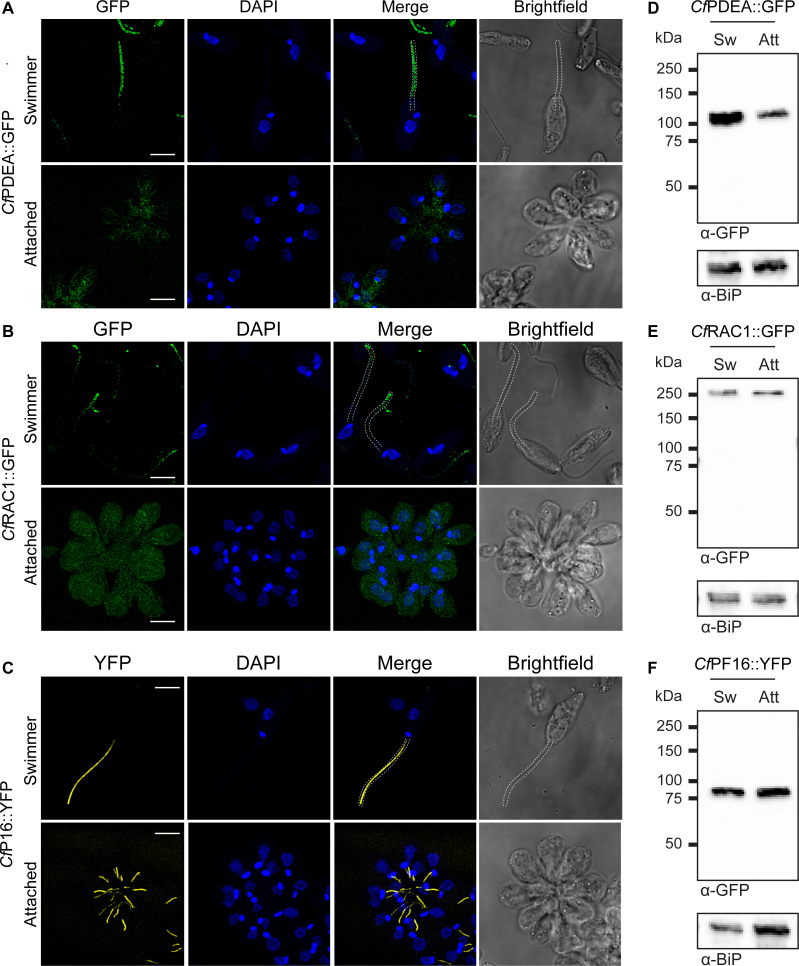
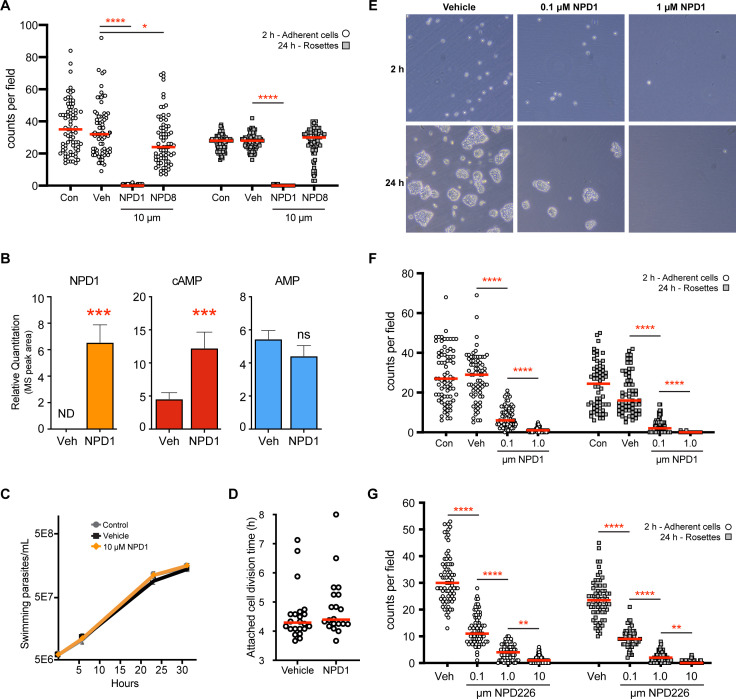
Trypanosomatids are single-celled parasites responsible for human and animal disease. Typically, colonization of an insect host is required for transmission. Stable attachment of parasites to insect tissues via their single flagellum coincides with differentiation and morphological changes. Although attachment is a conserved stage in trypanosomatid life cycles, the molecular mechanisms are not well understood. To study this process, we elaborate upon an in vitro model in which the swimming form of the trypanosomatid Crithidia fasciculata rapidly differentiates following adhesion to artificial substrates. Live imaging of cells transitioning from swimming to attached shows parasites undergoing a defined sequence of events, including an initial adhesion near the base of the flagellum immediately followed by flagellar shortening, cell rounding, and the formation of a hemidesmosome-like attachment plaque between the tip of the shortened flagellum and the substrate. Quantitative proteomics of swimming versus attached parasites suggests differential regulation of cyclic adenosine monophosphate (cAMP)-based signaling proteins. We have localized two of these proteins to the flagellum of swimming C. fasciculata; however, both are absent from the shortened flagellum of attached cells. Pharmacological inhibition of cAMP phosphodiesterases increased cAMP levels in the cell and prevented attachment. Further, treatment with inhibitor did not affect the growth rate of either swimming or established attached cells, indicating that its effect is limited to a critical window during the early stages of adhesion. These data suggest that cAMP signaling is required for attachment of C. fasciculata and that flagellar signaling domains may be reorganized during differentiation and attachment.IMPORTANCETrypanosomatid parasites cause significant disease burden worldwide and require insect vectors for transmission. In the insect, parasites attach to tissues, sometimes dividing as attached cells or producing motile, infectious forms. The significance and cellular mechanisms of attachment are relatively unexplored. Here, we exploit a model trypanosomatid that attaches robustly to artificial surfaces to better understand this process. This attachment recapitulates that observed in vivo and can be used to define the stages and morphological features of attachment as well as conditions that impact attachment efficiency. We have identified proteins that are enriched in either swimming or attached parasites, supporting a role for the cyclic AMP signaling pathway in the transition from swimming to attached. As this pathway has already been implicated in environmental sensing and developmental transitions in trypanosomatids, our data provide new insights into activities required for parasite survival in their insect hosts.
Keywords: Crithidia fasciculata; adhesion; attachment; cyclic AMP; differentiation; kinetoplastid; signaling.
Conflict of interest statement
The authors declare no conflict of interest.
Figures
Similar articles
-
Dramatic changes in gene expression in different forms of Crithidia fasciculata reveal potential mechanisms for insect-specific adhesion in kinetoplastid parasites.PLoS Negl Trop Dis. 2019 Jul 29;13(7):e0007570. doi: 10.1371/journal.pntd.0007570. eCollection 2019 Jul. PLoS Negl Trop Dis. 2019. PMID: 31356610 Free PMC article.
-
Growth-phase dependent substrate adhesion in Crithidia fasciculata.J Eukaryot Microbiol. 2005 Jan-Feb;52(1):17-22. doi: 10.1111/j.1550-7408.2005.3315r.x. J Eukaryot Microbiol. 2005. PMID: 15702975
-
An Insight into the proteome of Crithidia fasciculata choanomastigotes as a comparative approach to axenic growth, peanut lectin agglutination and differentiation of Leishmania spp. promastigotes.PLoS One. 2014 Dec 11;9(12):e113837. doi: 10.1371/journal.pone.0113837. eCollection 2014. PLoS One. 2014. PMID: 25503511 Free PMC article.
-
A sticky situation: When trypanosomatids attach to insect tissues.PLoS Pathog. 2023 Dec 21;19(12):e1011854. doi: 10.1371/journal.ppat.1011854. eCollection 2023 Dec. PLoS Pathog. 2023. PMID: 38128049 Free PMC article. Review.
-
Touching the Surface: Diverse Roles for the Flagellar Membrane in Kinetoplastid Parasites.Microbiol Mol Biol Rev. 2020 Apr 1;84(2):e00079-19. doi: 10.1128/MMBR.00079-19. Print 2020 May 20. Microbiol Mol Biol Rev. 2020. PMID: 32238446 Free PMC article. Review.
Cited by
-
Trypanosoma cruzi/Triatomine Interactions-A Review.Pathogens. 2025 Apr 17;14(4):392. doi: 10.3390/pathogens14040392. Pathogens. 2025. PMID: 40333244 Free PMC article. Review.
-
TcCARP3 modulates compartmentalized cAMP signals involved in osmoregulation, infection of mammalian cells, and colonization of the triatomine vector in the human pathogen Trypanosoma cruzi.mBio. 2025 Jun 11;16(6):e0099425. doi: 10.1128/mbio.00994-25. Epub 2025 May 23. mBio. 2025. PMID: 40407324 Free PMC article.
-
TcCARP3 modulates compartmentalized cAMP signals involved in osmoregulation, infection of mammalian cells, and colonization of the triatomine vector in the human pathogen Trypanosoma cruzi.bioRxiv [Preprint]. 2024 Nov 21:2024.11.20.624561. doi: 10.1101/2024.11.20.624561. bioRxiv. 2024. Update in: mBio. 2025 Jun 11;16(6):e0099425. doi: 10.1128/mbio.00994-25. PMID: 39605551 Free PMC article. Updated. Preprint.
-
Bioengineered 3D microvessels and complementary animal models reveal mechanisms of Trypanosoma congolense sequestration.Commun Biol. 2025 Feb 27;8(1):321. doi: 10.1038/s42003-025-07739-z. Commun Biol. 2025. PMID: 40011598 Free PMC article.
-
A conserved trypanosomatid differentiation regulator controls substrate attachment and morphological development in Trypanosoma congolense.PLoS Pathog. 2024 Feb 26;20(2):e1011889. doi: 10.1371/journal.ppat.1011889. eCollection 2024 Feb. PLoS Pathog. 2024. PMID: 38408115 Free PMC article.
References
MeSH terms
Substances
Grants and funding
LinkOut - more resources
Full Text Sources
Research Materials
