. 2024 Oct 22;98(10):e0068924.
doi: 10.1128/jvi.00689-24. Epub 2024 Sep 24.

High-throughput sequencing-based neutralization assay reveals how repeated vaccinations impact titers to recent human H1N1 influenza strains

Affiliations

High-throughput sequencing-based neutralization assay reveals how repeated vaccinations impact titers to recent human H1N1 influenza strains

Andrea N Loes et al. J Virol. .

Abstract

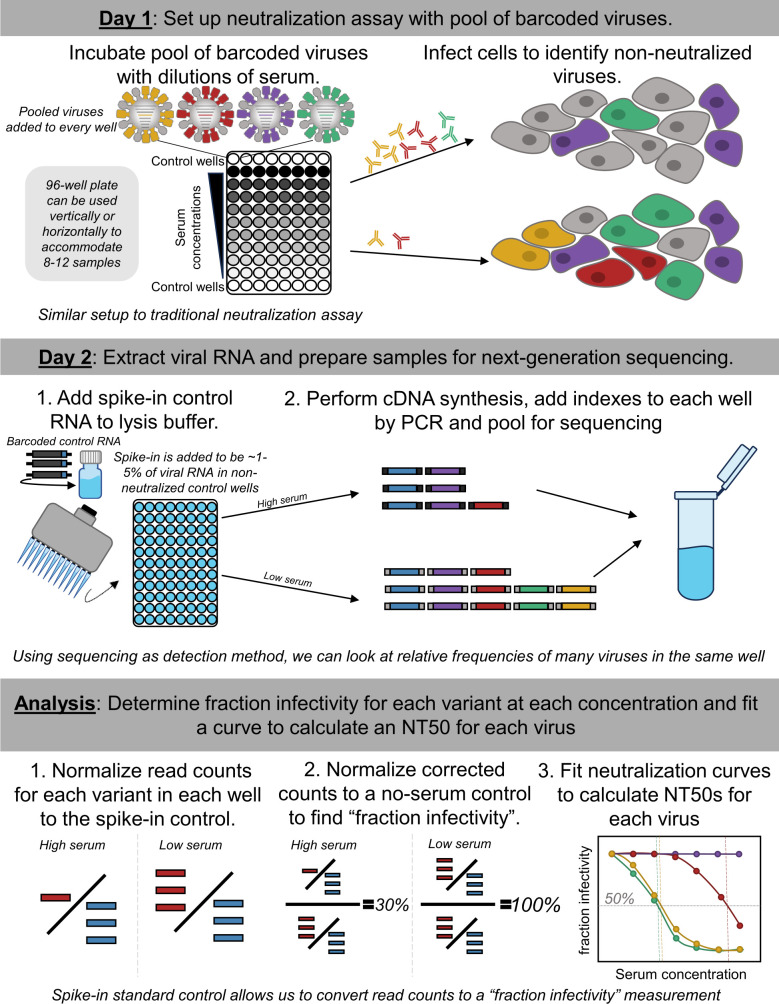
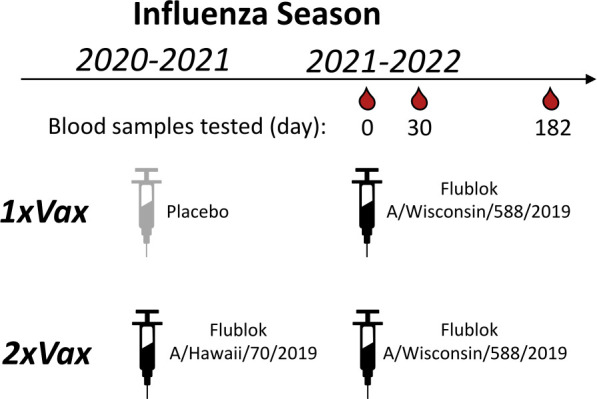
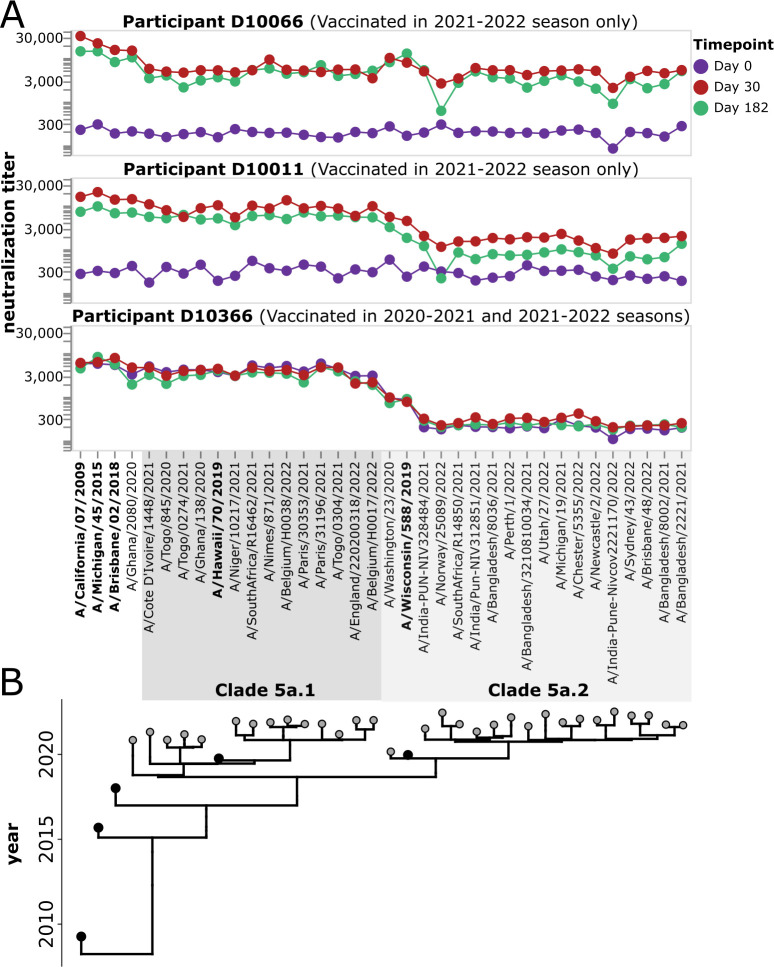
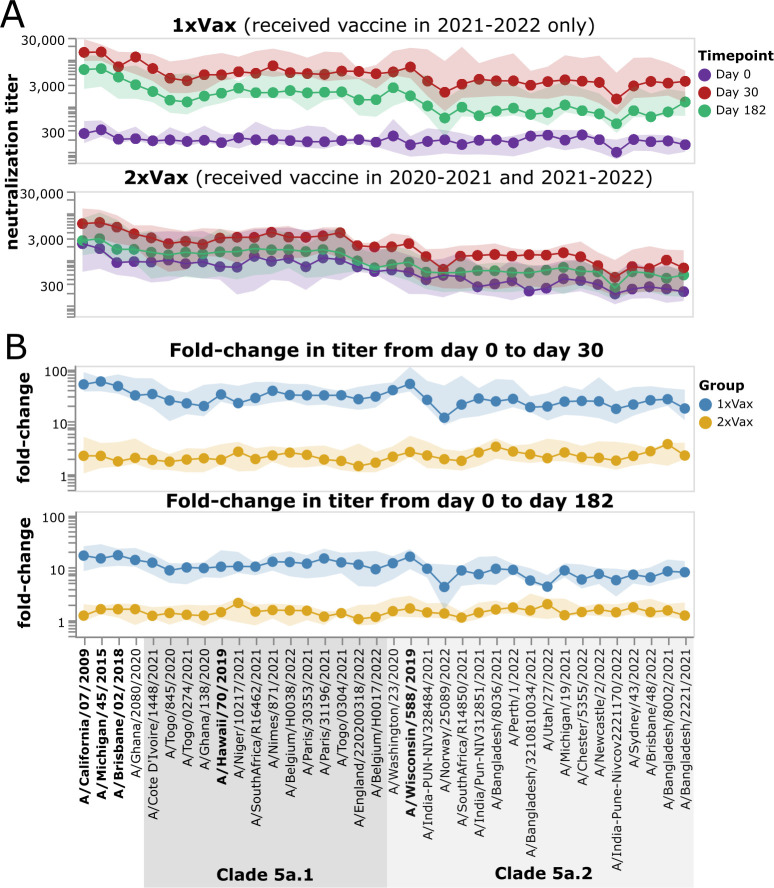
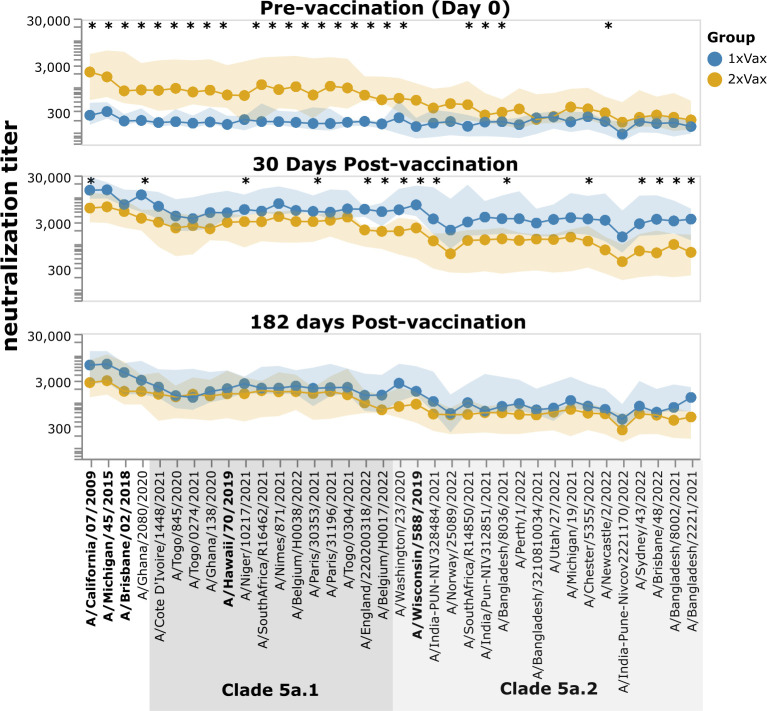
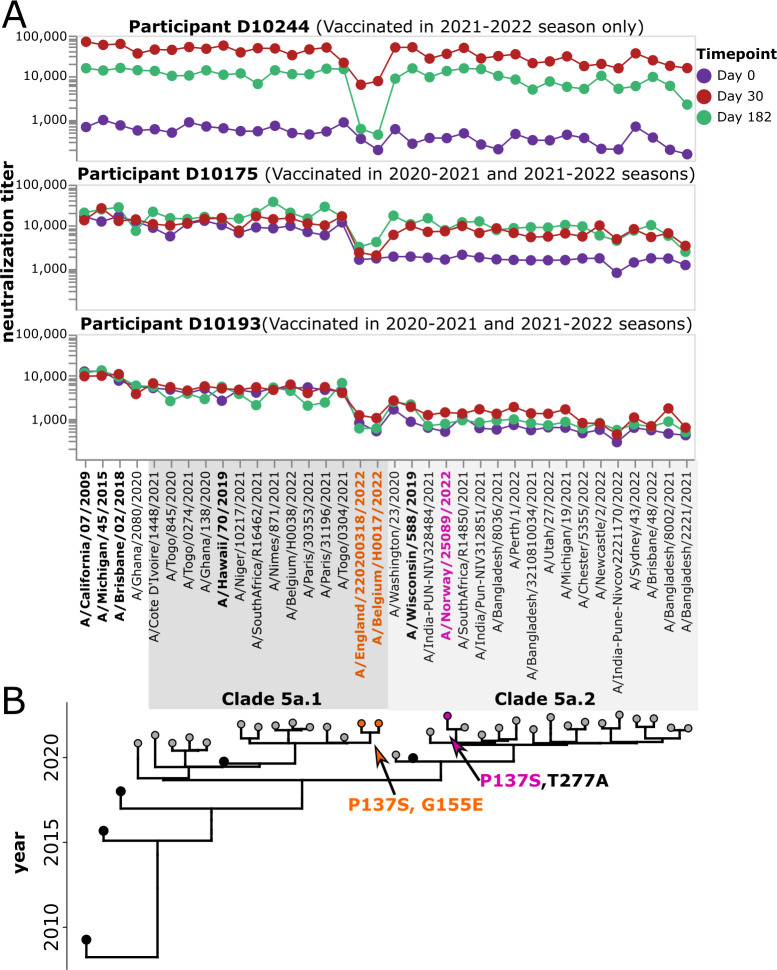
The high genetic diversity of influenza viruses means that traditional serological assays have too low throughput to measure serum antibody neutralization titers against all relevant strains. To overcome this challenge, we developed a sequencing-based neutralization assay that simultaneously measures titers against many viral strains using small serum volumes using a workflow similar to traditional neutralization assays. The key innovation is to incorporate unique nucleotide barcodes into the hemagglutinin (HA) genomic segment, and then pool viruses with numerous different barcoded HA variants and quantify the infectivity of all of them simultaneously using next-generation sequencing. With this approach, a single researcher performed the equivalent of 2,880 traditional neutralization assays (80 serum samples against 36 viral strains) in approximately 1 month. We applied the sequencing-based assay to quantify the impact of influenza vaccination on neutralization titers against recent human H1N1 strains for individuals who had or had not also received a vaccine in the previous year. We found that the viral strain specificities of the neutralizing antibodies elicited by vaccination vary among individuals and that vaccination induced a smaller increase in titers for individuals who had also received a vaccine the previous year-although the titers 6 months after vaccination were similar in individuals with and without the previous-year vaccination. We also identified a subset of individuals with low titers to a subclade of recent H1N1 even after vaccination. We provide an experimental protocol (dx.doi.org/10.17504/protocols.io.kqdg3xdmpg25/v1) and computational pipeline (https://github.com/jbloomlab/seqneut-pipeline) for the sequencing-based neutralization assays to facilitate the use of this method by others.

Importance: We describe a new approach that can rapidly measure how the antibodies in human serum inhibit infection by many different influenza strains. This new approach is useful for understanding how viral evolution affects antibody immunity. We apply the approach to study the effect of repeated influenza vaccination.

Keywords: influenza; influenza vaccines; neutralization assay; next-generation sequencing.


Conflict of interest statement

J.D.B. is on the scientific advisory boards of Apriori Bio, Invivyd, and the Vaccine Company. J.D.B. and A.N.L. receive royalty payments as inventors on Fred Hutch licensed patents related to incorporating barcodes into the influenza genome and viral deep mutational scanning. B.J.C. has consulted for AstraZeneca, Fosun Pharma, GlaxoSmithKline, Haleon, Moderna, Novavax, Pfizer, Roche, and Sanofi Pasteur. S.C. has consulted for CSL Seqirus.

Figures

Fig 1
Fig 1
Approach for sequencing-based neutralization assay. A pool of barcoded viruses is incubated with serially diluted serum. Cells are added to the virus-serum mixes, and non-neutralized viruses infect cells where they produce viral RNA. At 16 hours post-infection, lysis buffer supplemented with an RNA spike-in control is added to each well, and the RNA is extracted and processed for next-generation sequencing. To calculate the fraction infectivity of each virus at each serum concentration from the sequencing data, the sequencing counts for each viral barcode are first normalized by the counts of the spike-in control in each well, and then further normalized by the same ratio in no-serum control wells. The neutralization titers (NT50s) for each barcoded virus are calculated by fitting a Hill curve to the fraction infectivity measurements.
Fig 2
Fig 2
Human H1N1 influenza strains with HAs incorporated in the neutralization-assay library. (A) Phylogeny of recent human H1N1 HA generated by nextstrain.org from October 2022 (16, 17), with black circles indicating recent cell-based vaccine strains included in the library, and gray circles indicating strains selected for the library from recent emerging clades. The recent strains as well as the two most recent vaccine strains (A/Hawaii/70/2019 and A/Wisconsin/588/2019) fall into the 5a.1 or 5a.2 clades as indicated on the tree. See https://nextstrain.org/flu/seasonal/h1n1pdm/ha/2y@2022-10-07?d=tree&p=full for an interactive version of the tree. (B) Structure of HA indicating amino-acid sites that vary among the HA ectodomains of the 31 recent strains and the two most recent vaccine strains included in the library (PDB: 6XGC) (18). Additional sites not indicated on the structure differ in the three older vaccine strains included in the library. The overall HA structure is shown in gray, and sites that vary among recent library strains are shown as spheres, colored according to the antigenic epitope (15).
Fig 3
Fig 3
Sequencing-based neutralization assay yields reproducible measurements. (A) Example sequencing-based neutralization assay curves for virus with the HA from A/Wisconsin/588/2019 (H1N1) against serum samples collected from study participant D10191 on day 0 or day 30 post-vaccination. The library contains three different barcodes for this HA, so three curves (one for each barcode) are generated on each of two different plates (plate 4 and plate 13) that were run on different dates. See Fig. S4 for a display of all curves generated from a single plate. (B) Correlation between NT50s measured for replicate barcodes corresponding to the same virus strain on the same plate. Each point represents a different viral strain, and each plot facet represents a different individual, with the colors indicating the days post-vaccination the serum was collected from that individual. The Pearson correlation (r) is indicated on the plot. (C) Correlation between NT50s measured for each viral strain on two different plates run on different days. The NT50s for each plate represent the median across the replicate barcodes for each virus on that plate.
Fig 4
Fig 4
NT50s measured with the sequencing-based neutralization assay are highly correlated with those measured using a traditional neutralization assay. (A) Example neutralization curves against sera collected from study participant D10378 collected on day 0 or day 182 post-vaccination, measured using the sequencing-based neutralization assay (top) or a traditional one-virus versus one-serum fluorescence-based neutralization assay (bottom) (24, 25). For the sequencing-based assay, the error bars represent the standard error of curves for replicate barcodes corresponding to the same strain from the same well; for the traditional neutralization assay, the error bars represent the standard error of two replicate measurements calculated from separate wells. (B) Correlation between NT50s for eight serum samples against three virus strains measured using the sequencing-based neutralization assay or a traditional fluorescence-based neutralization assay. Each point represents a different serum-virus pair (the virus strains shown are A/Hawaii/70/2019, A/Wisconsin/588/2019, and A/England/220200318/2022), and points are colored by the day post-vaccination the sample was collected. The Pearson correlation (r) is indicated on the plot. (C) Correlation between NT50s measured with sequencing-based neutralization assay versus HAI titers against the A/Hawaii/70/2019 virus strain for 30 serum samples collected on day 0 or day 30 post-vaccination. The dynamic range for the HAI titers was smaller than that used for neutralization assays (5–1,280 vs. 20–393,660).
Fig 5
Fig 5
Schematic of study design. In the DRIVE study (29), a randomized vaccine trial of repeated annual vaccination of Flublok (a quadrivalent recombinant-HA vaccine), eligible healthy adults were randomly assigned at enrollment into five intervention groups of receiving a total of 1 to 5 annual Flublok vaccinations during 2020–2021 to 2024–2025 seasons, with blood specimens collected for analysis prior to receipt of the vaccine (day 0) as well as at day 30 and 182 post-vaccination in all participants. For the present analysis, we selected sera collected from study year 2 (2021–2022) from individuals pre-vaccination (day 0) and approximately 30 and 182 days post-vaccination for a subset of participants who had a pre-year 1 vaccination HAI titer <10 against the A/Hawaii/70/2019 (H1N1) vaccine strain, and who were assigned to either receive the placebo or the Flublok Vaccine (A/Hawaii/70/2019) in study year 1 (2020–2021 season). All selected participants received the Flublok Vaccine (A/Wisconsin/588/2019) in year 2 (2021–22 season), that is, two groups of participants who were vaccinated in 2021–2022 and who had either prior year vaccination in 2020–2021 (“2xVax”) or not (“1xVax”) (Table 1).
Fig 6
Fig 6
Example neutralization landscapes showing different strain- or clade-specific responses to vaccination. (A) NT50s for three participants (D10066, D10011, and D10366) against all viral strains in the library for serum samples collected at 0, 30, or 182 days after receipt of the 2021–2022 vaccine. D10366 was also vaccinated in the previous season, while D10066 and D10011 were not vaccinated in the previous season. The participants responded differently to the 2021–2022 vaccination. Participant D10066 had a broad response to all viruses in the library. Participant D10011 had a stronger response to the 5a.1 clade than the 5a.2 clade, with the only strong response to a 5a.2 clade virus being to the A/Wisconsin/588/2019 vaccine strain and a closely related strain. Participant D10366 did not respond to vaccination with increased titers to any strains but had high pre-existing titers to 5a.1 clade viruses probably due to vaccination in the previous season. See Fig. S5 and S6 for similar neutralization landscapes for all study participants. (B) Phylogeny showing relationships among viral strains in the library. The names of the vaccine strains are in bold black text. Strains within clades 5a.1 and 5a.2 are indicated by shaded gray boxes.
Fig 7
Fig 7
Impact of vaccination in 2021–2022 on neutralization titers across study participants who did or did not receive a vaccine the previous year. (A) Neutralization titers against each virus strain at each timepoint for participants who were not vaccinated the previous year (top) or who also received a vaccine in 2020–2021. The points indicate the median titers across participants, and the shaded areas show the interquartile range. (B) Fold change in titer at day 30 or day 182 post-vaccination relative to the day 0 titer. Points indicate the median fold change across participants, and the shaded areas show the interquartile range. Strains within clades 5a.1 and 5a.2 are indicated by shaded gray boxes. The names of the vaccine strains are in bold black text. This figure shows only participants who had serum samples from all three timepoints (days 0, 30, and 182 post-vaccination); see Fig. S7 for plots that include participants who only had samples from the day 0 and 30 timepoints.
Fig 8
Fig 8
Neutralization titers after receipt of 2021–2022 vaccine among participants that did or did not also receive a vaccine in the previous year. The points show the median neutralization titer across study participants in that group, and the shaded areas show the interquartile range. The names of the vaccine strains are in bold black text. Strains within clades 5a.1 and 5a.2 are indicated by shaded gray boxes. Strains with a significant difference in median titer between groups as assessed by a Mann-Whitney U test are indicated with an asterisk at the top of each plot panel. Titers against all strains for each study participant are shown in Fig. S5 and S6. This figure shows only participants who had serum samples from all three timepoints (days 0, 30, and 182 post-vaccination); see Fig. S7 for plots that include participants who only had samples from the day 0 and 30 timepoints.
Fig 9
Fig 9
Some participants have low neutralizing titers to viruses in a specific subclade of 5a.1. (A) Neutralization landscapes for three study participants with low titers to a subclade of 5a.1 viruses consisting of A/Belgium H0017/2022 and A/England/220200318/2022. (B) Phylogeny of the viral strains included in the library, with orange indicating strains that contain the HA mutations P137S and G155E, and pink indicating a strain that contains P137S but not G155E.

Update of

References

    1. Smith DJ, Lapedes AS, de Jong JC, Bestebroer TM, Rimmelzwaan GF, Osterhaus A, Fouchier RAM. 2004. Mapping the antigenic and genetic evolution of influenza virus. Science 305:371–376. doi:10.1126/science.1097211 - DOI - PubMed
    1. Hobson D, Curry RL, Beare AS, Ward-Gardner A. 1972. The role of serum haemagglutination-inhibiting antibody in protection against challenge infection with influenza A2 and B viruses. J Hyg (Lond) 70:767–777. doi:10.1017/s0022172400022610 - DOI - PMC - PubMed
    1. Ohmit SE, Petrie JG, Cross RT, Johnson E, Monto AS. 2011. Influenza hemagglutination-inhibition antibody titer as a correlate of vaccine-induced protection. J Infect Dis 204:1879–1885. doi:10.1093/infdis/jir661 - DOI - PubMed
    1. Tsang TK, Cauchemez S, Perera R, Freeman G, Fang VJ, Ip DKM, Leung GM, Malik Peiris JS, Cowling BJ. 2014. Association between antibody titers and protection against influenza virus infection within households. J Infect Dis 210:684–692. doi:10.1093/infdis/jiu186 - DOI - PMC - PubMed
    1. Kim K, Vieira MC, Gouma S, Weirick ME, Hensley SE, Cobey S. 2024. Measures of population immunity can predict the dominant clade of influenza A (H3N2) in the 2017-2018 season and reveal age-associated differences in susceptibility and antibody-binding specificity. medRxiv:2023.10.26.23297569. doi:10.1101/2023.10.26.23297569 - DOI

MeSH terms

Substances

LinkOut - more resources