. 2024 Oct;121(40):e2412220121.
doi: 10.1073/pnas.2412220121. Epub 2024 Sep 24.

Hypernetwork modeling and topology of high-order interactions for complex systems

Affiliations

Hypernetwork modeling and topology of high-order interactions for complex systems

Li Feng et al. Proc Natl Acad Sci U S A. 2024 Oct.

Abstract

Interactions among the underlying agents of a complex system are not only limited to dyads but can also occur in larger groups. Currently, no generic model has been developed to capture high-order interactions (HOI), which, along with pairwise interactions, portray a detailed landscape of complex systems. Here, we integrate evolutionary game theory and behavioral ecology into a unified statistical mechanics framework, allowing all agents (modeled as nodes) and their bidirectional, signed, and weighted interactions at various orders (modeled as links or hyperlinks) to be coded into hypernetworks. Such hypernetworks can distinguish between how pairwise interactions modulate a third agent (active HOI) and how the altered state of each agent in turn governs interactions between other agents (passive HOI). The simultaneous occurrence of active and passive HOI can drive complex systems to evolve at multiple time and space scales. We apply the model to reconstruct a hypernetwork of hexa-species microbial communities, and by dissecting the topological architecture of the hypernetwork using GLMY homology theory, we find distinct roles of pairwise interactions and HOI in shaping community behavior and dynamics. The statistical relevance of the hypernetwork model is validated using a series of in vitro mono-, co-, and tricultural experiments based on three bacterial species.

Keywords: ecological behavior; ecological community; evolutionary game theory; high-order interaction; pairwise interaction.


Conflict of interest statement

Competing interests statement:The authors declare no competing interest.

Figures

Fig. 1.
Fig. 1.
State change a hexad hypernetwork. (A) State 1 in which six species (S1–S6) are assumed to cooperatively interact with each other to form a six-node mutualistic network. Gray bidirectional arrows represent the mutualism between a pair of species, with the thickness of lines proportional to the strength of mutualism. (B) Interactions operate in the six-species community both in a dyadic manner (B1) and through active HOI (B2). Each species (indicated by an ellipse) is promoted (red line) or inhibited (blue line) by every other species and every possible pair of species involving no focal species, moving the community toward state 2. Plus represents the simultaneous occurrence of all these interactions with a focal species in the community. (C) Altered abundance in a species promotes (red line) or inhibits (blue line) the active HOI to produce a four-way passive HOI by which the community enters state 3. In each case, the thickness of lines is proportional to the strength of the active or passive HOI. Note that only those high-order passive HOI that act on the active HOI, which can also be observed in triads S1–S2–S3 and S4–S5–S6, are shown.
Fig. 2.
Fig. 2.
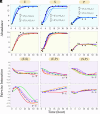
Abundance trajectory of each species (S1–S6) fitted by observed data (blue dots) from a hexad S1–S2–S3–S4–S5–S6 and two triads S1–S2–S3 and S4–S5–S6. This fitted trajectory of each species is decomposed into its independent growth curve (red line), first-order independent growth curves (green line) due to the influence on this focal species by the other five species, and second-order dependent growth curves (orange line) due to the influence on this focal species of pairwise mutualism among the other five species. At two sides of the hexad curves are the abundance trajectory of each species (blue line) fitted by observed data (blue dots) from triads S1–S2–S3 and S4–S5–S6, respectively. The fitted trajectory of a species in the triad is decomposed into its independent growth curve (red line), first-order dependent growth curve (green line) due to the influence of the other two species on this focal species, and second-order dependent growth curves (orange line) due to the influence on this focal species of the mutualism between the other two species. For comparison, the same type of the second-order dependent growth curves is indicated between the hexad and triads.
Fig. 3.
Fig. 3.
The detection of high-order passive HOI from a hexad S1–S2–S3–S4–S5–S6. The trajectory of the active HOI (blue line) involving a set of three species from triad S1–S2–S3 (A) and S4–S5–S6 (B), fitted by time-dependent estimation values (blue dots) from the hexad data, is decomposed into its independent component that is assumed to occur in a condition without the existence of any additional species (red line) and dependent components arising from the existence of additional species (green line). The broken line represents the trajectory of the active HOI detected in a triad (with no fourth species in this case), whose consistency with the above independent component estimated from the hexad suggests the biological interpretation of our ecological statistical mechanics theory for more complex communities.
Fig. 4.
Fig. 4.
The GLMY homology dissection of microbial hypernetworks. (A) Homology barcodes (HR) based on positive interaction, negative interaction, and mixed (positive and negative) interaction hypernetworks. The homologies are calculated at dimensions 1, 2, 3, and 4. (B) Homological networks for mixed positive and negative interactions at dimension 4. (C) Homological networks for negative and mixed interactions at dimension 3, respectively.
Fig. 5.
Fig. 5.
The detection of active and passive HOI in a three-species (E–S–P) community. (A) Hypernetworks as a collection of nodes (E, S, and P), pairwise edges (E–S, S–P, and P–E), and HOI edges (SP→E, EP→S, and ES→P) under mutualism (black bidirectional arrow line), antagonism (black bidirectional T-shaped line), altruism (black directed arrow line), and aggression (black directed T-shaped line). Red and blue directed arrows represent the promotion and inhibition of active HOI for a focal species, respectively, with the strength of influence proportional to the thickness of lines. (B) Time-dependent abundance trajectory (blue line) of each species (E, S, and P) observed in the triad decomposed into its independent component (red line) due to this species’ intrinsic capacity and dependent component (green line) resulting from the influence of the other two species and their interaction. Black dots denote abundance observations of a species at different time points in the triad, fitted by the miODE of Eq. 3. (C) Driven by active HOI, the abundance of each interactive species is shifted to a new state, which in turn influences the directed interactions of the other pair of species. Passive HOI includes the influence of P on E→S and S→E interactions, the influence of S on E→P and P→E interactions, and the influence of E on S→P and P→S interactions under mutualism, antagonism, altruism, and aggression. In each case, the influence of one species on the second observed in the triad (blue line) is decomposed into the same type of influence assumed to occur in a dyad (red line) and passive HOI curve (green line).
Fig. 6.
Fig. 6.
Experimental validation of the statistical hypernetwork model as an ecological statistical mechanics theory. (A) Independent growth component curves of each species estimated from two dyads involving this species (thin blue line), in comparison with the fitted growth curve (thick blue line) of this species’ abundance data (blue dots) in its monoculture. (B) Independent growth component curves of each species estimated from the triad under different types of pairwise interactions (green, red, purple, and orange lines for mutualism, antagonism, altruism, and aggression, respectively), in comparison with the fitted growth curve (blue line) of this species’ abundance data (blue dots) in its monoculture. (C) Dependent growth component curves of each species affected by its coexisting species estimated from the triad when no third species is assumed to exist, under different types of pairwise interactions (green, red, purple, and orange lines for mutualism, antagonism, altruism, and aggression, respectively), in comparison with the same type of dependent growth component curves (blue line) estimated from the dyads.
Fig. 7.
Fig. 7.
Structural change of an ecological community over time. Three constituent species (E, S, and P) establish a co-occurrence network in state 1. Under active HOI, the community enters state 2, in which new interactive relationships are formed. Newly formed interspecific interactions in turn affect the growth of individual species through passive HOI. The species are then reshuffled to comprise state 3 of the community. This process is iterated to drive the community to diversify and evolve over ecological time. Red and blue arrowed lines represent promotion and inhibition, respectively, with the thickness of lines proportional to the strength of interaction.

References

    1. Gorter F. A., et al. , Understanding the evolution of interspecies interactions in microbial communities. Philos. Trans. R. Soc. B. 375, 20190256 (2020). - PMC - PubMed
    1. Ratzke C., et al. , Strength of species interactions determines biodiversity and stability in microbial communities. Nat. Ecol. Evol. 4, 376–383 (2020). - PubMed
    1. Omidi A., et al. , Reviewing interspecies interactions as a driving force affecting the community structure in lakes via cyanotoxins. Microorganisms. 9, 1583 (2021). - PMC - PubMed
    1. Wuest S. E., et al. , Ecological and evolutionary approaches to improving crop variety mixtures. Nat. Ecol. Evol. 5, 1068–1077 (2021). - PubMed
    1. Swain A., et al. , Higher-order effects, continuous species interactions, and trait evolution shape microbial spatial dynamics. Proc. Natl. Acad. Sci. U. S. A. 119, e2020956119 (2022). - PMC - PubMed

LinkOut - more resources