. 2024 Nov 4;221(11):e20240386.
doi: 10.1084/jem.20240386. Epub 2024 Sep 24.

Transport of β-amyloid from brain to eye causes retinal degeneration in Alzheimer's disease

Affiliations

Transport of β-amyloid from brain to eye causes retinal degeneration in Alzheimer's disease

Qiuchen Cao et al. J Exp Med. .

Abstract

The eye is closely connected to the brain, providing a unique window to detect pathological changes in the brain. In this study, we discovered β-amyloid (Aβ) deposits along the ocular glymphatic system in patients with Alzheimer's disease (AD) and 5×FAD transgenic mouse model. Interestingly, Aβ from the brain can flow into the eyes along the optic nerve through cerebrospinal fluid (CSF), causing retinal degeneration. Aβ is mainly observed in the optic nerve sheath, the neural axon, and the perivascular space, which might represent the critical steps of the Aβ transportation from the brain to the eyes. Aquaporin-4 facilitates the influx of Aβ in brain-eye transport and out-excretion of the retina, and its absence or loss of polarity exacerbates brain-derived Aβ induced damage and visual impairment. These results revealed brain-to-eye Aβ transport as a major contributor to AD retinopathy, highlighting a new therapeutic avenue in ocular and neurodegenerative disease.


Conflict of interest statement

Disclosures: M. Nedergaard reported personal fees from CTN2 outside the submitted work and is a paid consultant for CNS2 for unrelated work. No other disclosures were reported.

Figures
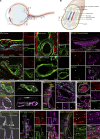
Figure 1.
Figure 1.
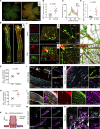
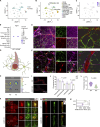
Aβ deposits in the retina, optic nerve vasculature, and periorbital lymphatics of AD patients. (A and B) The schematic diagram of the retina and optic nerve showing the distribution of blood vessels, lymphatics, and myelinated axons. (C) The retina and optic nerve sections were stained with 6E10 (red) for Aβ, and with Laminin (green) for retinal vessels (a), the central retinal vessel of the optic nerve (b), and periorbital blood vessels (c), with IgG used as a negative control (d). White arrowheads indicated the deposition of Aβ in the microvasculature of the retina, the intermediate layer of the vascular wall, and outside the vascular wall. (D) Representative immunofluorescence images of AD patient eye tissue sections stained with 6E10 (red), LYVE1 (purple), and Laminin (green) showing Aβ deposition in the posterior eye RPE-choroid-sclera complex. (E and F) The 3D reconstructed images and fluorescence intensity line graphs demonstrate the relationship between the deposition location of Aβ and the positions of blood vessels and lymphatic vessels. (G–I) Representative immunofluorescence images of AD patient eye tissue sections stained with 6E10 (red), LYVE1 (purple), and Laminin (green) showing Aβ deposition in the (G) periorbital lymphatics, and (H) optic nerve meningeal lymphatics, as well as (I) Schlemm’s canal. Prox1 (red) and Lyve1 (purple) were used to label lymphatic vessels. White arrowheads indicated Aβ deposition within the lumen of the lymphatic vessels. (J) Representative immunofluorescence images of AD patient eye tissue sections stained with 6E10 (red), MBP (purple), and TUJ1 (green) demonstrating Aβ deposition in the spaces between myelinated axons and fascicles.
Figure 2.
Figure 2.
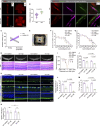
Aβ deposition in ocular blood vessels and optic nerve meningeal lymphatic vessels of 5×FAD mice. (A and D) Representative confocal images of retinal and optic nerve flatmounts from 10-mo-old WT and 5×FAD mice stained with 6E10 (red) for Aβ and IB4 (green) for blood vessels. (B and E) Statistical graphs showing the percentage of 6E10+ area in the retina and optic nerve (n = 10). (C) Fluorescence intensity profile through a line scan across retinal blood vessels, demonstrating co-localization of 6E10 and IB4. (F) 3D reconstruction of retina and optic nerve head (ONH) immunofluorescence pictures of 5×FAD mice labeled with 6E10 and IB4. White arrowheads indicate the majority of Aβ in the PVS. (G and H) ELISA of Aβ1–40 and Aβ1–42 in retinal samples from 10-mo-old WT mice and 5×FAD mice (n = 6). (I and J) Immunofluorescent staining of retina and optic nerve frozen sections from 5×FAD mice reveals Aβ1–42 (red) deposition at blood vessels, with αSMA (green)-positive and CD31 (blue)-positive labeling indicating arteries (A), and CD31 (blue) -positive and αSMA (green)-negative labeling indicating veins (V). (K) Fluorescence intensity line graph indicated that Aβ deposition in the PVS adjacent to arterioles was greater than that near venules, while deposition within the walls of venules was greater than inside the arterioles (n = 6–7). (L) Representative immunofluorescence images of 5×FAD mouse optic nerve tissue sections stained with 6E10 (red), MBP (purple), and TUJ1 (green). Aβ deposits in the spaces between myelinated axons were indicated by the arrowheads. (M and N) Representative immunofluorescence images showing Aβ labeled deposition with 6E10 (gray) in the optic nerve meningeal lymphatics and periorbital lymphatics in 5×FAD mice. The arrowheads indicated Aβ (gray) deposits colocalized with LYVE1+ (purple) and Laminin (green) labeled lymphatic vessels. Data are representative of two independent experiments. Data are presented as mean ± SEM. Statistical analysis was performed using two-tailed unpaired t tests (B, E, G, and H). GCL, ganglion cell layer; IPL, inner plexiform layer; INL, inner nuclear layer; OPL, outer plexiform layer; ONL, outer nuclear layer.
Figure 3.
Figure 3.
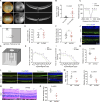
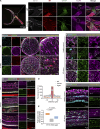
Impairment of visual function and retinal pathology in 10-mo-old 5×FAD mice. (A) Representative images of fundus, autofluorescence, and OCT in 5×FAD and WT mice, with white arrowheads indicating hyperautofluorescence spots in fundus images. (B and C) (B) Quantification of the number of hyperautofluorescence spots in the fundus and (C) retinal thickness measured by OCT (n = 9). (D–F) Schematic diagram of light–dark box experiments and quantification of the duration and number of entries into the dark box in WT and 5×FAD mice (n = 9). (G) Schematic diagram of optomotor response test in 5×FAD and WT mice (n = 9). (H and I) Quantification of (H) optomotor motion and (I) the duration of head movements for each grating density. (J and K) Representative images and quantitative analysis of RPE65 (green) staining in retinal cryosections from WT and 5×FAD mice (n = 5). (L and M) Immunofluorescence staining and quantification of PNA and Rhodopsin showing reduced expression levels in 5×FAD mice compared with WT mice (n = 5). (N and O) Representative images of retinal sections stained with HE and quantitative analysis of retinal thickness in WT and 5×FAD mice (n = 4). Representative of three independent experiments. All data are presented as mean ± SE of the mean (SEM). Statistical significance was assessed using the Mann–Whitney test (B, E, and F), two-tailed unpaired t tests (K, M, and O), or repeated-measures analysis of variance (ANOVA) followed by Bonferroni post hoc test (C, H, and I). *P < 0.05; **P < 0.01. GCL, ganglion cell layer; IPL, inner plexiform layer; INL, inner nuclear layer; OPL, outer plexiform layer; ONL, outer nuclear layer; IS, inner segment; OS, outer segment; RPE, retinal pigment epithelium.
Figure 4.
Figure 4.
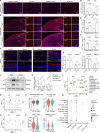
Overexpression of APP and PS1 in the brain but not in the retina. (A, C, F, and G) Representative immunofluorescence images showing the distribution of APP and PS1 in the brain (A and C) and retina (F and G) of AD donors and mice. (B, D, E, H, and I) Quantitative analysis revealed that, compared to healthy controls, the levels of APP and PS1 in the brains of AD patients show an increasing trend (n = 3). When compared to age-matched WT mice, the percentage of APP+ and PS1+ areas in the hippocampus and cortex increased in 5×FAD mice, but there was no significant difference observed in the retina (n = 5). (J and K) Western blot analysis of APP and PS1 protein levels in the brain and retina of WT and 5×FAD mice, with corresponding grayscale values (n = 6). (L) UMAPs showed cell clusters of retinal tissue in 10-mo-old WT and 5×FAD mice based on single-cell sequencing data. (M) UMAP clustering plot showing the distribution and expression levels of App in different cell clusters of retinas from WT and 5×FAD mice. (N) Violin plot showing the gene expression levels of App in retinal endothelial cells and pericytes from WT and 5×FAD mice. (O) UMAP clustering plot showing the distribution and expression levels of Psen1 in different cell clusters of retinas from WT and 5×FAD mice. (P) Violin plot showing the gene expression levels of Psen1 in retinal ganglion cells and macrophages/microglia from WT and 5×FAD mice. (Q) Gene expression dot plots showed the expression of App and Psen1 in the retinas of WT and 5×FAD mice, and the results indicated no significant differences in RNA expression at the cellular level across various cell populations. Data are representative of two independent experiments. Data are presented as mean ± SEM. Statistical analysis was performed using two-tailed unpaired t tests (B, H, I, N, and P) or one-way ANOVA with post hoc Tukey tests (D, E, and K). Source data are available for this figure: SourceData F4.
Figure 5.
Figure 5.
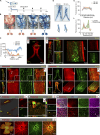
The draining route for CSF tracers from the brain to the eye. (A) Timeline of CM injection of Evans blue tracer. (B and C) Multitime point images of Evans blue spreading from the brain to the eye after injection and the corresponding statistical line chart of dye staining degree (n = 6). (D and E) 30-min and 60-min cross-sectional images of the optic nerve, along with a line graph representing the dye staining intensity along the yellow line. In the schematic diagram, the dye was visible at the sheath location at 30 min (black arrowhead), and at 60 min, the dye was within the optic nerve (yellow arrowhead). (F) Representative fluorescent microscopic image of Evans blue transportation along the optic nerve. (G) Image showing Evans blue transportation within the optic nerve sheath 10 min after injection, with the corresponding 3D image of IB4 staining (green) indicating blood vessels. (H and I) Representative images of Evans blue transportation within the optic nerve 20 and 30 min after injection along the blood vessels and nerve bundles. NS stands for the control group receiving brain injections of normal saline. (J and K) Representative images of Evans blue transportation within the optic nerve and retina 30 min after injection, with blood vessels stained by Laminin (green). (L) Line chart of fluorescence intensity showing the location relationship between Evans blue and blood vessels (n = 7). (M) Optic nerve sections demonstrated the distribution of Evans blue dye along myelinated axons along the optic nerve 30 min after injection. (N) Retinal flat mounts showing Evans blue transportation along retinal blood vessels 60 min after injection.
Figure S1.
Figure S1.
Multitime point transport of Aβ in the optic nerve. (A) Timeline of intracisternal injection of Aβ tracer. (B) Bioluminescence imaging showing the fluorescence intensity of Aβ in the brain and optic nerve 30 and 60 min after injection. (C) Representative images of Aβ distribution along the optic nerve in sections optic nerve after normal saline injection (30 min) and Aβ injection (30 min, 60 min). (D) Statistical graph of Aβ transportation distance in the optic nerve 30 and 60 min after injection (n = 5). (E) Representative images of short-range tracking of retinal Aβ transportation. (F) Fluorescence intensity profiles of the location of Aβ and IB4 in the vessels after a 30-min injection of CSF tracer (n = 8). (G) Statistical graphs of the percentage of area covered in short-range tracking experiments (n = 8). (H) Representative images showing the distribution of Aβ along the deep cervical lymph nodes (dcLNs) 30 min after saline injection and 30 min after Aβ injection. (I and J) Representative images and fluorescence intensity profiles of Aβ in the common carotid artery (CCA) and retina after normal saline injection (30 min) and Aβ injection (30 min) (n = 5). (K) Representative images and fluorescence intensity statistics showing the distribution of Aβ along the retina 30 min after Aβ injection following optic nerve ligation. (L) Immunofluorescence staining images of Aβ, Lyve1, CD31, and CD45 at the periorbital lymphatics, with CD45 labeling macrophages to exclude the possibility that Lyve1-labeled lymphatics are macrophages. Data are representative of three independent experiments. All data are presented as mean ± SEM. Statistical analysis was performed using two-tailed unpaired t tests (D, G, and K) or two-way ANOVA with post hoc Tukey tests (J).
Figure 6.
Figure 6.
The dynamic transportation of exogenous Aβ in the retina through the braineye drainage route. (A) Short and long-term observation timelines of fluorescently labeled human Aβ injected into the CM. (B) Confocal images showing the transportation of Aβ in the retina, optic nerve, and its sheath after 30 min. (C and D) Immunofluorescence staining and 3D reconstructed images of the optic nerve revealed that Aβ travels along the PVS adjacent to the CRA, which was co-labeled with αSMA (green) and Laminin (blue). Arrowheads indicated the path of Aβ transport. (E–G) Immunostaining and statistical graphs demonstrated Aβ signals in arteries and veins of retina and optic nerve 10 and 30 min after CM injection (n = 6). Areas with αSMA+ Laminin+ staining were labeled as “A” for arteries, and areas with αSMA Laminin+ staining were labeled as “V” for veins. (H and I) Representative images of Aβ tracer signal 30 min after injection in the lymphatic vessels adjacent to the optic nerve, characterized by LYVE1+ Laminin staining, as well as in the gaps between myelinated axons within the optic nerve, marked by MBP and TUJ1.
Figure S2.
Figure S2.
Transport of the contrast agent along the optic nerve. (A) Timeline of intracisternal injection of Gd-DTPA contrast agent. (B) MRI imaging of the brain after injection. (C) High-magnification image of the optic nerve in MRI. (D and E) Coronal and sagittal MRI images at different time points. A high reflectance signal of the contrast agent in the periorbital tissue was indicated by white arrowheads. (F) Line graph of contrast agent signal intensity in the eye area at different time points on MRI images.
Figure S3.
Figure S3.
Cellular distribution of AQP4 in the retina and optic nerve. (A) UMAP cell type distribution of retinal cells in 10-mo-old WT and 5×FAD mice based on scRNA-seq data. (B) Identification of 12 cell groups by UMAP clustering. (C) Expression levels of Aqp4 in the cell clustering plot. (D) The dot plot illustrated the percentage and expression levels of Aqp4 across various cell populations. The data was obtained through single-cell analysis of the retinas from 5xFAD mice. (E and F) Representative immunofluorescence images of GFAP (green), AQP4 (purple), and IB4 (red) in the retina and optic nerve of 3-mo-old WT mice. (G) A schematic diagram depicting the relationship between astrocytes, AQP4, and vascular positioning, illustrating the localization of AQP4 on the endfeet of astrocytes, encompassing the blood vessels. (H) Bioluminescence imaging showing Aβ transportation fluorescence intensity in the brain and optic nerve of WT and AQP4 KO mice 30 min after injection. (I and J) Immunofluorescence staining of the optic nerve and eye sections of WT and AQP4 KO mice showing significantly reduced Aβ fluorescence intensity, with subregion statistical analysis in the intraocular, intraorbital, intracanalicular, and intracranial segments of the optic nerve (n = 4). (K–N) Representative confocal images and quantitative analysis showing the transportation of Aβ in the retinas and optic nerve of WT and AQP4 KO mice 30 min after injection (n = 8). Data are representative of two independent experiments. All data are presented as mean ± SEM. Statistical significance was evaluated using two-tailed unpaired t test (L and N), two-way ANOVA with post hoc Tukey test (J).
Figure S4.
Figure S4.
Long-range tracing revealed the dissipation pattern of brain-derived Aβ in the retina. (A) Long-term observation timelines of fluorescently labeled human Aβ injected into the CM. (B and C) Representative images of long-term tracking of the optic nerve and retinal Aβ transport. (D) Statistical graphs of the fluorescence intensity in long-term tracing experiments after CM injection (n = 8). (E) Representative images of long-term tracking of Aβ transport in optic nerve meningeal lymphatics. (F) Statistical graphs of the fluorescence intensity within lymphatics in long-term tracing experiments (n = 8). Data are representative of two independent experiments. All data are presented as mean ± SEM.
Figure 7.
Figure 7.
Visual impairment induced by intracisternal injection of human Aβ1–42. (A) Schematic of multi-time point CN injection of Aβ oligomers. (B and C) Optomotor response test showing the time and number of head motion responses under different grating densities in mice 3, 7, and 15 days after injection of hAβ tracer into the CM (n = 8). (D–F) OCT imaging and HE staining of the retina in mice at time points 7 and 15 days, with quantitative analysis of retinal thickness (n = 8). (G and J) Representative immunofluorescence staining images of RPE65 (RPE-specific marker) in retinal sections and corresponding quantitative analysis showing decreased RPE65+ fluorescence intensity after 3, 7, and 15 days after Aβ injection (n = 4). (H and K) Representative immunofluorescence staining images of TUJ1 in retinal sections and corresponding quantitative analysis showing decreased TUJ1+ area percentage at time points of 7 and 15 days (n = 4). (I and L) Representative immunofluorescence staining images of Rhodopsin in retinal sections and corresponding quantitative analysis showing no significant difference in Rhodopsin+ area percentage among the above three time points. Representative of three independent experiments. Data are presented as mean ± SEM. Statistical analysis was performed using one-way ANOVA with post hoc Tukey tests (E and J–L) or repeated measures ANOVA with Bonferroni post hoc tests (B, C, and F). *P < 0.05; **P < 0.01; ***P < 0.001, 15-day control group versus 15-day Aβ group; #P < 0.05, 7-day control group versus 7-day Aβ group.
Figure S5.
Figure S5.
No obvious visual impairments in mice after intracerebral injection of exogenous Aβ1–42 during 3 days. (A–C) Actual photographs and quantitative analysis of optomotor responses at each grating density in mice 3 days after Aβ1–42 injection (n = 8). (D–F) OCT images of mice’s retinas 3 days after Aβ1–42 injection, with HE staining for retinal thickness measurement (n = 8). Data are representative of three independent experiments. All data are presented as mean ± SEM. Statistical significance was assessed using two-tailed unpaired t tests (E) or repeated measures ANOVA with Bonferroni post hoc tests (B, C, and F).
Figure 8.
Figure 8.
AQP4 influences the brain-to-eye transport rate and exacerbates brain-derived Aβ-induced retinal damage. (A) Representative confocal images showing the transport of Aβ in the optic nerves and retinas of WT and AQP4 KO mice 7 days after injection. (B) Quantitative analysis of the fluorescence intensity in the retinas 7 days after injection (n = 8). (C) Representative confocal images showing the transport of Aβ within optic nerve meningeal lymphatics of WT and AQP4 KO mice 7 days after injection. (D) Line chart of the fluorescence intensity in the retina lymphatics 7 days after injection (n = 8). (E–G) Optomotor response test in WT + DMSO group, WT + Aβ oligomer group, AQP4 KO + DMSO group, and KO + Aβ oligomer group (n = 10). Quantification of (F) optomotor motion and (G) the duration of head movements for each grating density. (H–J) OCT imaging and HE staining of the retina, with quantitative analysis of retinal thickness (n = 9). (K–N) Representative immunofluorescence staining images of RPE65 (L), TUJ1 (M), and Rhodopsin (N) in retinal sections and corresponding quantitative analysis (n = 4). Representative of three independent experiments. Data are presented as mean ± SEM. Statistical analysis was performed using two-tailed unpaired t tests (B) or two-way ANOVA with post hoc Tukey tests (J and L–N), repeated measures ANOVA with Bonferroni post hoc tests (F, G, and I). *P < 0.05; **P < 0.01; ***P < 0.001, AQP4 KO + DMSO group versus AQP4 KO + Aβ group; #P < 0.05, ##P < 0.01, WT+ Aβ group versus AQP4 KO + Aβ group.
Figure 9.
Figure 9.
Disruption of AQP4 polarity in the retina of AD patient, 5×FAD mice, and aged mice. (A) Immunofluorescence images of the retina and optic nerve sections from 10-mo-old 5×FAD mice, showing staining of 6E10 (gray) for Aβ, IB4 (red) for blood vessels, GFAP (green) for astrocytes, and AQP4 (purple) for AQP4. The circular dashed outline indicated the location of the optic nerve head, where the expression of AQP4 was absent. (B) Representative images of immunofluorescence staining for 6E10, GFAP, and AQP4 in cross-sections of the optic nerve from WT and 5×FAD mice. (C) Representative immunofluorescence images of 6E10, GFAP, AQP4, and IB4 in the retina of WT, 5×FAD, and aged mice (18 mo). (D) Statistical analysis of AQP4 fluorescence intensity along blood vessels (yellow dashed lines), indicating more dispersed AQP4 localization in 5×FAD mice and aged mice in comparison to WT mice. (E) Box plot of the polarization index, where the polarization index was the peak fluorescence value of blood vessels minus the baseline fluorescence value, all values were normalized to the peak value (n = 6). (F and G) Representative immunofluorescence images of GFAP and AQP4 in the optic nerve and retina of AD donors and healthy controls. Dashed lines and arrowheads indicated the location of blood vessels (identified through AQP4 channel Z-axis imaging), revealing abnormal distribution of AQP4 in the optic nerve and retina of AD patients, indicative of polarity disruption. Representative of two independent experiments. All data are presented as mean ± SEM. Statistical significance was assessed using one-way ANOVA with Tukey’s post hoc test (E).
Figure 10.
Figure 10.
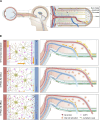
The braineye transport pathway anatomy and AQP4-mediated glymphatic mechanism in AD-related retinal disorders. (A) Anatomy of the brain–eye transport pathway. Brain–eye transport has three parts: transport along the SAS and optic nerve sheath, draining through optic nerve meningeal lymphatic vessels and periorbital lymphatic vessels. Second, transport along the myelinated axon spaces within the optic nerve toward the eye. Third, the transport of Aβ accumulated in the brain through the PVS of the CRA in the optic nerve, spreading to the retina. (B) Mechanism of AD-relevant retinal disease resulting from abnormal ocular glymphatic clearance by disrupted AQP4 polarity. In AD patients and 5×FAD mice, Aβ transported via the brain–eye pathway can enter the retina and accumulate through periarterial space in the short term. Over a longer duration, accumulated Aβ can be excreted through the perivenous space-optic nerve meningeal lymphatics pathway. During this process, the accumulated Aβ in the retina is transported from periarterial space to perivenous space and within the veins. Abnormal distribution of AQP4 in the PVS is a key factor causing abnormal accumulation of Aβ in the retina, subsequently triggering glial cell activation, inflammatory responses, retinal atrophy, and visual functional impairments.

References

    1. Arnold, S.E., Lee E.B., Moberg P.J., Stutzbach L., Kazi H., Han L.Y., Lee V.M., and Trojanowski J.Q.. 2010. Olfactory epithelium amyloid-beta and paired helical filament-tau pathology in Alzheimer disease. Ann. Neurol. 67:462–469. 10.1002/ana.21910 - DOI - PMC - PubMed
    1. Asanad, S., Ross-Cisneros F.N., Nassisi M., Barron E., Karanjia R., and Sadun A.A.. 2019. The retina in Alzheimer’s disease: Histomorphometric analysis of an ophthalmologic biomarker. Invest. Ophthalmol. Vis. Sci. 60:1491–1500. 10.1167/iovs.18-25966 - DOI - PMC - PubMed
    1. Bayhan, H.A., Aslan Bayhan S., Celikbilek A., Tanık N., and Gürdal C.. 2015. Evaluation of the chorioretinal thickness changes in Alzheimer’s disease using spectral-domain optical coherence tomography. Clin. Exp. Ophthalmol. 43:145–151. 10.1111/ceo.12386 - DOI - PubMed
    1. Berisha, F., Feke G.T., Trempe C.L., McMeel J.W., and Schepens C.L.. 2007. Retinal abnormalities in early Alzheimer’s disease. Invest. Ophthalmol. Vis. Sci. 48:2285–2289. 10.1167/iovs.06-1029 - DOI - PubMed
    1. Blanks, J.C., Hinton D.R., Sadun A.A., and Miller C.A.. 1989. Retinal ganglion cell degeneration in Alzheimer’s disease. Brain Res. 501:364–372. 10.1016/0006-8993(89)90653-7 - DOI - PubMed

MeSH terms

LinkOut - more resources