. 2024 Nov;11(43):e2403222.
doi: 10.1002/advs.202403222. Epub 2024 Sep 24.

Kidney Injury Evoked by Fine Particulate Matter: Risk Factor, Causation, Mechanism and Intervention Study

Affiliations

Kidney Injury Evoked by Fine Particulate Matter: Risk Factor, Causation, Mechanism and Intervention Study

Tong Hou et al. Adv Sci (Weinh). 2024 Nov.

Abstract

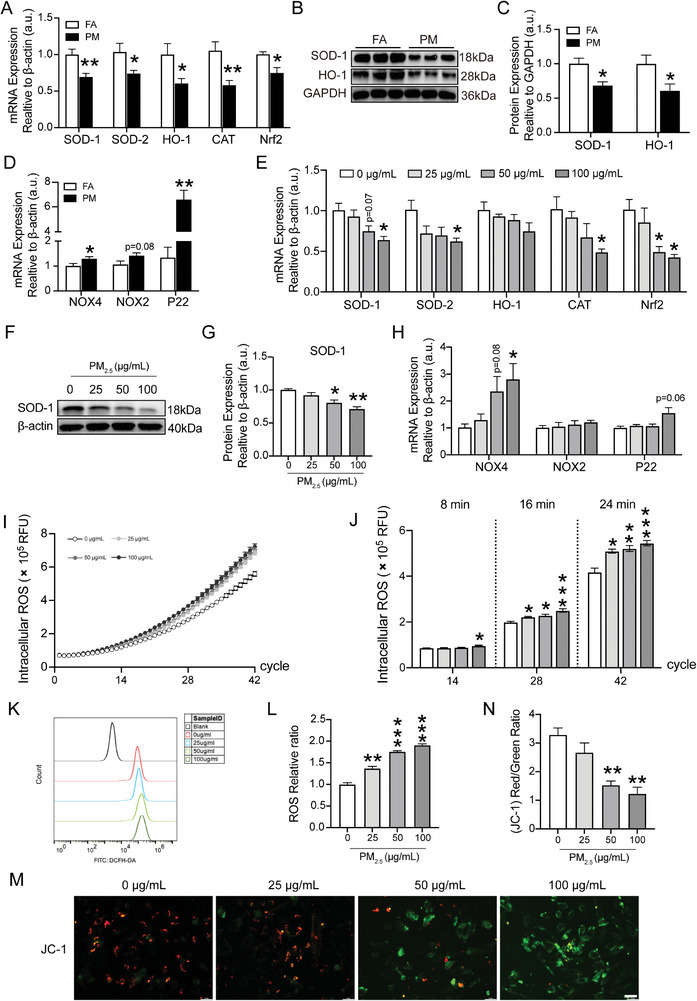
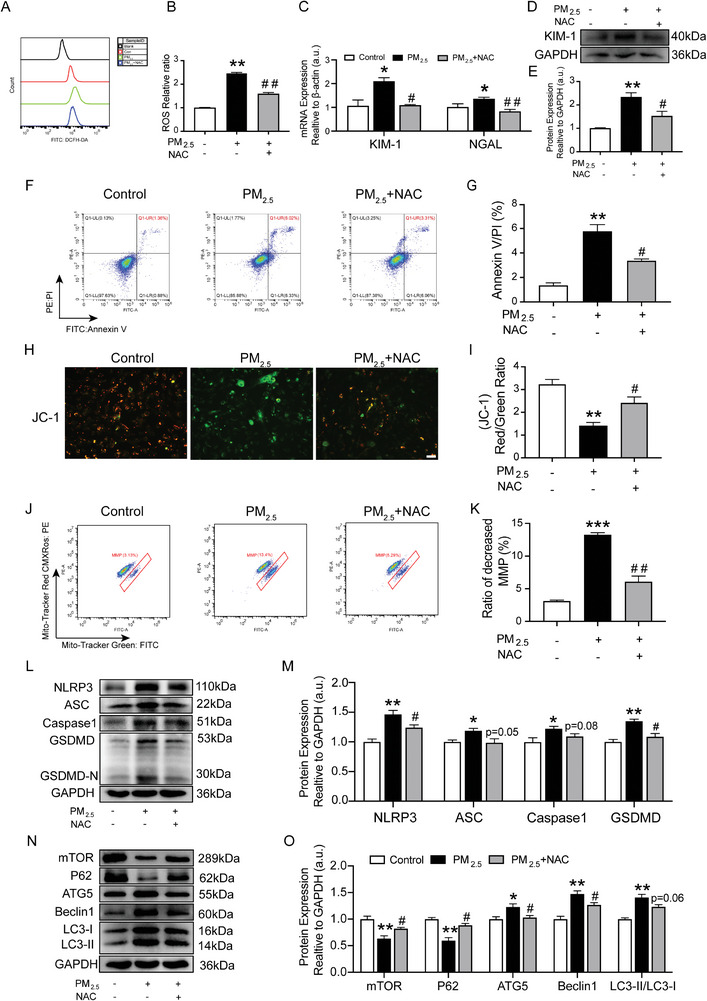
Fine particulate matter (PM2.5) is suggested to pose a severe risk to the kidneys by inducing functional degradation and chronic kidney diseases (CKD). This study aims to explore the nephrotoxicity of PM2.5 exposure and the underlying mechanism. Herein, based on the UK Biobank, it is found that per interquartile range (IQR) increase in PM2.5 is associated with a 6% (95% CI: 1%-11%), 7% (95% CI: 3%-11%), 9% (95% CI: 4%-13%), 11% (95% CI: 9%-13%), and 10% (95% CI: 8%-12%) increase in the risk of nephritis, hydronephrosis, kidney stone, acute renal failure, and CKD, respectively. In experimental study, noticeable kidney injury, which is the initiation of kidney diseases, is observed with PM2.5 exposure in C57BL/6N mice (n = 8), accompanied with oxidative stress, autophagy and pyroptosis. In vitro, HK-2 cells with PM2.5-stimulation exhibit tubulopathy, increased reactive oxygen species (ROS) generation and activated pyroptosis and autophagy. All changes are abolished by ROS scavenger of N-acetyl-L-cysteine (NAC) both in vivo and in vitro. In conclusion, the study provides evidence showing that PM2.5 exposure is associated with 5 kinds of kidney diseases by directly inducing nephrotoxicity, in which ROS may be the potential target by triggering autophagy and pyroptosis.

Keywords: autophagy; fine particulate matter; kidney injury; oxidative stress; pyroptosis.


Conflict of interest statement

The authors declare no conflict of interest.

Figures

Figure 1
Figure 1
PM2.5 exposure induced kidney injury. A) Kidney weight. B) Kidney Coefficient. C) Serum level of CREA, BUN and UA in mice. D) Urine α1‐MG. E) Urine β2‐MG. F) Urine Cys C. G) Urine RBP. H) Urine Protein. I–K) Representative micrographs of renal HE stains, PAS staining and quantification analysis in different groups. Scale bar = 50 µm. Locally enlarged images of kidney tissue sections (scale bar = 20 µm). Yellow arrows mark Dilated renal tubules, blue arrows mark increased inflammatory cells, green arrows mark thylakoid hyperplasia, black arrows mark basement membrane thickening. L) Gene expression of KIM‐1 and NGAL in renal tissues was quantitated using qRT‐PCR. M,N) KIM‐1 levels in urine and serum. O,P) Western blot for renal KIM‐1 protein and quantification analysis. Q,R) Immunofluorescence staining images of KIM‐1 expression in renal sections and quantification analysis. (n = 8) (*p < 0.05, **p < 0.01 and ***p < 0.001 versus FA.).
Figure 2
Figure 2
Effects of PM2.5 exposure on the inflammation, pyroptosis and autophagy in kidneys. (A) Gene expression of IL‐1β, IL‐18 and MCP‐1 in renal tissues was quantitated using qRT‐PCR. (B, C) Western blot for renal IL‐1β protein and quantification analysis. (D) Gene expression of Caspase3, Bax and Bcl‐2 in renal tissues was quantitated using qRT‐PCR. (E, F) Western blot for renal Bax and Bcl‐2 protein and quantification analysis. (G) Gene expression of NLRP3, ASC, Caspase1 and GSDMD in renal tissues was quantitated using qRT‐PCR. (H, I) Western blot for renal NLRP3, ASC, Caspase1 and GSDMD protein and quantification analysis. (J) Gene expression of mTOR, P62, ATG5, Beclin1 and LC3B in renal tissues was quantitated using qRT‐PCR. (K, L) Western blot for renal mTOR, P62, ATG5, Beclin1 and LC3B protein and quantification analysis. (n = 8) (*p < 0.05, **p < 0.01 and ***p < 0.001 versus FA.).
Figure 3
Figure 3
Effects of PM2.5 exposure on the tubulopathy, pyroptosis and autophagy in HK‐2 cells. A) Cell viability of HK‐2 cells treated with different concentration of PM2.5 (5, 10, 25, 50, 100, 200,400 µg mL−1) for 24 h detected by CCK‐8 assay. B) The gene expression of KIM‐1 and NGAL in HK‐2 cells was quantitated using qRT‐PCR. C) The gene expression of IL‐6, TNF‐α, IL‐1β and MCP‐1 in HK‐2 cells was quantitated using qRT‐PCR. D,E) The expression of Bax and Bcl‐2 in HK‐2 cells was analyzed using Western blot and quantification analysis. F) Flow cytometry analysis of apoptosis using Annexin V‐FITC and PI‐PE staining. G) Percentage of apoptosis in each group of HK‐2 cells. H,I) The protein expression of NLRP3, ASC, Caspase1 and GSDMD in HK‐2 cells was analyzed using Western blot and quantification analysis. J,K) The expression of mTOR, P62, ATG5, Beclin1 and LC3B in HK‐2 cells were analyzed using Western blot and quantification analysis. (n = 3) (*p < 0.05, **p < 0.01 versus 0 µg mL−1).
Figure 4
Figure 4
Effects of PM2.5 exposure on the oxidative stress in kidneys and HK‐2 cells. A) Gene expression of SOD‐1, SOD‐2, HO‐1, CAT, and Nrf2 in renal tissues was quantitated using qRT‐PCR. B,C) Western blot for renal SOD‐1 and HO‐1 protein and quantification analysis. D) Gene expression of NOX4, NOX2 and P22 in renal tissues was quantitated using qRT‐PCR. (n = 8) (*p < 0.05, **p < 0.01 versus FA.) E) Gene expression of SOD‐1, SOD‐2, HO‐1, CAT and Nrf2 in HK‐2 cells was quantitated using qRT‐PCR. F,G) The expression of SOD‐1 in HK‐2 cells was analyzed using Western blot and quantification analysis. H) Gene expression of NOX4, NOX2 and P22 in HK‐2 cells was quantitated using qRT‐PCR. I) To assess the production of intracellular ROS, HK‐2 cells were pre‐incubated with DCFH‐DA for 1 h and subsequently incubated with PM2.5 (25, 50, and 100 µg mL−1). Fluorescence was measured in real time over 24 min. Data are expressed as relative fluorescence units (RFU). J) RFU data at 8, 16, and 24 min are plotted as histograms of mean ± SEM of ROS production corresponding to 3 independent experiments. K) The ROS levels of HK‐2 cells were determined by flow cytometry. L) ROS relative ratio of HK‐2 cells in each group. M) Representative images of JC‐I staining of HK‐2 cells. Scale bar = 50 µm. N) Red/green fluorescence ratio of JC‐1 staining of HK‐2 cells in each group. (n = 3) (*p < 0.05, **p < 0.01, and ***p < 0.001 versus 0 µg mL−1).
Figure 5
Figure 5
NAC attenuated the damage of HK‐2 cells and the activation of autophagy and pyroptosis induced by PM2.5.HK‐2 cells were pre‐treated with 5 mM NAC for 1 h and were then treated with 100 µg mL−1 PM2.5 for 24 h. A) The ROS levels of HK‐2 cells were determined by flow cytometry. B) ROS relative ratio of HK‐2 cells in each group. C) Gene expression of KIM‐1 and NGAL in HK‐2 cells was quantitated using qRT‐PCR. D,E) Western blot for KIM‐1 protein and quantification analysis. F) Flow cytometry analysis of apoptosis using Annexin V‐FITC and PI‐PE staining. G) Percentage of apoptosis in each group of HK‐2 cells. H) ΔΨm of PM2.5‐treated HK‐2 cells were measured by JC‐1 staining under a fluorescence microscope. Scale bar = 50 µm. I) Red/green fluorescence ratio of JC‐1 staining of HK‐2 cells in each group. J) HK‐2 cells were labeled with MitoTracker Red and MitoTracker Green using flow cytometric analysis. K) Flow cytometric analysis of the MMP. L,M) The efficiency of NAC, and its effect on the expression of NLRP3, ASC, Caspase1 and GSDMD in PM2.5‐treated HK‐2 cells using Western blot and quantification analysis. N,O) The efficiency of NAC, and its effect on the expression of mTOR, P62, ATG5, Beclin1 and LC3B in PM2.5‐treatment HK‐2 cells using Western blot and quantification analysis. (n = 3) (*p < 0.05, **p < 0.01 versus Control group. # p < 0.05, ## p < 0.01 versus PM2.5 group.).
Figure 6
Figure 6
NAC attenuated PM2.5‐induced kidney injury in mice. A) Kidney weight. B,C) Serum level of CREA and BUN in mice. D) Urine Protein. E) Urine α1‐MG. F) Urine β2‐MG. G) Urine Cys C. H) Urine RBP. I,J) Representative micrographs of renal HE stains, PAS staining and quantification analysis in different groups. Scale bar = 50 µm. Yellow arrows mark Dilated renal tubules, blue arrows mark increased inflammatory cells, green arrows mark thylakoid hyperplasia, black arrows mark basement membrane thickening. K,L) Western blot for renal KIM‐1 protein and quantification analysis. (n = 8) (*p < 0.05, **p < 0.01 and ***p < 0.001 versus FA group. # p < 0.05 versus PM2.5 group.).
Figure 7
Figure 7
NAC attenuated activation of autophagy and pyroptosis induced by PM2.5 in the kidneys. A–C) Representative images and analysis of the mitochondrial oxygen consumption rate (OCR) of the kidney. D,E) Kidney SOD and MDA. F,G) Serum level of 8‐OHdG and 4‐HNE. H,I) Western blot for renal NLRP3, Caspase1 and GSDMD protein and quantification analysis. J,K) Western blot for renal mTOR, P62, ATG5, Beclin1 and LC3B protein and quantification analysis. (n = 8) (*p < 0.05, **p < 0.01, and ***p < 0.001 versus FA group. # p < 0.05, ## p < 0.01 versus PM2.5 group.).
Figure 8
Figure 8
Schematic diagram of mechanisms underlying PM2.5‐induced nephrotoxicity.PM2.5 exposure is associated with increased risk of kidney diseases. Meanwhile, PM2.5 induces the generation of ROS, accompanied with activation of autophagy and pyroptosis, followed by the release of many inflammatory factors, such as IL‐1β and IL‐18, resulting in the occurrence of kidney injury.

References

    1. a) Liu F., Chen G., Huo W., Wang C., Liu S., Li N., Mao S., Hou Y., Lu Y., Xiang H., Environ. Pollut. 2019, 252, 1235; - PubMed
    2. b) Yitshak‐Sade M., Nethery R., Schwartz J. D., Mealli F., Dominici F., Di Q., Abu Awad Y., Ifergane G., Zanobetti A., Sci. Total Environ. 2021, 755, 142524. - PMC - PubMed
    1. a) Lin S. Y., Ju S. W., Lin C. L., Hsu W. H., Lin C. C., Ting I. W., Kao C. H., Environ. Pollut. 2020, 261, 114154; - PubMed
    2. b) Bowe B., Artimovich E., Xie Y., Yan Y., Cai M., Al‐Aly Z., BMJ Glob Health 2020, 5, e002063; - PMC - PubMed
    3. c) Li G., Huang J., Wang J., Zhao M., Liu Y., Guo X., Wu S., Zhang L., J. Am. Soc. Nephrol. 2021, 32, 448; - PMC - PubMed
    4. d) Wu Y. H., Wu C. D., Chung M. C., Chen C. H., Wu L. Y., Chung C. J., Hsu H. T., Front. Public Health 2022, 10, 858655. - PMC - PubMed
    1. Romagnani P., Remuzzi G., Glassock R., Levin A., Jager K. J., Tonelli M., Massy Z., Wanner C., Anders H. J., Nat. Rev. Dis. Primers 2017, 3, 17088. - PubMed
    1. Jourde‐Chiche N., Fakhouris F., Dou L., Bellien J., Burtey S., Frimat M., Jarrot P. A., Kaplanski G., Le Quintrec M., Pernin V., Rigothier C., Sallée M., Fremeaux‐Bacchi V., Guerrot D., Roumenina L. T., Nat. Rev. Nephrol. 2019, 15, 87. - PubMed
    1. Yao L., Liang X., Qiao Y., Chen B., Wang P., Liu Z., Metabolism. 2022, 131, 155195. - PubMed

MeSH terms