. 2024 Sep 24;134(22):e181095.
doi: 10.1172/JCI181095.

Stimulation of an entorhinal-hippocampal extinction circuit facilitates fear extinction in a post-traumatic stress disorder model

Affiliations

Stimulation of an entorhinal-hippocampal extinction circuit facilitates fear extinction in a post-traumatic stress disorder model

Ze-Jie Lin et al. J Clin Invest. .

Abstract

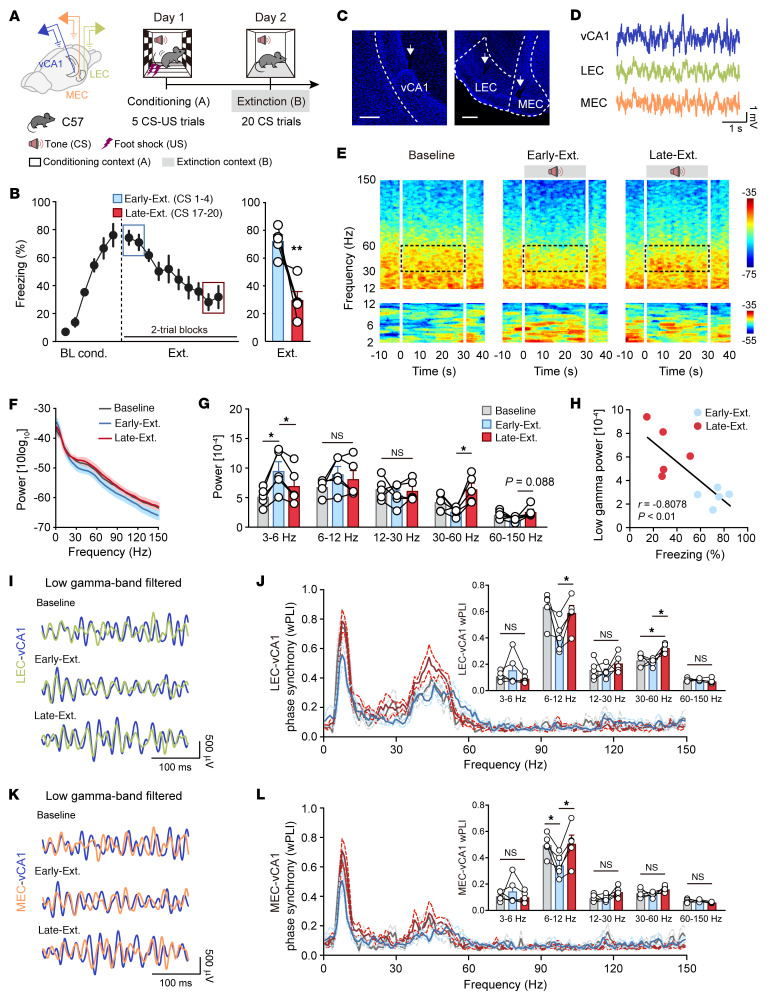
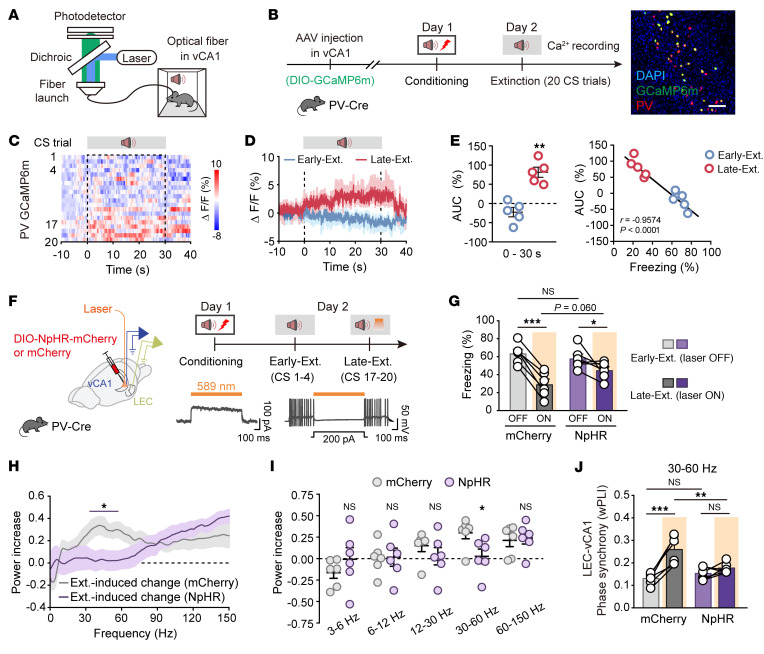
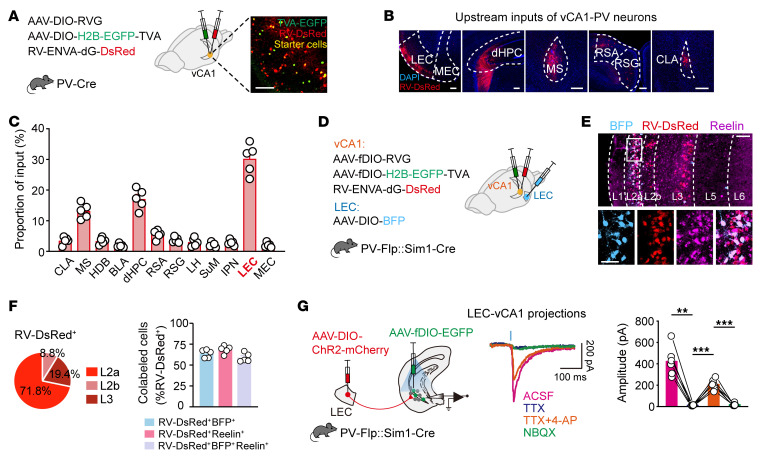
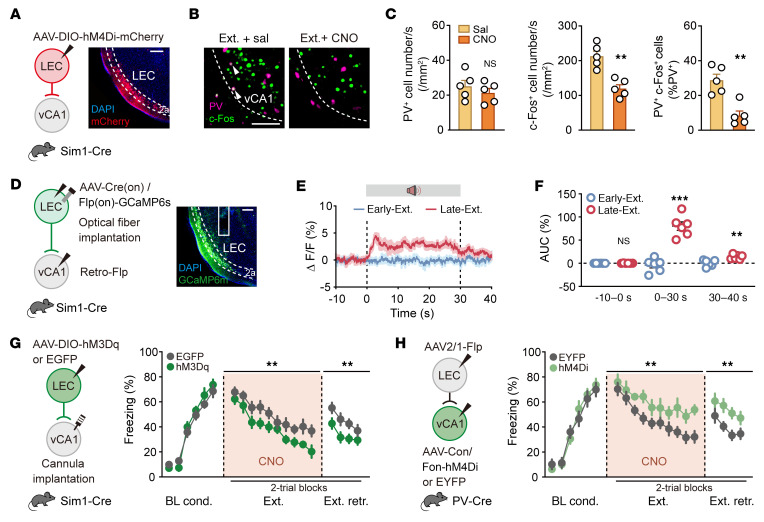
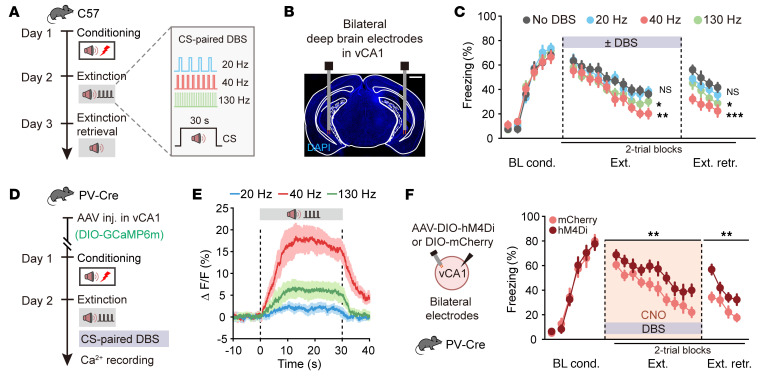
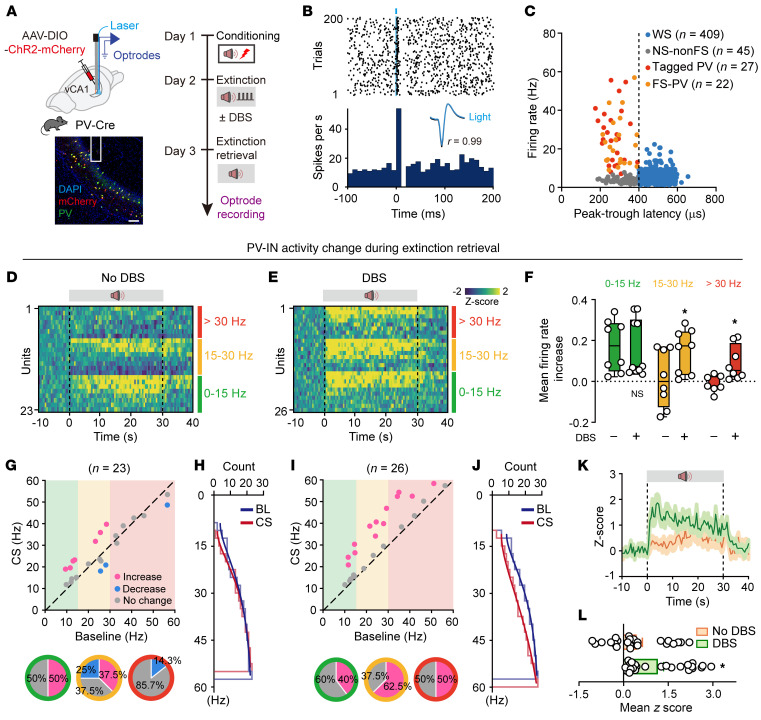
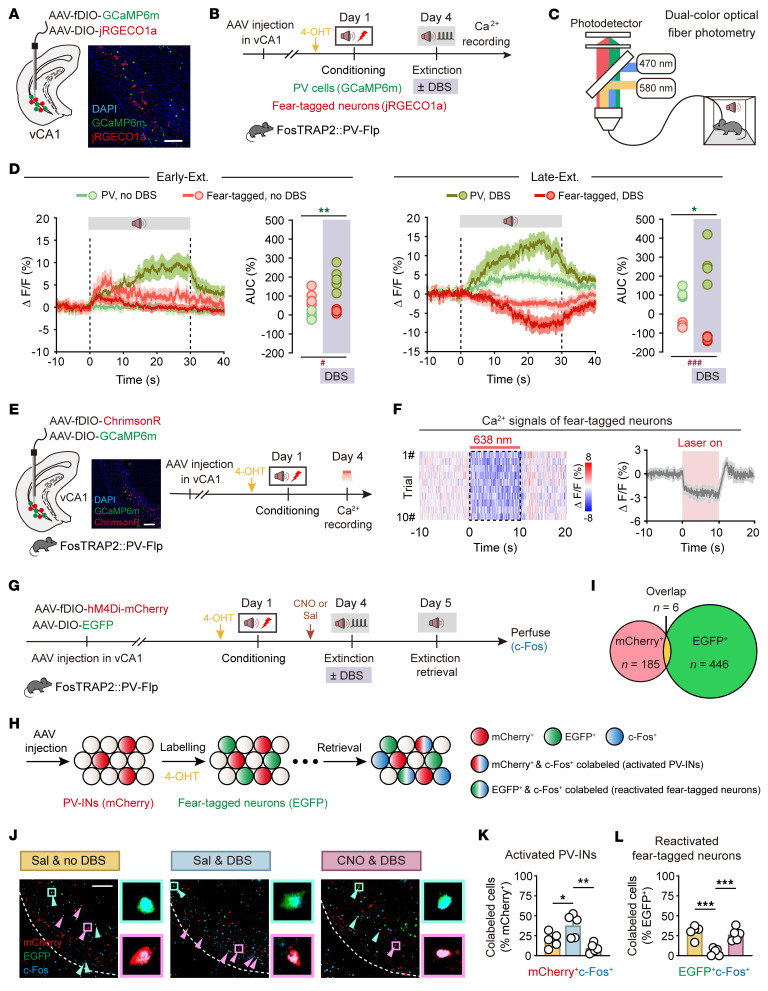
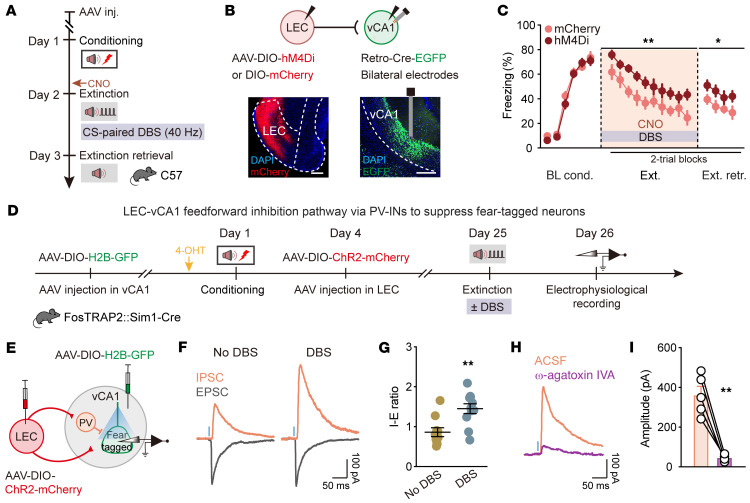
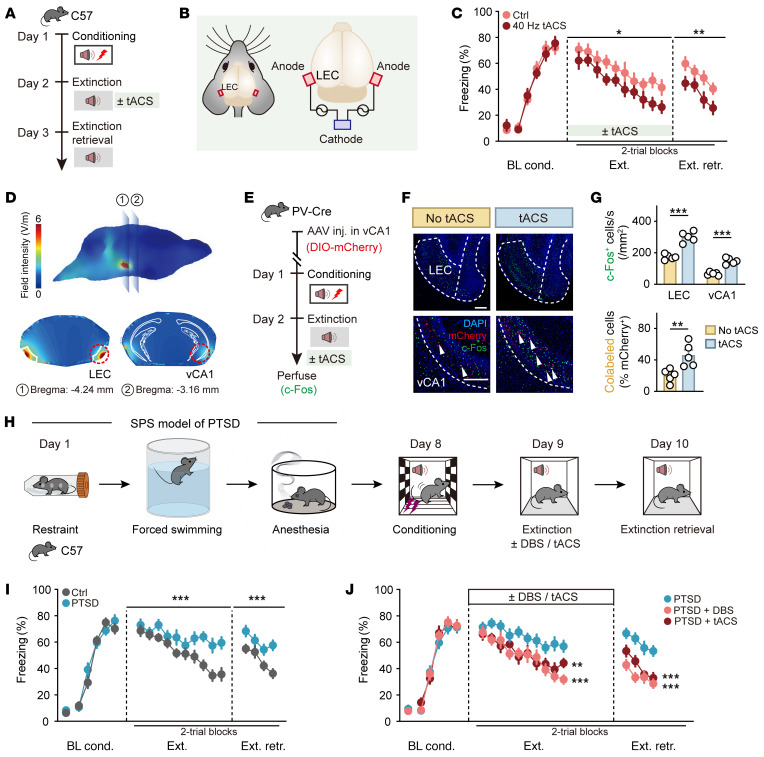
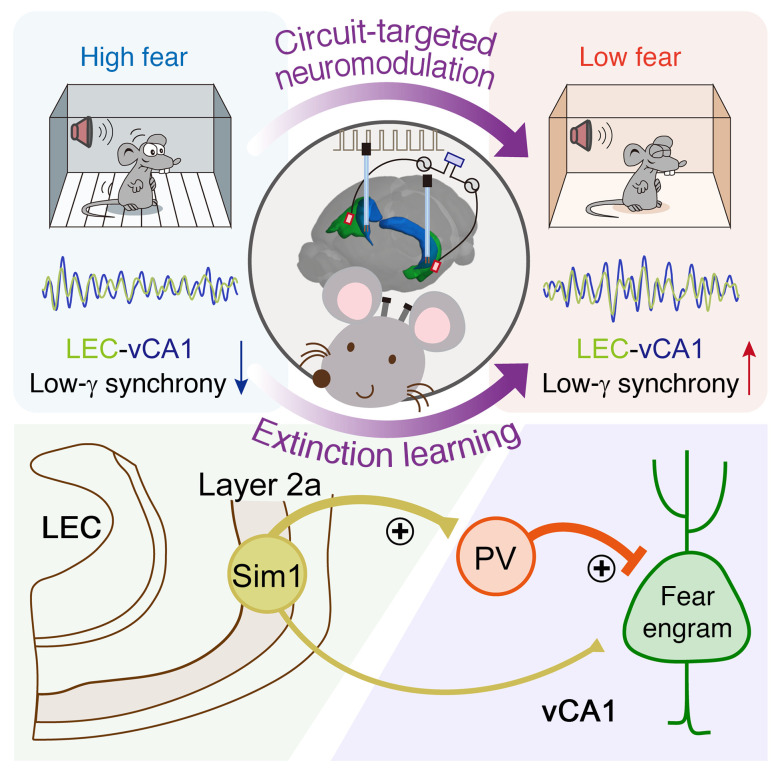
Effective psychotherapy of post-traumatic stress disorder (PTSD) remains challenging owing to the fragile nature of fear extinction, for which the ventral hippocampal CA1 (vCA1) region is considered as a central hub. However, neither the core pathway nor the cellular mechanisms involved in implementing extinction are known. Here, we unveil a direct pathway, where layer 2a fan cells in the lateral entorhinal cortex (LEC) target parvalbumin-expressing interneurons (PV-INs) in the vCA1 region to propel low-gamma-band synchronization of the LEC-vCA1 activity during extinction learning. Bidirectional manipulations of either hippocampal PV-INs or LEC fan cells sufficed for fear extinction. Gamma entrainment of vCA1 by deep brain stimulation (DBS) or noninvasive transcranial alternating current stimulation (tACS) of LEC persistently enhanced the PV-IN activity in vCA1, thereby promoting fear extinction. These results demonstrate that the LEC-vCA1 pathway forms a top-down motif to empower low-gamma-band oscillations that facilitate fear extinction. Finally, application of low-gamma DBS and tACS to a mouse model with persistent PTSD showed potent efficacy, suggesting that the dedicated LEC-vCA1 pathway can be stimulated for therapy to remove traumatic memory trace.

Keywords: Mouse models; Neuroscience; Psychiatric diseases; Therapeutics.


Figures

Figure 1
Figure 1. Fear extinction recruits low-gamma oscillatory synchrony between the LEC and vCA1.
(A) Schematics of electrode implantation and experimental design for mice subject to fear conditioning (context A) and extinction training (context B). (B) Left: Time courses of freezing responses to the CS during fear conditioning and extinction training. Right: Freezing responses to the CS during early extinction training (CS1–4, referred to as Early-Ext.) and late extinction training (CS17–20, referred to as Late-Ext.). Data are mean ± SEM. n = 5 mice. **P < 0.01. (C) Representative images showing electrode placements. Scale bars: 200 μm. (D) Representative traces of LFP recordings. (E) Representative spectrograms of LFP recorded in vCA1 during Baseline (left), Early-Ext. (middle), and Late-Ext. (right) sessions. Zero to thirty seconds represents the tone given during extinction training. (F) Power spectrum of vCA1 LFP during Baseline, Early-Ext., and Late Ext. Solid lines represent averages and shaded areas indicate SEM. (G) Average power of vCA1 LFP during Baseline, Early-Ext., and Late Ext. Data are mean ± SEM. n = 5. *P < 0.05. (H) Linear regression of freezing responses versus vCA1 low-gamma power during Early-Ext. and Late Ext. sessions. (I) Examples of low-gamma-frequency filtered LEC and vCA1 LFP recordings recorded during Baseline, Early-Ext., and Late Ext. sessions. (J) Phase synchrony for LEC-vCA1 LFPs in the Baseline, Early-Ext., and Late-Ext. sessions, respectively. Inset shows different phase synchrony quantified using the weighted phase lag index (wPLI) between LEC and vCA1 LFPs. Data are mean ± SEM. n = 5. *P < 0.05. (K and L) The same as I and J for MEC-vCA1 LFPs and wPLI. n = 5. *P < 0.05. Paired Student’s t test (B) and repeated-measures 1-way ANOVA with Tukey’s multiple-comparison test (G, J, and L).
Figure 2
Figure 2. Activation of vCA1 PV-INs is required for LEC-vCA1 low-gamma synchronization during late extinction.
(A) Schematic illustration. (B) Schematic of AAV injections and experimental design, as well as immunostaining confirming specificity of GCaMP6m expression in the PV-INs. Scale bar: 100 μm. (C) Heatmap of calcium signals in the PV-INs during extinction training. (D) Average PV-IN GCaMP signals. Data are mean ± SEM. n = 5 mice. (E) Activity of the PV-INs (area under the curve [AUC]) and correlation of freezing responses with the Ca2+ signals. Data are mean ± SEM. **P < 0.01. (F) Schematics of stereotaxic surgery and experimental design. (G) Freezing responses to the CS during Early-Ext. and Late-Ext. n = 6 mice per group. Data are mean ± SEM. *P < 0.05, ***P < 0.001, light × group interaction, F1,10 = 9.356, P = 0.0121. (H) Extinction-induced changes in power spectrum of vCA1 LFP. Shown is mean ± SEM of power (Late-Ext. – Early-Ext.)/(Late-Ext. + Early-Ext.). n = 6 mice per group. Purple line indicates frequencies with a significant effect (*P < 0.05 with Bonferroni’s correction for multiple comparisons). (I) Average power increase of vCA1 LFP. Data are mean ± SEM. n = 6 mice per group. Main effect of AAV, F1,10 = 0.122, P = 0.7341. *P < 0.05. (J) Low-gamma phase synchrony quantified using the wPLI between LEC and vCA1 LFPs. Data are mean ± SEM. n = 6 mice per group. **P < 0.01, ***P < 0.001, light × group interaction, F1,10 = 15.80, P = 0.0026. Paired Student’s t test (E), repeated-measures 2-way ANOVA with Šidák’s multiple-comparison test (G and J), Wilcoxon’s signed-rank test with Bonferroni correction for multiple comparisons (H), and repeated-measures 2-way ANOVA and unpaired Student’s t test (I).
Figure 3
Figure 3. vCA1 PV-INs receive strong excitatory inputs from Sim1+ fan cells in LEC layer 2a.
(A) Schematic of AAV injections and experimental design (left) and a representative image of TVA-EGFP and RV-DsRed expression (right). Scale bar: 100 μm. (B) Representative images of the main upstream inputs. Scale bars: 200 μm. (C) Distribution of RV-DsRed–labeled neurons. n = 5 mice. CLA, claustrum; MS, medial septal nucleus; HDB, nucleus of the horizontal limb of the diagonal band; BLA, basolateral amygdalar nucleus; dHPC, dorsal hippocampus; RSA, retrosplenial agranular cortex; RSG, retrosplenial granular cortex; LH, lateral hypothalamic; SuM, supramammillary nucleus; IPN, interpeduncular nucleus; LEC, lateral entorhinal cortex; MEC, medial entorhinal cortex. (DF) LEC layer 2a–vCA1 PV-IN projectors are Sim1+ fan cells. (D) Schematic of AAV injections. (E) Representative images of BFP+ (blue), RV-DsRed+ (red), and Reelin+ (purple) immunofluorescence in LEC. Scale bars: 100 μm (top), 50 μm (bottom). (F) LEC neurons projecting to vCA1 PV-INs are mainly located in layer 2a (left) and are characterized by the expression of Reelin (right). n = 5. (G) Patch clamp recordings of activity of vCA1 PV-INs in brain slices upon optogenetic stimulation of LEC layer 2a–vCA1 projection (left), showing example traces evoked by blue lights in the presence of ACSF, TTX (1 μM), TTX plus 4-AP (100 μM), and NBQX (10 μM). The blue vertical bar above traces indicates photostimulation. n = 6 neurons. **P < 0.01, ***P < 0.001, repeated-measures 1-way ANOVA with Tukey’s multiple-comparison test.
Figure 4
Figure 4. Direct projection from LEC Sim1+ layer 2a fan cells to vCA1 PV-INs mediates fear extinction.
(A) Schematic of AAV injections and experimental design (left) and representative image of mCherry expression (right). CNO was administered (i.p.) 30 minutes before extinction training. Scale bar: 200 μm. (B) Representative images of PV+ (purple) and c-Fos+ (green) immunofluorescence. White arrowheads denote colabeled cells. Scale bar: 100 μm. (C) Quantification for B. n = 5 mice per group. (DF) Ca2+ recording of the LEC-vCA1 pathway during extinction. (D) Schematic of AAV injections and fiber implantation (left), with representative images of GCaMP6s expression (right). Scale bar: 200 μm. (E) Average calcium signals during Early-Ext. and Late-Ext. (F) Activity of Ca2+ signals (AUC) during Early-Ext. and Late-Ext. Data are mean ± SEM. n = 6 mice. (G and H) Effects of stimulating LEC layer 2a→vCA1 projection (G) and inhibiting LEC→vCA1 PV-IN projection (H) on extinction. Left: Schematic of AAV injections. Right: Time courses of freezing responses to the CS. Statistics are as follows: Main effect of AAV: (G) Conditioning, F1,17 = 1.157, P = 0.2971; extinction training, F1,17 = 8.686, P = 0.0090; extinction retrieval, F1,17 = 9.781, P = 0.0061. EGFP group, n = 10 mice; hM3Dq group, n = 9 mice. (H) Conditioning, F1,14 = 0.1024, P = 0.7537; extinction training, F1,14 = 14.23, P = 0.0021; extinction retrieval, F1,14 = 12.46, P = 0.0033. EYFP group, n = 8 mice; hM4Di group, n = 8 mice. Data are mean ± SEM. **P < 0.01, ***P < 0.001. Unpaired Student’s t test (C), paired Student’s t test (F), and repeated-measures 2-way ANOVA (G and H).
Figure 5
Figure 5. Long-term extinction promotion induced by low-gamma DBS depends on the activation of vCA1 PV-INs.
(A) Schematics of experimental design. (B) Representative image showing electrode placements. Scale bar: 1 mm. (C) Time courses of freezing responses to the CS during fear conditioning, extinction training, and extinction retrieval. Statistics are as follows: Main effect of DBS frequency, conditioning, F3,34 = 0.3943, P = 0.7579. No DBS vs. 20 Hz DBS, extinction training, F1,16 = 0.3954, P = 0.5383; extinction retrieval, F1,16 = 2.126, P = 0.1642. No DBS vs. 40 Hz DBS, extinction training, F1,16 = 12.91, P = 0.0024; extinction retrieval, F1,16 = 24.91, P = 0.0001. No DBS vs. 130 Hz DBS, extinction training, F1,16 = 5.237, P = 0.0360; extinction retrieval, F1,16 = 5.192, P = 0.0368. No DBS group, n = 8 mice; 20 Hz DBS group, n = 10 mice; 40 Hz DBS group, n = 10 mice; 130 Hz DBS group, n = 10 mice. (D) Schematic of AAV injections and experimental design. (E) Average calcium signals in PV-INs during extinction training paired with DBS of different frequencies. 20 Hz group, n = 5 mice; 40 Hz group, n = 5 mice; 130 Hz group, n = 6 mice. (F) Effect of inhibiting vCA1 PV-INs on DBS-induced extinction promotion. Time courses of freezing responses to the CS during fear conditioning, extinction training, and extinction retrieval. Statistics are as follows: Main effect of AAV, conditioning, F1,18 = 0.0015, P = 0.9699; extinction training, F1,18 = 12.56, P = 0.0023; extinction retrieval, F1,18 = 14.80, P = 0.0012. n = 10 mice per group. Data are mean ± SEM. *P < 0.05, **P < 0.01, ***P < 0.001. Repeated-measures 2-way ANOVA (C and F).
Figure 6
Figure 6. Extinction training paired with low-gamma DBS induces sustained activation of high-firing-rate vCA1 PV-INs during extinction retrieval.
(A) Schematics of experimental design (top) and representative image of virus expression (bottom). Scale bar: 100 μm. (B) Raster plot (top) and peri-stimulus time histogram (bottom) of representative tagged PV-INs. In the inset, light-evoked spike waveforms (blue) were similar to spontaneous ones (black). Pearson’s correlation, r = 0.99. (C) Classification of recorded vCA1 neurons into wide spike (WS) putative pyramidal cells (blue circles), narrow spike–non-fast-spiking (NS-nonFS) (gray circles), tagged PV (red circles), and FS-PV (orange circles) based on peak-to-trough latency and baseline firing rate. (D and E) Heatmaps showing responses of PV-INs with different baseline firing rates during extinction retrieval. (F) Box plots of firing rate changes. The center line shows median, box edges indicate top and bottom quartiles, and whiskers extend to minimum and maximum values. Circles denote individual neurons. *P < 0.05. (G and H) Correlation of firing rate at baseline and during CS for individual PV-INs from no-DBS-manipulation mice. (I and J) The same as G and H for the correlation of firing rate during baseline (BL) and CS for individual PV-INs from DBS-manipulation mice. (K and L) Z-scored signal changes of PV-INs during extinction retrieval. Orange indicates no DBS manipulation during extinction training, and green indicates 40 Hz DBS manipulation during extinction training. Data are mean ± SEM. *P < 0.05. Unpaired Student’s t test (F and L).
Figure 7
Figure 7. Extinction training paired with low-gamma DBS engages vCA1 PV-INs to suppress fear-tagged neurons.
(A) Schematic of AAV injections and representative image of virus expression. Scale bar: 100 μm. (B and C) Schematics of experimental design. (D) Average calcium signals in PV-INs and fear-tagged neurons during Early-Ext. (left) and Late-Ext (right). *P < 0.05, **P < 0.01, PV-INs DBS vs. PV-INs no DBS, unpaired Student’s t test; #P < 0.05, ###P < 0.001, fear-tagged neurons, DBS vs. no DBS. n = 5 mice per group. (E) Schematics of AAV injections and experimental design. Representative images of GCaMP6m expression in fear-tagged neurons and ChrimsonR expression in PV-INs in vCA1. Scale bar: 100 μm. (F) Left: Representative heatmap of fiber photometry recordings. Right: Averaged fluorescence decreased in response to optogenetic stimulation (n = 5 mice). (G) Schematic of AAV injections and experimental design. Administration of 4-OHT, 30 minutes before fear conditioning (i.p.), to FosTRAP2 PV-Flp mice was used to induce permanent expression of EGFP in neurons active around the time of the injection. (H) Genetic design to investigate fear-tagged neurons and neurons activated during extinction retrieval. Red circles represent PV-INs, green circles represent neurons labeled during conditioning, and blue circles represent neurons activated during memory retrieval. (I) Overlap between vCA1 PV-INs (mCherry+) and fear-tagged neurons (EGFP+). (J) Representative images of mCherry+ (red), EGFP+ (green), and c-Fos+ (blue) immunofluorescence in vCA1. Magenta arrowheads denote colabeled mCherry+c-Fos+ cells; cyan arrowheads denote colabeled EGFP+c-Fos+ cells. Circles represent enlarged images on the right. Scale bar: 100 μm. (K and L) The percentage of activated PV-INs (mCherry+c-Fos+) and reactivated fear-tagged neurons (EGFP+c-Fos+). Data are mean ± SEM. *P < 0.05, **P < 0.01, ***P < 0.001. Unpaired Student’s t test (D) and 1-way ANOVA with Tukey’s multiple-comparison test (K and L).
Figure 8
Figure 8. Low-gamma DBS strengthens the inputs from LEC driving PV IN–mediated feedforward inhibition in vCA1 and induces long-lasting suppression of fear-tagged neurons.
(A) Schematic of experimental design. CS is paired with 40 Hz DBS during extinction training, and CNO was administered (i.p.) 30 minutes before extinction training. (B) Schematic of AAV injections (top) and representative images of virus expression (bottom). Scale bars: 200 μm. (C) Effect of inhibiting LEC-vCA1 projectors on DBS-induced extinction promotion. Time courses of freezing responses to the CS during fear conditioning, extinction training, and extinction retrieval sessions. Statistics are as follows: Main effect of AAV, conditioning, F1,21 = 0.4901, P = 0.4916; extinction training, F1,21 = 8.408, P = 0.0086; extinction retrieval, F1,21 = 7.556, P = 0.0120. mCherry group, n = 12 mice; hM4Di group, n = 11 mice. Data are mean ± SEM. *P < 0.05, **P < 0.01. (D) Schematic of AAV injections and experimental design. 4-OHT was administered 30 minutes before fear conditioning. (E) Experimental scheme for simultaneous recording of light-evoked EPSCs and IPSCs on vCA1 fear-tagged neurons. (F) Representative traces of EPSCs and IPSCs evoked by optogenetic stimulation of LEC fibers. (G) IPSC/EPSC peak ratios (No DBS, n = 10 cells; DBS, n = 11 cells). Data are mean ± SEM. **P < 0.01. (H) Representative traces showing that light-evoked IPSC amplitudes were reduced with application of 0.5 μM ω-agatoxin IVA. (I) Light-evoked IPSC amplitudes in vCA1 fear-tagged neurons with and without ω-agatoxin IVA (n = 5 cells). Data are mean ± SEM. **P < 0.01. Repeated-measures 2-way ANOVA (C), unpaired Student’s t test (G), and paired Student’s t test (I).
Figure 9
Figure 9. Low-gamma stimulation of LEC vCA1 circuit enhances fear extinction, even under more traumatic conditions.
(A and E) Schematics of experimental design. (B) Schematic diagram of stimulus configuration. (C) Time courses of freezing responses to the CS. Statistics are as follows: Main effect of tACS, conditioning, F1,14 = 0.0331, P = 0.8582; extinction training, F1,14 = 8.055, P = 0.0132; extinction retrieval, F1,14 = 15.87, P = 0.0014. n = 8 mice per group. (D) Predicted current density map at the surface of the brain during tACS (top) and slice images of the distribution showing peak current densities during tACS (bottom). (F) Representative images of mCherry+ (red) and c-Fos+ (green) immunofluorescence. White arrowheads denote colabeled cells. Scale bars: 200 μm. (G) Quantification for F. n = 5 mice per group. (H) Schematic illustration of single prolonged stress (SPS) and the fear conditioning paradigm. (I and J) Time courses of freezing responses to the CS. Statistics are as follows: (I) Main effect of treatment, conditioning, F1,16 = 0.2782, P = 0.6051; extinction training, F1,16 = 22.92, P = 0.0002; extinction retrieval, F1,16 = 38.08, P < 0.0001. n = 9 mice per group. (J) PTSD vs. PTSD + DBS, conditioning, F1,16 = 0.5860, P = 0.4551; extinction training, F1,16 = 16.79, P = 0.0008; extinction retrieval, F1,16 = 70.31, P < 0.0001. PTSD vs. PTSD + tACS, conditioning, F1,15 = 0.5624, P = 0.4649; extinction training, F1,15 = 14.42, P = 0.0018; extinction retrieval, F1,15 = 30.04, P < 0.0001. PTSD group, n = 9 mice; PTSD + DBS group, n = 9 mice; PTSD + tACS group, n = 8 mice. Data are mean ± SEM. *P < 0.05, **P < 0.01, ***P < 0.001. Repeated-measures 2-way ANOVA (C, I, and J) and unpaired Student’s t test (G).
Figure 10
Figure 10. Scheme for a direct LEC-vCA1 projection pathway and the role of low-gamma oscillations and inter-regional entrainment in driving fear extinction, orchestrated by vCA1 PV-INs.
This cortical-subcortical motif can be therapeutically targeted through either vCA1 DBS or LEC tACS to enhance feedforward inhibition of fear-tagged neurons, thereby augmenting extinction to remove traumatic memories.

References

    1. Bouton ME, et al. Behavioral and neurobiological mechanisms of pavlovian and instrumental extinction learning. Physiol Rev. 2021;101(2):611–681. doi: 10.1152/physrev.00016.2020. - DOI - PMC - PubMed
    1. Ressler KJ, et al. Post-traumatic stress disorder: clinical and translational neuroscience from cells to circuits. Nat Rev Neurol. 2022;18(5):273–288. doi: 10.1038/s41582-022-00635-8. - DOI - PMC - PubMed
    1. Liu Y, et al. Memory trace for fear extinction: fragile yet reinforceable. Neurosci Bull. 2024;40(6):777–794. doi: 10.1007/s12264-023-01129-3. - DOI - PMC - PubMed
    1. Peters J, et al. Induction of fear extinction with hippocampal-infralimbic BDNF. Science. 2010;328(5983):1288–1290. doi: 10.1126/science.1186909. - DOI - PMC - PubMed
    1. Wang Q, et al. Fear extinction requires ASIC1a-dependent regulation of hippocampal-prefrontal correlates. Sci Adv. 2018;4(10):eaau3075. doi: 10.1126/sciadv.aau3075. - DOI - PMC - PubMed