. 2024 Dec 2;223(12):e202310157.
doi: 10.1083/jcb.202310157. Epub 2024 Sep 24.

Forebrain Eml1 depletion reveals early centrosomal dysfunction causing subcortical heterotopia

Affiliations

Forebrain Eml1 depletion reveals early centrosomal dysfunction causing subcortical heterotopia

Donia Zaidi et al. J Cell Biol. .

Abstract

Subcortical heterotopia is a cortical malformation associated with epilepsy, intellectual disability, and an excessive number of cortical neurons in the white matter. Echinoderm microtubule-associated protein like 1 (EML1) mutations lead to subcortical heterotopia, associated with abnormal radial glia positioning in the cortical wall, prior to malformation onset. This perturbed distribution of proliferative cells is likely to be a critical event for heterotopia formation; however, the underlying mechanisms remain unexplained. This study aimed to decipher the early cellular alterations leading to abnormal radial glia. In a forebrain conditional Eml1 mutant model and human patient cells, primary cilia and centrosomes are altered. Microtubule dynamics and cell cycle kinetics are also abnormal in mouse mutant radial glia. By rescuing microtubule formation in Eml1 mutant embryonic brains, abnormal radial glia delamination and heterotopia volume were significantly reduced. Thus, our new model of subcortical heterotopia reveals the causal link between Eml1's function in microtubule regulation and cell position, both critical for correct cortical development.


Conflict of interest statement

Disclosures: The authors declare no competing interests exist.

Figures
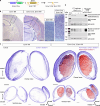
Figure S1.
Figure S1.
Forebrain inactivation of Eml1 leads to subcortical heterotopia in mouse. (A) Schematic representation of the alleles used to generate Eml1 cKO animals. (B) Cresyl violet staining of individual brains at 8 wk showing SH (red outline) in homozygote mutant animals. (C) Representative images of SatB2 immunofluorescence in 3D visualized by light-sheet microscopy in a control E18.5 embryo compared to an Eml1 cKO. No heterotopia can be detected in the control. The homotopic cortex is depicted in transparency (purple) and the heterotopia is shown with a solid rendering (red). Three different angles are shown. (D) Western blot analyses showing that Eml1 expression is lost in P7 cortices. Specific anti-Eml1 antibodies 3E8 are shown in upper panels, and C3GTX in lower panels. Scale bars (equivalent for WT and cKO): 250 µm in B (main); 100 µm in B inset; 500 µm in C. Source data are available for this figure: SourceData FS1.
Figure 1.
Figure 1.
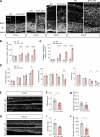
Pax6+ cells start to detach during early corticogenesis with PC defects observed earlier in the Eml1 cKO mouse model. (A) Representative images of immunolabelling for Pax6 in WT and Eml1 cKO embryonic brain coronal sections from E12.5 to E15.5. (B and C) Quantifications of Pax6+ cell counts per region of interest (ROI of 200 µm width) and C proportion of detached Pax6+ cells above the VZ, expressed as mean ± SEM. (D) Quantifications of cortical wall thickness (CW), ventricular zone thickness (VZ), and the ratio of VZ/CW in percentage, represented as mean ± SEM. Analyses performed at least on three individuals from two different litters and two sections per individual for each genotype and age. (E) Representative images of immunolabeling for Arl13b at the ventricular surface at E12.5 for WT and Eml1 cKO. (F and G) Quantification of cilia mean size and number at E12.5, expressed as mean ± SEM. (H–J) Similar analyses performed at E15.5 with five individuals per genotype and age, analyzed from three different litters. Test and significance: Two-way ANOVA, Sidak’s multiple comparison (Pax6 analyses, CW and VZ thickness [data distribution was assumed to be normal but this was not formally tested]), Mann-Whitney (Arl13b analyses). P value <0.05 *, <0.01 **, <0.001 ***, <0.0001 ****. Scale bars (equivalent for WT and cKO): 30 µm in A, 20 µm in E and 10 µm in H.
Figure 2.
Figure 2.
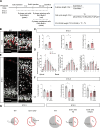
Abnormal detachment of RG occurs at early but not mid-corticogenesis. (A and B) Representative images and, Quantification of the distribution of GFP+Pax6+ cells in the VZ or outside the VZ between WT and Eml1 cKO brains 1 day post-IUE, at E13.5. (C and D) Representative images and Quantification of the distribution of GFP+Pax6+ cells in the VZ or outside the VZ between WT and Eml1 cKO brains 1 day post-IUE, at E15.5. Histograms show mean ± SEM. Boxes with dotted lines indicate the areas of higher magnification images displayed. Arrows indicate GFP+Pax6+ double positive cells. N = 5 for each condition from 3 to 4 litters. Test and significance: Two-way ANOVA, Sidak’s multiple comparison test. Data passed normality test. P value <0.0001 ****. Scale bars (A and C, equivalent for WT and cKO): 50 µm (for main and insets).
Figure 3.
Figure 3.
Cell cycle analyses of Pax6+ cells in E12.5 and E15.5 WT and Eml1 cKO brains. (A) Schematic representation of EdU and BrdU injections performed for cell cycle analyses and related formulae to calculate duration of S-phase and the cell cycle. (B) Representative images of EdU/BrdU/Pax6 labeling of E12.5 coronal brain slices from WT and Eml1 cKO. (C) Quantifications of S-phase length (Ts), cell cycle length (Tc), G1+G2+M length in hours at E12.5, expressed as mean ± SEM. (D) Distribution of cells in the E12.5 cortical wall divided into six identical bins. Distributions are shown for cells entering in S-phase, maintained in S-phase and for those that exit S-phase, expressed as mean ± SEM. (E and F) Similar analyses performed at E15.5, comparing mutant cells in the VZ and outside. (G) Schematic representation of cell cycle phase lengths for results obtained at E12.5 and E15.5 in WT and Eml1 cKO embryos. Analysis was performed on five individuals from 3 litters per genotype and two ROI were analyzed per individual. Test and significance: Mann-Whitney, Two-way ANOVA, Dunn’s post test (distribution analyses: data passed normality test). P value <0.05 *, <0.01 **. Scale bars (equivalent for WT and cKO): 15 μm at E12.5 and 30 μm at E15.5.
Figure S2.
Figure S2.
Altered proportion of cells in cell cycle phases in Eml1 mutant conditions. (A) Examples of PCNA and Ki67 labeling patterns (cropped nuclei) for different cell cycle phases, punctate Ki67, or PCNA are indicated with a red arrow. (B) Representative images for PCNA and Ki67 labeling at E12.5 in WT and Eml1 cKO cells in the VZ. (C) Quantification for the percentage of proliferating cells in S, G1, or G2/M phases of the cell cycle expressed as mean ± SEM. n = 6 individuals per genotype at E12.5. (D and E) Similar analyses were performed at E15.5, with n = 5 individuals per genotype. Test and significance: Two-way ANOVA, Sidak’s multiple comparison (E12.5), Tukey’s post-test at (E15.5). Data passed normality test. P value <0.05 *, <0.001 *** Scale bar (equivalent for WT and cKO): 30 µm.
Figure S3.
Figure S3.
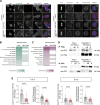
BioID and gene ontology analyses of WT and T243A Eml1 interacting partners, Cep170 cell analyses. (A) Centrosomes were carefully checked in transfected Neuro2A cells, in interphase and during mitosis. No obvious abnormalities were identified. (B and C) Gene ontology (GO) annotation grouped into molecular function (B) and cellular component (C) of EML1 and EML1*T243A proximal interactors. (D) Representative immunoblots of coimmunoprecipitation of EML1 and EML4. Mutant EML1 was not assessed. (E) Analyses of individual puncta of Cep170 fluorescence intensity at the centrosomes, also normalized to γ-tubulin intensity, expressed as mean ± SEM (n = 4 embryos from 2 litters, two ROI analyzed per embryo). Test and significance: Mann-Whitney. P value <0.0001 ****. Scale bar (equivalent all images): 10 µm. Source data are available for this figure: SourceData FS3.
Figure 4.
Figure 4.
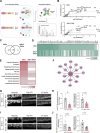
Eml1 interacting partner analyses reveal centrosomal protein Cep170 as an interactor, and reduced presence at the centrosome in Eml1 mutant cells in vivo. (A) BioID workflow to identify proximal interactors of EML1 and EML1*T243A. (B) For EML1 and EML1*T243A BioID analysis, each hit is represented on the scatter plot displays by its Saint Probability (SP) score versus its fold change in the spectral count over the control. (C) Venn diagram displaying overlapping hits for EML1 and EML1*T243A with an SP ≥ 0.6. (D) Heat map showing the SP scores of EML1 and EML1*T243A proximal interactors. (E) Gene ontology (GO) annotation grouped into biological process of EML1 and EML1*T243A proximal interactors. (F) Proximal interactors of EML1 related to microtubule cytoskeleton, spindle, and organelle cellular components (underlined proteins lose interaction significance in EML1*T243A SP < 0.6). (G) Representative images of Cep170 labeling at the ventricular surface in E12.5 WT and Eml1 cKO brains. (H) Quantifications of Cep170 fluorescence intensity at the centrosomes, also normalized to γ-tubulin intensity, expressed as mean ± SEM (the P value is indicated). (I and J) Similar analyses were performed at E15.5. For BioID experiments each condition has three replicates stemming from three independent experiments. Cep170 fluorescence intensity analyzes were performed from at least four individuals per genotype from three different litters and two ROI analyzed per individual. Test and significance: Mann-Whitney. P value <0.05 *. Scale bars (equivalent for WT and cKO): 10 µm.
Figure S4.
Figure S4.
Trafficking to the PC is altered in Eml1 cKO RG. (A) Schematized method of the Retention Using Selective Hook (RUSH) approach, used here for PC protein trafficking analyses in primary cultures of Pax6+ cells. (B) Representative images of GM130, Arl13b labeling, and SSTR3-GFP signal on WT and Eml1 cKO cells in culture at the different time points analyzed. (C and D) Quantifications for SSTR3 (C), PKD2 (D) RUSH construct concentration in the Golgi and in the PC over time (0, 30, 60, and 90 min) in WT and Eml1 cKO cells in culture, values represent mean ± SEM. Quantifications were performed on at least 15 cells from two independent cultures for each genotype and analyzed protein. Test and significance: Two-way ANOVA. Sidak’s multiple comparison. Data distribution was assumed to be normal but this was not formally tested. P value <0.05 *, <0.01 **, <0.001 ***. Scale bar (equivalent for WT and cKO, all time points): 5 µm.
Figure 5.
Figure 5.
Centrosomal alterations in human patient and mouse mutant cells. (A) Representative electron microscopy (EM) images of control and EML1 patient cortical progenitors. Cells are untreated or treated with Epothilone D (EpoD). (B) Quantifications (cells with defective centrosomes, black arrowhead in A, and MT aggregates, circled in A) performed on treated or non-treated human cells, values expressed as mean ± SEM. (C) Representative images of pericentrin and γ-tubulin labeling on Pax6+ cells cultured from WT and Eml1 cKO embryonic brains. Enlargement of pericentrin is shown in the right panel and the red contours show the pericentrin areas in WT and Eml1 cKO cells. (D) Quantification of the total number of centrosome puncta per cell and γ-tubulin fluorescence intensity per centrosome represented as mean ± SEM. (E) Quantification of pericentrin fluorescence intensity and pericentrin area represented as mean ± SEM. γ-Tubulin and pericentrin intensity were analyzed in 90 WT and 89 cKO cells from three independent cultures, indicated by different colors. Pericentrin area measurement was performed on 72 WT cells and 73 cKO cells. Test and significance: Mann-Whitney. P value <0.0001 ****. Scale bars: for A 0.2 µm (equivalent for all images); for C (equivalent for WT and cKO): 5 µm (for main and insets).
Figure 6.
Figure 6.
Eml1 is essential for the recruitment of key proteins at the centrosomes in early corticogenesis. (A) Representative images of immunofluorescence labelling of γ-tubulin at the ventricular surface of embryonic coronal sections at E12.5 from WT and Eml1 cKO individuals. (B) Quantifications of γ-tubulin+ puncta distribution from the 0–70 µm from the apical surface at E12.5 in WT and Eml1 cKO embryonic brain sections, expressed as mean ± SEM. (C) Quantification of γ-tubulin fluorescence intensity at E12.5 (the P value is indicated), expressed as mean ± SEM. (D–F) Similar analyses were performed at E15.5. (G) Representative images of pericentrin labeling at the ventricular surface at E12.5 in WT and Eml1 cKO brains, and quantification of pericentrin dispersion at E12.5, expressed as mean ± SEM. (H) Similar analyses were performed at E15.5 (the P value is indicated). For centrosome analyses n = 5 individuals from 3 litters were analyzed per genotype and age. Two ROI were analyzed per individual. For pericentrin area analyses: at least four individuals were analyzed from 3 litters per genotype and age. Test and significance: Two-way ANOVA, Bonferroni post tests (distribution analyses: data passed normality test), Mann-Whitney. P value <0.05 *. Scale bars (equivalent for WT and cKO): 30 µm (for A and D); 10 µm in G and H (main), 5 µm (for G and H insets).
Figure S5.
Figure S5.
Centrosome and α-tubulin modifications at E12.5 and/or E15.5 in WT and Eml1 cKO brains. (A) Analyses of overall numbers of γ-tubulin puncta at each stage. (B and C) γ-tubulin intensity (B) and pcnt dispersion (C) analyses at E12.5 and E15.5 by individual puncta, expressed as mean ± SEM. For centrosome analyses n = 5 individuals from 3 litters were analyzed per genotype and age. Two ROI were analyzed per individual. For pericentrin area analyses: at least four individuals were analyzed from 3 litters per genotype and age. (D) Immunolabeling of α-tubulin on embryonic brain slices at E12.5 in WT and Eml1 cKO. (E and F) Quantifications from the ventricular surface to 100 µm height show a reduction in intensity, especially close to the ventricular surface. Quantification of α-tubulin mean intensity per ROI (47% decrease was observed in the VZ). Values represent mean ± SEM (n = 4 embryos for each case). Test and significance: Mann-Whitney (γ-tubulin and pcnt analyses), Two-way Anova (α-tubulin analyses, data distribution was assumed to be normal but this was not formally tested). P value <0.001 ***, <0.0001 ****. Scale bar (equivalent for WT and cKO): 30 µm.
Figure 7.
Figure 7.
Microtubule regrowth at centrosomes is impaired in Eml1 mutant conditions. (A) Representative images for pericentrin+ puncta (“centrosomes”) with α-tubulin labeling (“MTs”) on WT and Eml1 cKO cells after ice recovery MT assays (1 and 2 min). (B) Quantifications of percentage (%) of centrosomes exhibiting MT regrowth after 1 or 2 min per analyzed ROI, represented as mean ± SEM. (C) Quantifications for mean length of MTs per centrosome 2 min after ice recovery, represented as mean ± SEM (n = 49 centrosomes for Eml1 cKO and 53 for WT). 16 ROI analyzed from two different cultures after 2 min and 12 ROI analyzed from two different cultures after 1 min. Different cultures are indicated by dots of different colors. Test and significance: Mann-Whitney. P value <0.01 **, <0.001 ***. Scale bars (equivalent for WT and cKO, and for 1 min, 2 min): 10 µm.
Figure 8.
Figure 8.
Abnormal detachment and subsequent heterotopia formation is partially rescued with EpoD treatment. (A) Representative images of Pax6 labeling for WT and Eml1 cKO in saline or EpoD conditions at E13.5. (B and C) Quantification of the cortical wall and ventricular zone (VZ) thickness and total count for Pax6+ cells and distribution outside of VZ in WT and Eml1 cKO from saline and EpoD conditions represented as mean ± SEM (n = 6 individuals from 2 litters at least, indicated by dots of different colors). (D) Representative images of the heterotopia volume in 3D visualized by SatB2 immunofluorescence. The homotopic cortex is depicted in transparency (purple) and the heterotopia is shown with a solid rendering (red). Eml1 cKO embryos received saline or EpoD at E11.5 and E12.5 and were analyzed at E18.5. Three different angles are shown. (E) Quantification of the ratio between heterotopia volume and that of the homotopic cortex in Eml1 cKO with saline or EpoD, represented as mean ± SD (n = 7 embryos from 2 litters). Two independent litters are color-coded. (F) Quantification of Satb2 mean fluorescence intensity in the homotopic cortex in Eml1 cKO with Saline or EpoD, expressed as mean ± SD. Tests and significance: Two-way ANOVA, Sidak multiple comparison (Pax6 analyses, CW and VZ thickness. data passed normality test), Mann Whitney test (heterotopia volume and Satb2 analyses). n = 7 samples from 2 litters. P value <0.05*, <0.01 **, <0.001 ***, <0.0001 ****. Scale bars: 50 µm in A (equivalent for WT and cKO, all conditions) and 500 µm in D.

References

    1. Arai, Y., Pulvers J.N., Haffner C., Schilling B., Nüsslein I., Calegari F., and Huttner W.B.. 2011. Neural stem and progenitor cells shorten S-phase on commitment to neuron production. Nat. Commun. 2:154. 10.1038/ncomms1155 - DOI - PMC - PubMed
    1. Bizzotto, S., and Francis F.. 2015. Morphological and functional aspects of progenitors perturbed in cortical malformations. Front. Cell. Neurosci. 9:30. 10.3389/fncel.2015.00030 - DOI - PMC - PubMed
    1. Bizzotto, S., Uzquiano A., Dingli F., Ershov D., Houllier A., Arras G., Richards M., Loew D., Minc N., Croquelois A., et al. . 2017. Eml1 loss impairs apical progenitor spindle length and soma shape in the developing cerebral cortex. Sci. Rep. 7:17308. 10.1038/s41598-017-15253-4 - DOI - PMC - PubMed
    1. Boncompain, G., Divoux S., Gareil N., de Forges H., Lescure A., Latreche L., Mercanti V., Jollivet F., Raposo G., and Perez F.. 2012. Synchronization of secretory protein traffic in populations of cells. Nat. Methods. 9:493–498. 10.1038/nmeth.1928 - DOI - PubMed
    1. Boncompain, G., Fourriere L., Gareil N., and Perez F.. 2021. Retention using selective hooks-synchronized secretion to measure local exocytosis. Methods Mol. Biol. 2233:253-264. 10.1007/978-1-0716-1044-2_17 - DOI - PubMed

Substances

LinkOut - more resources