Comparative Study
. 2024 Dec;51(12):9071-9087.
doi: 10.1002/mp.17428. Epub 2024 Sep 24.

An international film dosimetry intercomparison to establish a multi-center audit framework

Affiliations
Comparative Study

An international film dosimetry intercomparison to establish a multi-center audit framework

Sabeena Beveridge et al. Med Phys. 2024 Dec.

Abstract

Background: In 2021, a Technical Meeting was hosted by the International Atomic Energy Agency (IAEA) where it was recommended that a standardized method for assessing the accuracy of film dose calculations should be established.

Purpose: To design an audit that evaluates the accuracy of film dosimetry processes. To propose a framework for identifying out-of-tolerance results and to perform an international pilot study to test the audit design.

Methods: Six members of an international Dosimetry Audit Network (DAN) developed an audit for radiochromic film dosimetry. A single host center provided the materials to each participating DAN member to conduct the audits. Materials included: (1) a set of two irradiated audit films (10 Sq: 10 cm × 10 cm, 15 Sq: 15 cm × 15 cm), (2) a reference calibration film set, and (3) a blank sheet of film. The participants were blinded to the dose and tasked with producing dose maps using their standard film dosimetry process. Average Region-Of-Interest (ROI: 2 cm × 2 cm) dose was measured from the dose maps and compared to the known dose. In the audit, all participants used their local scanning and software protocols. Film calibration was performed in two distinct ways: (1) using a calibration film set which was provided by the host center and (2) using a calibration film set which was locally irradiated. Several variations of the audit were also performed to examine how scanning and software processing can affect film dosimetry results. In the first variation of the audit (VariantA), a set of film scans was processed using five different software solutions. In the second variation of the audit (VariantB), all films were scanned on the same scanner and processed using two in-house software solutions.

Results: Taking one film scan from each participant, the standard deviations (1σ) (SD) in the dose returned from the host calibration and returned from the local calibration were ±7.2% and ±6.5% respectively, with variations from -12.4% to 12.9% of the known dose. The larger dose variations in the data set were attributed to the corrections applied for variations in scanner brightness during processing and incorrectly assigned calibration doses. When the raw image data set was processed by an expert user of each software solution (VariantA) the SDs were ±2.7% and ±3.7% for in-house and vendor-based software, respectively. When the films were scanned on a single scanner and processed with the two in-house software solutions (VariantB) the results had a SD of ±2.3%.

Conclusions: An audit has been designed and tested for radiotherapy film dosimetry at an international level. A framework for diagnosing issues within a film dosimetry process has been proposed that could be used to audit centers that use film as a dosimeter. Incorporating quality assurance throughout the film process is important in obtaining accurate and consistent film dosimetry. A better understanding of vendor-based software systems is necessary for users to process accurate and consistent film dosimetry.

Keywords: audit; film dosimetry; quality assurance.


Conflict of interest statement

The authors declare no conflicts of interest.

Figures

FIGURE 1
FIGURE 1
Design of a film dosimetry audit where data is continuously contributed to a repository to establish global acceptance criteria. The host is responsible for setting up the audit and is the only member that knows the dose values of the audit films.
FIGURE 2
FIGURE 2
A hierarchy of assessments that can be performed if a participant fails the film dosimetry audit, with Level I being the simplest investigation and Level IV being the most involved investigation.
FIGURE 3
FIGURE 3
(a) An example blind dose scan co‐scanned with 0 and 8 Gy reference films. Scan dose can be rescaled based on reference portions of the image. (b) Blind dose scanned with no reference films. Dose is fixed based on the scanner calibration.
FIGURE 4
FIGURE 4
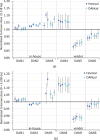
The results for the original audit—Hostcal and DANcal grouped by each DAN for the (a) 10 Sq films and (b) 15 Sq films. Data points represent the average dose value calculated within an ROI centered on the irradiated area of the film and normalized to the known dose (Q). Dose maps were created for each of the three scans performed on each film. Error bars represent one standard deviation (SDROI).
FIGURE 5
FIGURE 5
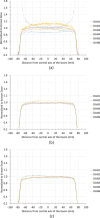
The average of the inline profiles (11 pixel‐width from the center of the irradiated field) for the 15 Sq films for each DAN which was processed using the host calibration film set: (a) Hostcal, (b) Software2, and (c) CommonScan_Software2. The dose was normalized to 5.108 Gy.
FIGURE 6
FIGURE 6
A comparison of the DANs that reprocessed their 10 Sq film results with modified techniques. The original audit results from Figure 4a are shown without error bars for comparison (Hostcal). Data points represent the average dose value calculated within an ROI centered on the irradiated area of the film and normalized to the known dose (Q). Error bars represent one standard deviation (SDROI).
FIGURE 7
FIGURE 7
Histogram of DROI using the Hostcal divided by DROI using the DANcal for dosimetric attempts that used the same scan of the blind film. Insets show isolated data for DAN1 and DAN3.
FIGURE 8
FIGURE 8
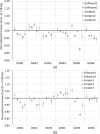
The results for VariantA—Software1, Software2, and three vendors grouped by each DAN for the (a) 10 Sq films and (b) 15 Sq films. Data points represent the average dose value calculated within an ROI centered on the irradiated area of the film and normalized to the known dose (Q). Error bars represent one standard deviation (SDROI).
FIGURE 9
FIGURE 9
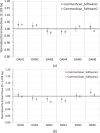
The results for VariantB—CommonScan_Software1 and CommonScan_Software2 grouped by each DAN for the (a) 10 Sq films and (b) 15 Sq films. Data points represent the average dose value calculated within an ROI centered on the irradiated area of the film and normalized to the known dose (Q). Error bars represent one standard deviation (SDROI).

References

    1. Aland T, Kairn T, Kenny J. Evaluation of a gafchromic EBT2 film dosimetry system for radiotherapy quality assurance. Australas Phys Eng Sci Med. 2011;34(2):251‐260. doi:10.1007/s13246-011-0072-6 - DOI - PubMed
    1. Smyth L, Alves A, Collins K, Beveridge S. Gafchromic EBT3 film provides equivalent dosimetric performance to EBT‐XD film for stereotactic radiosurgery dosimetry. Phys Eng Sci Med. 2024. doi:10.1007/s13246-024-01430-z - DOI - PMC - PubMed
    1. Marroquin EL, González JH, López MC, Barajas JV, García‐Garduño O. Evaluation of the uncertainty in an EBT3 film dosimetry system utilizing net optical density. J Appl Clin Med Phys. 2016;17(5):466‐481. doi:10.1120/jacmp.v17i5.6262 - DOI - PMC - PubMed
    1. Palmer AL, Nash D. Radiochromic film dosimetry in radiotherapy: a survey of current practice in the United Kingdom. Br J Radiol. 2024;97(1155):646‐651. doi:10.1093/bjr/tqae008 - DOI - PMC - PubMed
    1. Lewis D, Chan MF. Correcting lateral response artifacts from flatbed scanners for radiochromic film dosimetry. Med Phys. 2016;42(1):416‐429. doi:10.1118/1.4903758 - DOI - PMC - PubMed

Publication types

LinkOut - more resources