. 2024 Sep 24;19(9):e0303955.
doi: 10.1371/journal.pone.0303955. eCollection 2024.

Drosophila larvae form appetitive and aversive associative memory in response to thermal conditioning

Affiliations

Drosophila larvae form appetitive and aversive associative memory in response to thermal conditioning

Nikolaos T Polizos et al. PLoS One. .

Abstract

Organisms have evolved the ability to detect, process, and respond to many different surrounding stimuli in order to successfully navigate their environments. Sensory experiences can also be stored and referenced in the form of memory. The Drosophila larva is a simple model organism that can store associative memories during classical conditioning, and is well-suited for studying learning and memory at a fundamental level. Much progress has been made in understanding larval learning behavior and the associated neural circuitry for olfactory conditioning, but other sensory systems are relatively unexplored. Here, we investigate memory formation in larvae treated with a temperature-based associative conditioning protocol, pairing normally neutral temperatures with appetitive (fructose, FRU) or aversive (salt, NaCl) stimuli. We test associative memory using thermal gradient geometries, and quantify navigation strength towards or away from conditioned temperatures. We find that larvae demonstrate short-term associative learning. They navigate towards warmer or cooler temperatures paired with FRU, and away from warmer or cooler temperatures paired with NaCl. These results, especially when combined with future investigations of thermal memory circuitry in larvae, should provide broader insight into how sensory stimuli are encoded and retrieved in insects and more complex systems.


Conflict of interest statement

The authors have declared that no competing interests exist.

Figures
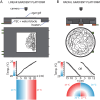
Fig 1
Fig 1. Thermotaxis testing platforms.
An agar gel (white) is placed on the surface of these units. A: Top: a stable 1D linear gradient is produced by maintaining a constant cool temperature on one end and a constant warm temperature on the other (as in [42, 44] and elsewhere), using thermoelectric coolers (TECs) and resistive heaters. An agar gel (white) is placed on the surface of the unit. Black traces represent larva crawling tracks. Bottom: Temperature across the width of the crawling surface. Individual traces from repeated measurements in gray, average in black. The temperature color map is shown below. B: Top: a stable radial gradient, produced using 6 TECs under the outer section to maintain a constant temperature around the perimeter and another more powerful TEC in the center to establish the opposing temperature. An agar gel (white) is placed on the surface of the unit. Black traces represent larva crawling tracks. Bottom: Temperature along a radius, individual measurements in gray, average in black. The temperature color map is shown below, in both possible configurations. After conditioning, larvae are placed on one of these platforms and their movement is recorded with a camera. Drawings are to scale, with each gel 22 cm wide.
Fig 2
Fig 2. Protocols for establishing associative memory with temperature and tastants.
A: Symbol legend, used here and in all figures. Circles denote the US (by color) and CS (by + or − symbol) to describe the paired conditioning used in an experiment. B: Control protocols. Naive controls were performed by using a plain agar plate (without the US tastant), but with the CS temperature still present. All larvae were washed and held on a plain agar plate for 60 min at room temperature (∼ 24°C, white circles), then transferred to an agar plate held at one of the two CS temperatures, and remained there for 5 min. Larvae were then washed and transferred to another plain agar gel for an additional 5 min at room temperature (∼ 24°C). This cycle was repeated as shown in the schematic. Empty white circles indicate plain agar for all protocols, and the durations from the first protocol are the same for all other protocols. After conditioning larvae were tested on a temperature gradient (Fig 1). During testing, larvae crawl on plain agar gel, or agar gel with salt at 1.5 M. C: Single conditioning protocols. Same as control, but larvae are transferred to an agar plate where the CS and US are paired, and remain there for 5 min. D: Double conditioning. Except at the beginning and end, the plain agar gel phase was replaced by a second paired gel of the opposite CS and US. Each experimental trial used 15–20 individual larvae.
Fig 3
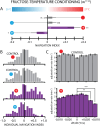
Fig 3. Larvae form appetitive associative memory with temperature and FRU.
Thermotaxis measurements following paired FRU-27°C or FRU-20°C conditioning of w1118 larvae. A: Net larval movement, summarized by the navigation index NIx = 〈vx〉/〈v〉, on a linear temperature gradient (0.32°C/cm) from 20–27°C. A positive NI indicates navigation towards the warmer temperature and a negative NI navigation towards the cooler temperature, and magnitude indicates the strength of the navigation. Circle symbols connected to each result indicate the conditioning used, with the scheme from Fig 2. The number of larvae tested is indicated next to or inside of each bar. Appetitive conditioning with FRU induced significant navigation towards the conditioned temperature, for conditioning to 27°C and to 20°C. Significance tests were conducted with respect to the control (gray bars) group exposed to the matching temperature prior to testing. B: Histogram of the NI values for individual larvae, for the same four experiment types in A. C. Turn rate as a function of the temperature change dT/dt leading up to a turn, with crawling runs sorted into dT/dt bins. Control larvae (top, gray bars) showed no significant difference between the dT/dt = 0 bin and any of the other eight bins. FRU-27°C conditioned larvae (bottom, purple bars) showed a strong drop in turn rate at the highest warming dT/dt bins compared to the dT/dt = 0 bin. This indicates that the positive thermotaxis resulting from conditioning is specifically an attractive behavior towards the warm temperature. The turning rates used here were adjusted to have crawling speed regressed out (speed is independent of crawling direction, see S1 Fig). Error bars are s.e.m. * indicates p < 0.05, ** indicates p < 0.01, *** indicates p < 0.001, Student’s t-test.
Fig 4
Fig 4. Conditioned thermotaxis strength depends on conditioning concentration.
Thermotaxis measurements following paired FRU-27°C conditioning of Canton-S larvae, at two different FRU concentrations. The bar graph shows net larval movement, summarized by the navigation index NIx, on a linear temperature gradient (0.32°C/cm) from 20–27°C. Circle symbols connected to each result indicate the conditioning used, with the scheme from Fig 2. The number of larvae tested is indicated next to or inside of each bar. Appetitive conditioning with FRU induced significant navigation towards the conditioned temperature, at both low (0.5 M, smaller red circle) and high (2 M, larger red circle) FRU concentrations, compared to non-conditioned control larvae. Larvae conditioned with the higher FRU concentration approached 27°C more strongly than the more weakly conditioned group. Error bars are s.e.m. Significance tests are with respect to the control (gray bar) group. * indicates p < 0.05, ** indicates p < 0.01, Student’s t-test.
Fig 5
Fig 5. Thermotaxis measurements following paired FRU-27°C or FRU-27°C conditioning of Ir25a2 larvae, which are temperature-insensitive mutants.
Bar graph shows net larval movement, summarized by the navigation index NIx, on a linear temperature gradient (0.32°C/cm) from 20–27°C. Circle symbols connected to each result indicate the conditioning used, with the scheme from Fig 2. The number of larvae tested is indicated next to each bar. Conditioned Ir25a2 larvae performed no different than control when FRU was paired with 27°C, or when FRU was paired with 20°C. Error bars are s.e.m.
Fig 6
Fig 6. Larvae form aversive associative memory with temperature and NaCl.
Thermotaxis measurements on an agar-salt gel following paired conditioning of w1118 larvae. Bar graph shows net larval movement, summarized by the navigation index NIx, on a linear temperature gradient (0.32°C/cm) from 20–27°C. Circle symbols connected to each result indicate the conditioning used, with the scheme from Fig 2. The number of larvae tested is indicated next to or inside of each bar. Experiments were performed on an agar gel with NaCl mixed in (1.5 M). A. Naive control larvae do not show neutral exploratory motion, but instead navigate towards the cool side of the gradient (27°C, NIx = −0.12; 20°C, NIx = −0.13). B. Larvae conditioned with FRU-27°C and placed on a NaCl gel for testing do not exhibit net navigation, with the conditioning effectively canceling the tendency for the control group to move down the gradient. Conditioning with FRU-20°C resulted in larval movement similar to that seen in control larvae. C. Larvae conditioned with NaCl-27°C pairing move away from the warmer conditioned stimulus (NIx = −0.20) more strongly than control group. Larvae conditioned with NaCl-20°C pairing moved more weakly toward the cooler side of the gradient (NIx = −0.046), less than the control group did. These results suggest that larvae form aversive associative memories with NaCl-temperature pairing, and perform thermotaxis accordingly, despite their natural tendency for negative thermotaxis on NaCl gel without conditioning. D. Larvae conditioned with FRU-27°C and NaCl-20°C moved up the gradient towards warmer temperatures, as opposed to both groups of naive control larvae, which move down the gradient in the presence of salt. Conditioning with the opposite scheme, FRU-20°C and NaCl-27°C, resulted in navigation down the gradient stronger than the 27°C control group. These results indicate the double conditioning yields stronger conditioned thermotaxis, as the addition of FRU conditioning makes this graph essentially a heightened version of C. Error bars are s.e.m. Significance tests are with respect to the corresponding control (gray bar) group. * indicates p < 0.05, ** indicates p < 0.01, *** indicates p < 0.001, Student’s t-test.
Fig 7
Fig 7. Thermotaxis measurements in a radial gradient arena following single-paired conditioning in w1118 larvae.
The gradient ranged from 20–27°C, with a strength of 0.5°C/cm. The polar bar graphs show net larval movement towards the perimeter, summarized by the radial navigation index NIr = 〈vr〉/〈v〉. Circle symbols connected to each result indicate the conditioning used, with the scheme from Fig 2. Yellow boarders indicated experiments where NaCl was present in the testing gel. The number of larvae tested is drawn inside each bar. A: Radial gradient with 27°C on the perimeter and 20°C at the center. Larvae conditioned with FRU-27°C pairing and tested on plain agar navigate to the outer edge more strongly than naive control larvae. Larvae conditioned with NaCl-27°C pairing and tested on agar with 1.5 M salt navigate very weakly toward the outside compared to the control group, whereas larvae conditioned with NaCl-20°C pairing navigate essentially the same as the control group. B: Reversed radial gradient with 20°C on the perimeter and 27°C at the center. Larvae conditioned with FRU-27°C pairing and tested on plain agar navigate to the outer edge to the same degree as control larvae. Larvae conditioned with NaCl-27°C pairing and tested on agar with 1.5 M salt navigate very strongly toward the outside compared to the control group, and larvae conditioned with NaCl-20°C pairing navigate strongly to the outside as well. Error bars are s.e.m. Significance tests are with respect to the control (gray bar) group closest to the experiment group bar. ** indicates p < 0.01, Student’s t-test.

References

    1. Carew T, Walters E, Kandel E. Classical conditioning in a simple withdrawal reflex in Aplysia californica. The Journal of Neuroscience. 1981;1(12):1426–1437. doi: 10.1523/JNEUROSCI.01-12-01426.1981 - DOI - PMC - PubMed
    1. Xu X, Scott-Scheiern T, Kempker L, Simons K. Active avoidance conditioning in zebrafish (Danio rerio). Neurobiology of Learning and Memory. 2007;87(1):72–77. doi: 10.1016/j.nlm.2006.06.002 - DOI - PubMed
    1. Junca P, Sandoz JC. Heat Perception and Aversive Learning in Honey Bees: Putative Involvement of the Thermal/Chemical Sensor AmHsTRPA. Front Physiol. 2015;6:316. doi: 10.3389/fphys.2015.00316 - DOI - PMC - PubMed
    1. Desmedt L, Baracchi D, Devaud JM, Giurfa M, D’Ettorre P. Aversive learning of odor–heat associations in ants. The Journal of Experimental Biology. 2017;220(24):4661–4668. doi: 10.1242/jeb.161737 - DOI - PubMed
    1. Aceves-Piña EO, Quinn WG, Smith KD, Steinberger E, Rodriguez-Rigau LJ. Learning in Normal and Mutant Drosophila Larvae. Science. 1979;206(4414):93–96. doi: 10.1126/science.206.4414.93 - DOI - PubMed

LinkOut - more resources