

Equity in the geographical distribution of general practitioners in Iran
- PMID: 39316616
- PMCID: PMC11421784
- DOI: 10.1371/journal.pgph.0003609
Equity in the geographical distribution of general practitioners in Iran
Abstract
Background: The equitable distribution of workforce is imperative for achieving public health goals. This study was conducted to evaluate the equity of the distribution of general practitioners (GPs) in Iran.
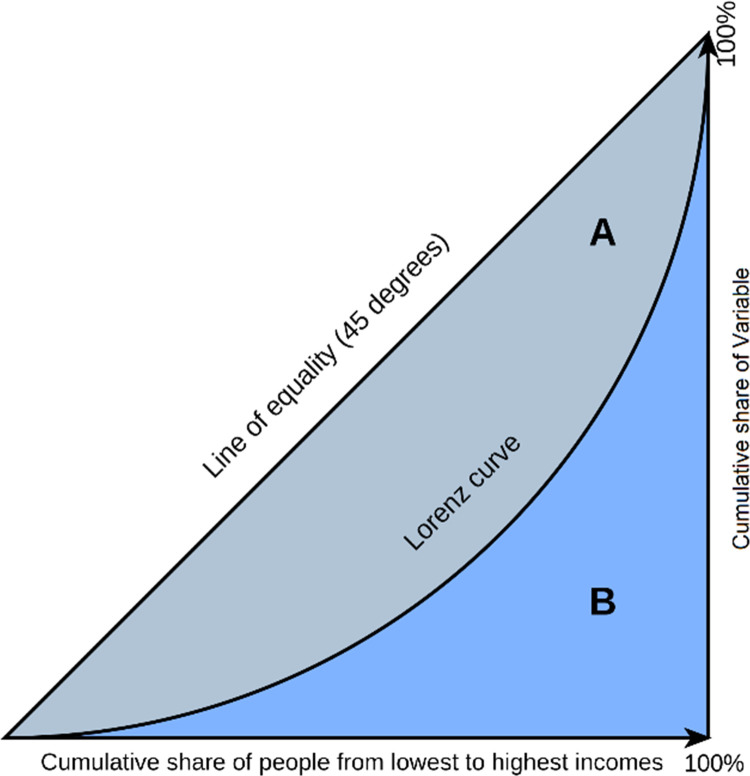
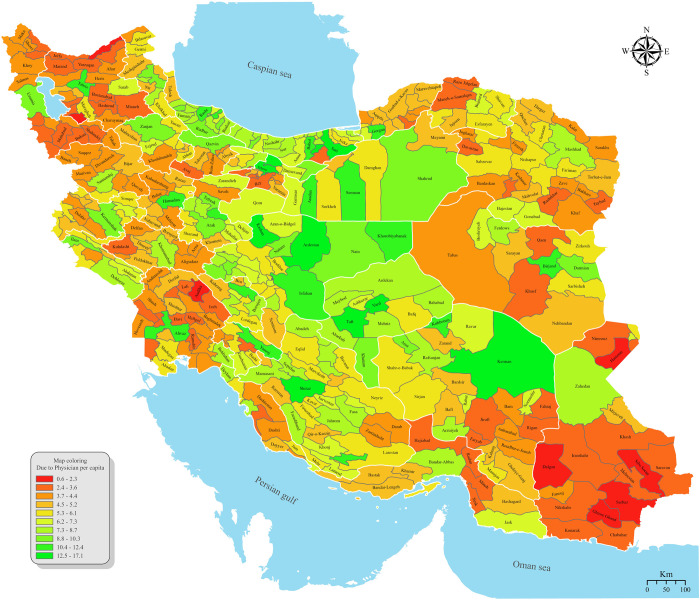
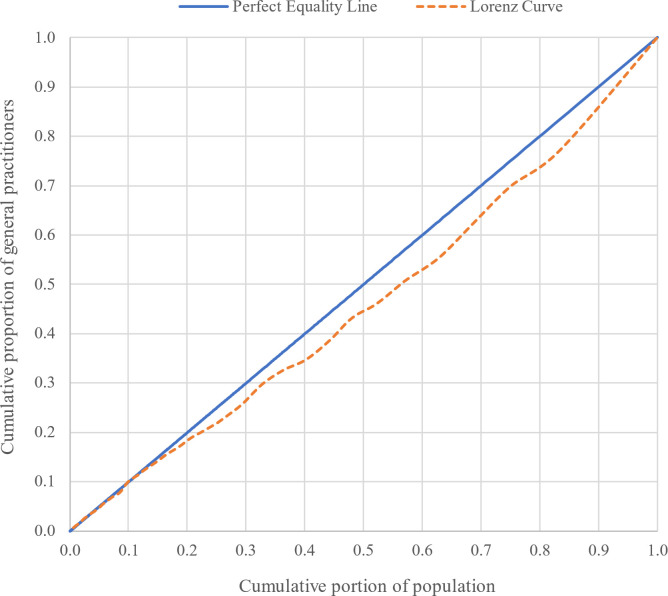
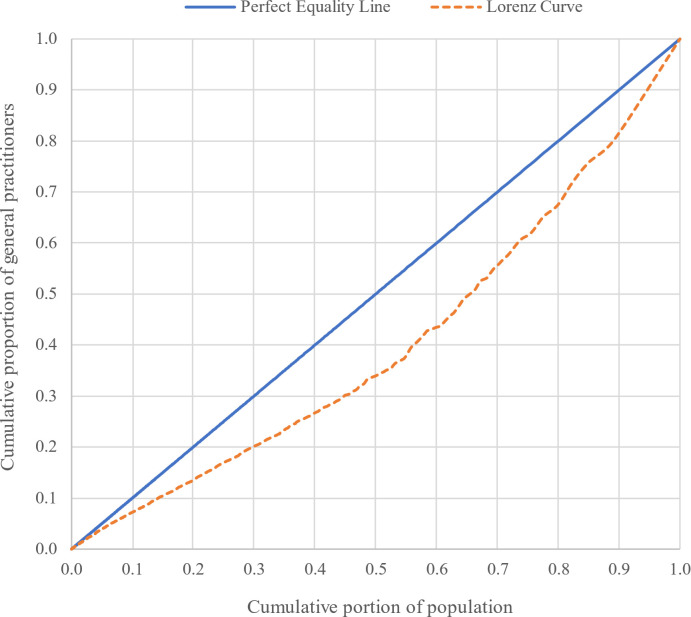
Methods: In this descriptive and cross-sectional study, data from the Information System of Benefits for Iranians and the Iranian Statistics Center were utilized. The study population encompasses all GPs operating in Iran in 2022. To assess equity in the geographical distribution of physicians, the Gini coefficient and Lorenz curve were calculated using Excel software. Additionally, ArcGIS software was used to create a distribution map.
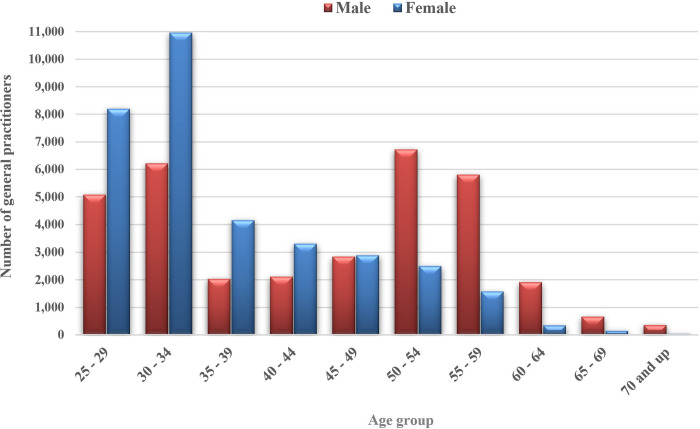
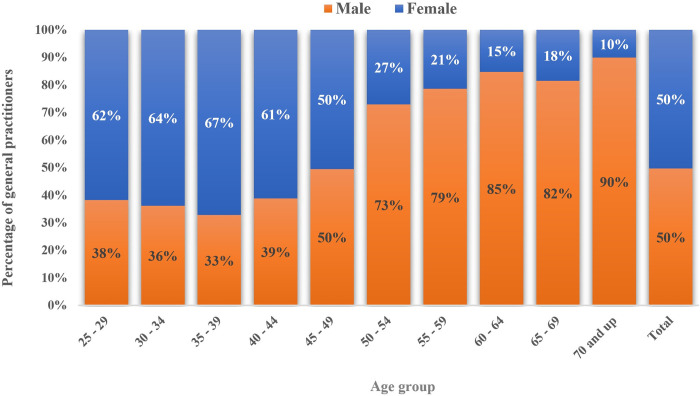
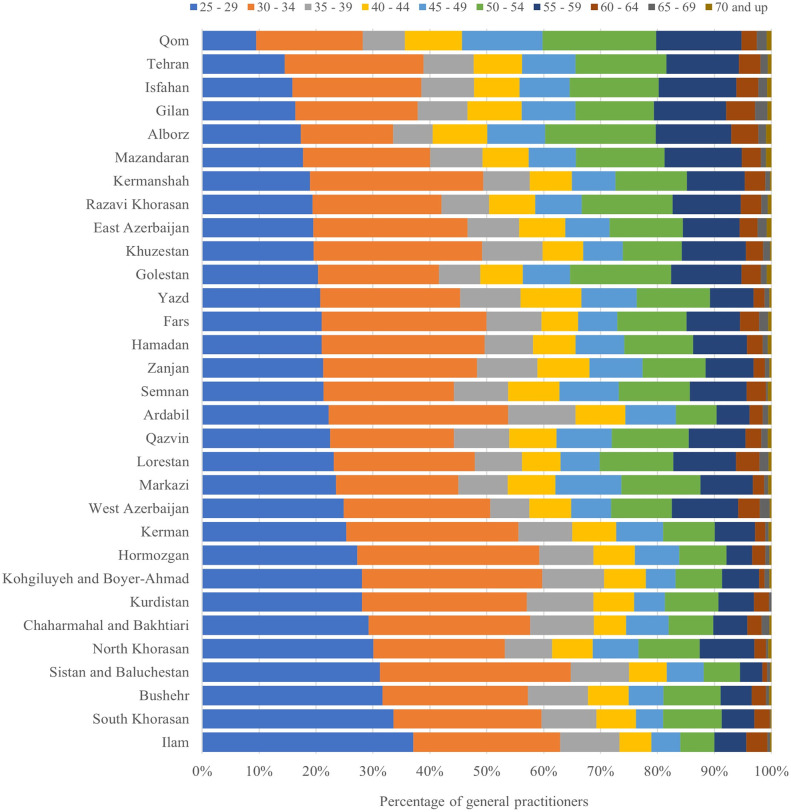
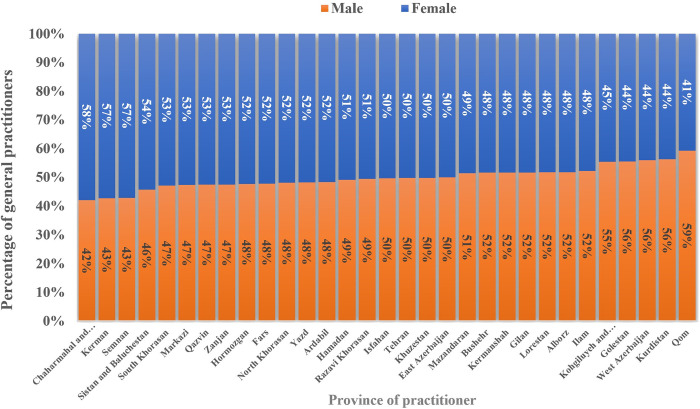
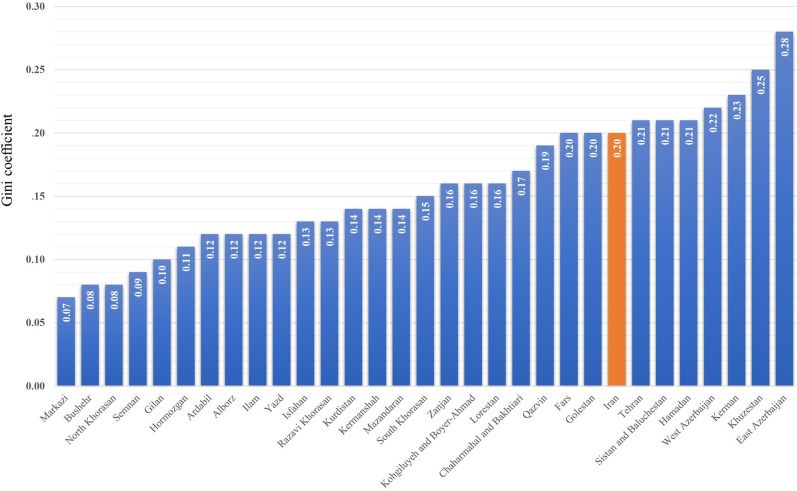
Results: The population of Iran and active GPs in 2022 were 85,874,000 and 67,852 respectively, resulting in an average of 7.9 active GPs per 10,000 people. The provinces of Yazd, Tehran, Mazandaran, and Fars exhibited the highest concentration of active GPs per capita, collectively representing more than 28% of the population and 37% of the active GPs. Fifty percent of the active GPs were women. The Gini coefficients for the provincial and intercity distributions of GPs were 0.08 and 0.2, respectively.
Conclusion: The distribution of GPs among provinces and cities was deemed fair and relatively fair, respectively. Iran has a lower ratio of GPs per capita than the European nations. Policymakers should pay more attention to the implementation of appropriate policies with the aim of increasing equity in the geographical distribution of GPs in the country.
Copyright: © 2024 Khajehnasiri et al. This is an open access article distributed under the terms of the Creative Commons Attribution License, which permits unrestricted use, distribution, and reproduction in any medium, provided the original author and source are credited.
Conflict of interest statement
The authors have declared that no competing interests exist.
Figures
Similar articles
-
Trends of geographic distribution of general practitioners in the public health sector of Iran.J Educ Health Promot. 2018 Jul 6;7:89. doi: 10.4103/jehp.jehp_14_18. eCollection 2018. J Educ Health Promot. 2018. PMID: 30079360 Free PMC article.
-
Inequality in the distribution of resources in the health sector before and after the Health Transformation Plan in Qazvin, Iran.J Health Popul Nutr. 2024 Jan 2;43(1):4. doi: 10.1186/s41043-023-00495-y. J Health Popul Nutr. 2024. PMID: 38167555 Free PMC article.
-
Geographic distribution indices of general practitioners, midwives, pediatricians, and gynecologists in the public sector of Iran.Electron Physician. 2017 Jun 25;9(6):4584-4589. doi: 10.19082/4584. eCollection 2017 Jun. Electron Physician. 2017. PMID: 28848634 Free PMC article.
-
Measuring Equity of Geographical Distribution of Specialist Physicians in Iran's Health System.Int J Prev Med. 2023 May 27;14:60. doi: 10.4103/ijpvm.ijpvm_542_21. eCollection 2023. Int J Prev Med. 2023. PMID: 37351037 Free PMC article.
-
Equity and trends in general practitioners' allocation in China: based on ten years of data from 2012 to 2021.Hum Resour Health. 2023 Aug 2;21(1):61. doi: 10.1186/s12960-023-00841-5. Hum Resour Health. 2023. PMID: 37533104 Free PMC article.
References
-
- Organization WH. Health employment and economic growth: an evidence base: World Health Organization; 2017.
-
- Goudarzi R, Meshkani Z, Barooni M, Jahanmehr N, Moalemi S. Distribution of general practitioners in the health system of iran using equity indices (gini, atkinson). Health and Development Journal. 2015;4(3):247–58.
-
- Elarabi HM, Johari F. The impact of human resources management on healthcare quality. Asian journal of management sciences & education. 2014;3(1):13–22.
LinkOut - more resources
Full Text Sources