. 2024 Sep 24;22(9):e3002767.
doi: 10.1371/journal.pbio.3002767. eCollection 2024 Sep.

A genome-wide arrayed CRISPR screen identifies PLSCR1 as an intrinsic barrier to SARS-CoV-2 entry that recent virus variants have evolved to resist

Affiliations

A genome-wide arrayed CRISPR screen identifies PLSCR1 as an intrinsic barrier to SARS-CoV-2 entry that recent virus variants have evolved to resist

Jérémie Le Pen et al. PLoS Biol. .

Abstract

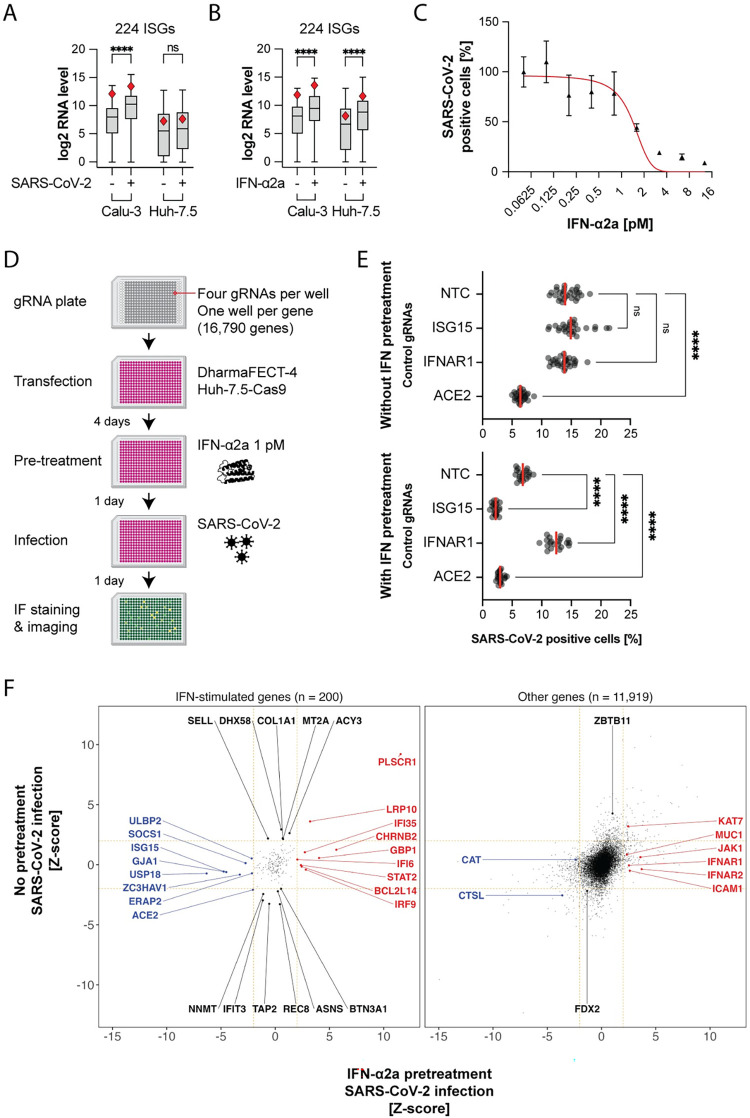
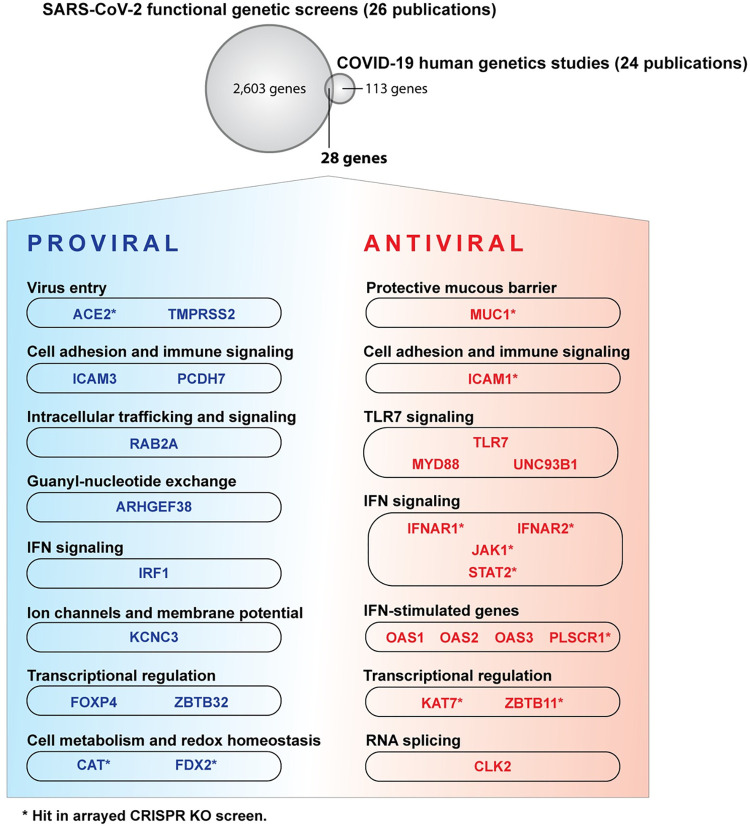
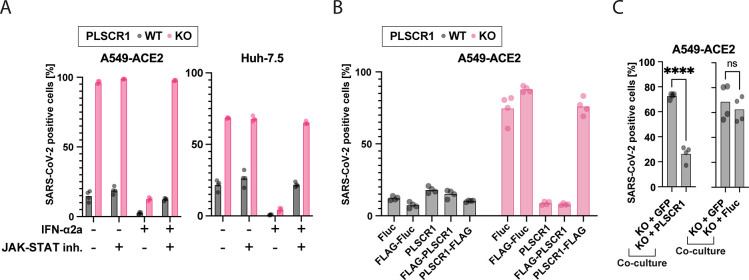
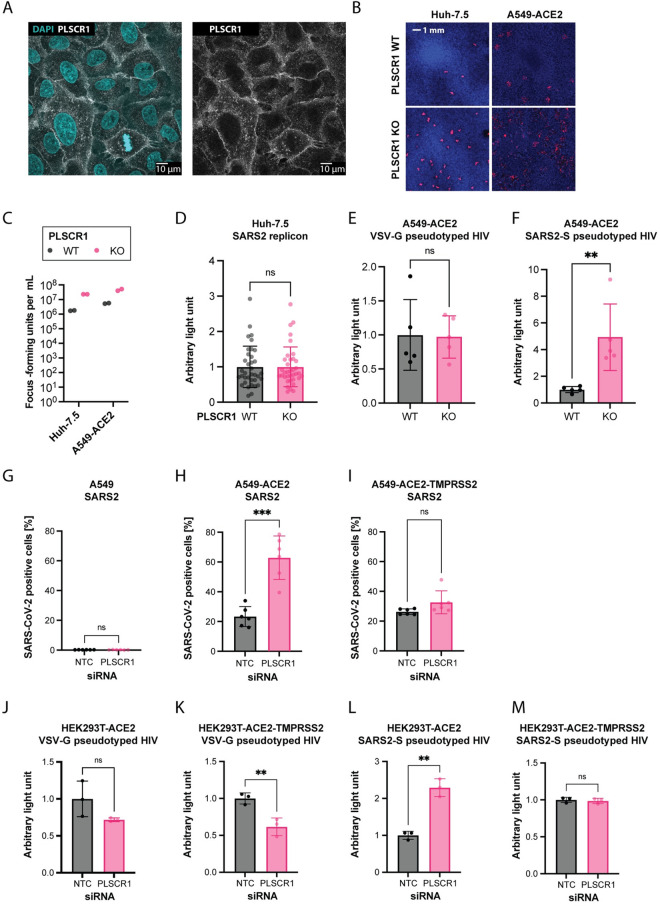
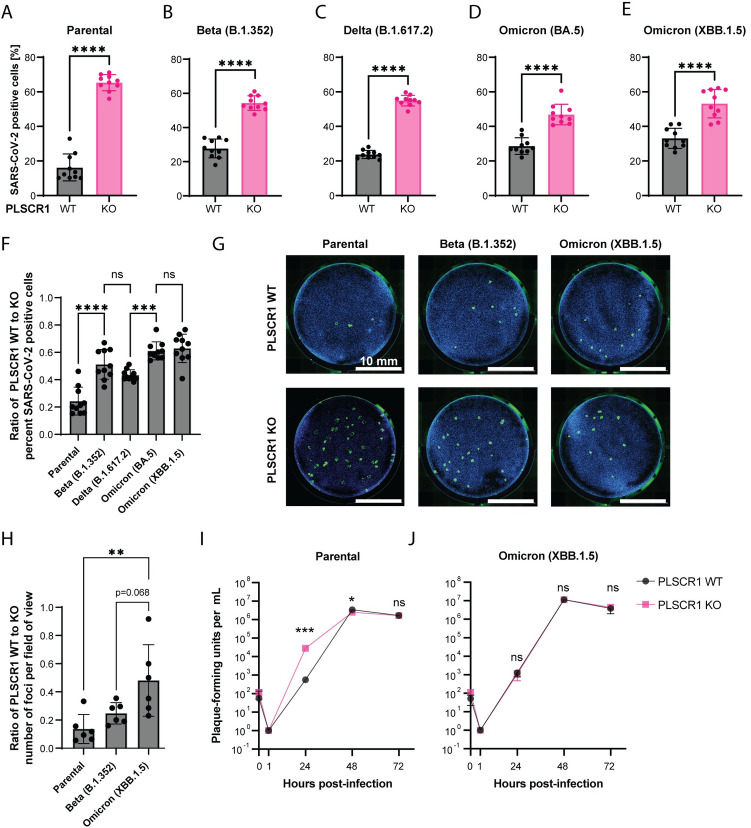
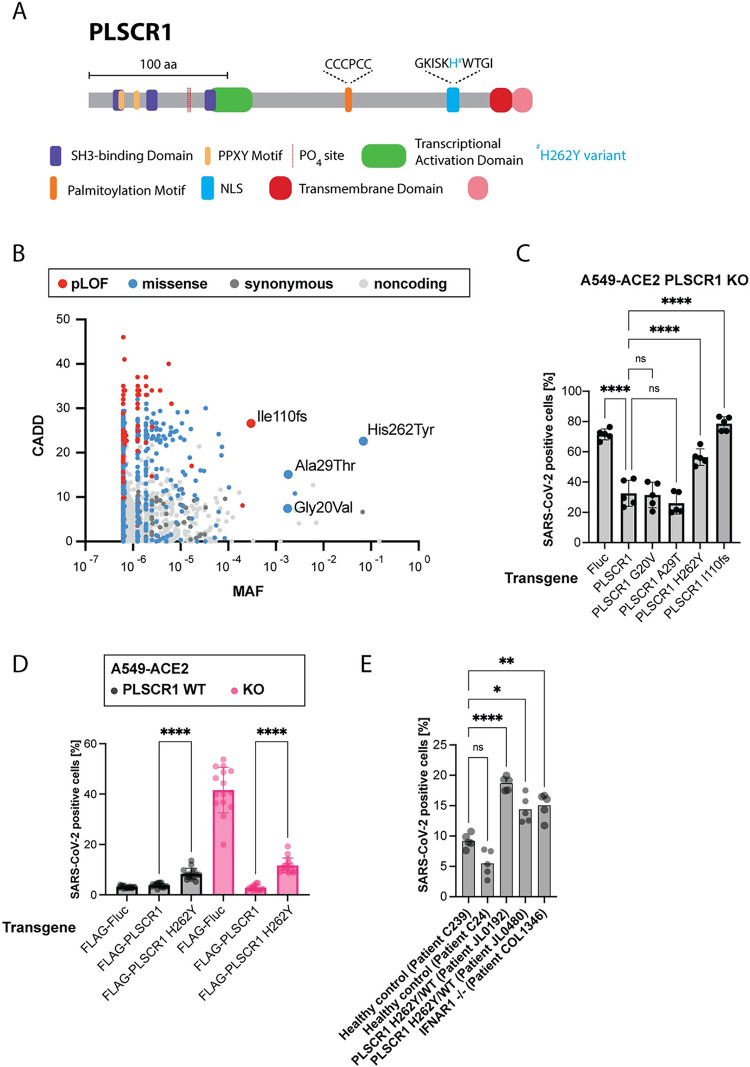
Interferons (IFNs) play a crucial role in the regulation and evolution of host-virus interactions. Here, we conducted a genome-wide arrayed CRISPR knockout screen in the presence and absence of IFN to identify human genes that influence Severe Acute Respiratory Syndrome Coronavirus 2 (SARS-CoV-2) infection. We then performed an integrated analysis of genes interacting with SARS-CoV-2, drawing from a selection of 67 large-scale studies, including our own. We identified 28 genes of high relevance in both human genetic studies of Coronavirus Disease 2019 (COVID-19) patients and functional genetic screens in cell culture, with many related to the IFN pathway. Among these was the IFN-stimulated gene PLSCR1. PLSCR1 did not require IFN induction to restrict SARS-CoV-2 and did not contribute to IFN signaling. Instead, PLSCR1 specifically restricted spike-mediated SARS-CoV-2 entry. The PLSCR1-mediated restriction was alleviated by TMPRSS2 overexpression, suggesting that PLSCR1 primarily restricts the endocytic entry route. In addition, recent SARS-CoV-2 variants have adapted to circumvent the PLSCR1 barrier via currently undetermined mechanisms. Finally, we investigate the functional effects of PLSCR1 variants present in humans and discuss an association between PLSCR1 and severe COVID-19 reported recently.


Conflict of interest statement

The authors have declared that no competing interests exist.

Figures

Fig 1
Fig 1. An unbiased arrayed CRISPR KO screen identifies IFN-dependent and IFN-independent genes influencing SARS-CoV-2 infection.
(A) mRNA-seq comparison between Huh-7.5 and Calu-3 cells, focusing on a subset of 224 ISGs, in response to 24-hour SARS-CoV-2 infection MOI 0.03. Red diamond, PLSCR1 RNA level. Viral RNA levels were comparable in both cell lines (not shown). ****, p ≤ 0.0001; two-tailed t test. (B) Cells were treated with 0.5 nM IFN-α2a for 24 hours. mRNA-seq analysis as in (A). C. Huh-7.5-Cas9 cells were pretreated with different amounts of IFN-ɑ2a and then infected with SARS-CoV-2 for 24 hours followed by IF staining for SARS-CoV-2 N protein; n = 6 separate wells infected on the same day; error bars represent SEM; ****, p ≤ 0.0001; two-tailed t test. (D) Diagram of the arrayed CRISPR KO screen method. (E) Median SARS-CoV-2-positive cell percentages determined by IF staining for the indicated control genes. The control genes were distributed across 28 separate wells (without IFN pretreatment) or across 20 separate wells (with IFN pretreatment) for each screened library plate. (F) The virus level (percentage of infected cells normalized and z-score calculated) is plotted for 24 hours 0 pM (y axis) or 1 pM (x axis) IFN-α2a pretreatment followed by 24-hour infection (n ≥ 5). The genes were categorized as ISG or other based on mRNA-seq of IFN-α2a-treated cells as in (B). ISGs were defined by a fold change ≥ 2 and padj ≤ 0.05 in the IFN-treatment versus untreated pairwise comparison. The data underlying this Figure can be found in S1 Table. IF, immunofluorescence; IFN, interferon; ISG, IFN-stimulated gene; KO, knockout; MOI, multiplicity of infection; NTC, non-targeting control; SARS-CoV-2, Severe Acute Respiratory Syndrome Coronavirus 2.
Fig 2
Fig 2. Cellular pathways influencing SARS-CoV-2 infection.
GSEA was performed on the screen data (S10 Table). The individual genes for some of the top pathways are shown here. The full names of the plotted pathways are as follows: translation initiation, “REACTOME EUKARYOTIC TRANSLATION INITIATION”; negative rRNA regulation, “REACTOME NEGATIVE EPIGENETIC REGULATION OF RRNA EXPRESSION”; cholesterol biosynthesis, “REACTOME REGULATION OF CHOLESTEROL BIOSYNTHESIS BY SREBP SREBF”; pre-mRNA processing, “REACTOME PROCESSING OF CAPPED INTRON CONTAINING PRE MRNA”; cellular respiration, “WP ELECTRON TRANSPORT CHAIN OXPHOS SYSTEM IN MITOCHONDRIA”; RNA Pol III transcription, “REACTOME RNA POLYMERASE III TRANSCRIPTION INITIATION FROM TYPE 3 PROMOTER.” Pathways are from the Reactome [189] and Wikipathways [191] databases. The data underlying this Figure can be found in S1 Table.
Fig 3
Fig 3. Human genes significant in human genetics studies on COVID-19 patients and in functional genetic screens in cell culture.
Overlap between genes considered significant by human genetics studies on COVID-19 patients [,,,,,–99] and functional genetic screens for genes influencing SARS-CoV-2 infection in cell culture [–,,,,,,–80]. The full list of genes is available in S11 Table, and a summary is in S12 Table. Please note that not all genes represented here will influence COVID-19 outcomes. We apologize to the many colleagues whose work was not cited and discussed.
Fig 4
Fig 4. PLSCR1 is a highly effective anti-SARS-CoV-2 effector ISG contributing to intrinsic immunity in the absence of IFN.
(A) Cells were pretreated with a JAK-STAT inhibitor (InSolution 1 μM) for 2 hours, followed by IFN-ɑ2a (10 pM Huh-7.5 or 20 μM A549-ACE2) for 24 hours and were infected with SARS-CoV-2 for 24 hours followed by IF staining for viral N protein. Huh-7.5 infection using an MOI of 0.5 (titer determined by focus forming assay on Huh-7.5 WT cells). A549-ACE2 infection using an MOI of 0.01 (titer determined by focus forming assay on A549-ACE2 WT cells). The percentage of SARS-CoV-2-positive cells is plotted. n = 4 separate wells infected on the same day. (B) Cells were reconstituted with the indicated proteins by stable transduction with lentiviruses and then infected as in (A). n = 4 separate wells infected on the same day. (C) Cells were cocultured as indicated (50:50 mix) and then infected as in (A), and the % infection of each cell type was determined. n = 4 separate wells infected on the same day; ****, p ≤ 0.0001; two-tailed t test. The data underlying this Figure can be found in S1 Table. IF, immunofluorescence; IFN, interferon; ISG, IFN-stimulated gene; MOI, multiplicity of infection; PLSCR1, phospholipid scramblase 1; SARS-CoV-2, Severe Acute Respiratory Syndrome Coronavirus 2; WT, wild type.
Fig 5
Fig 5. PLSCR1 restricts spike-mediated SARS-CoV-2 entry.
(A) A549-ACE2 cells were IF stained using an anti-PLSCR1 antibody (white) and Hoechst 33342 nuclear staining (blue) and imaged at 63× magnification on a confocal microscope. (B) Focus forming assays: SARS-CoV-2 N IF (red) and Hoechst 33342 nuclear staining (blue) on similarly infected WT or PLSCR1 KO Huh-7.5 and A549-ACE2 cells after 2 and 3 days, respectively. (C) Quantification of (B) n = 2 separate wells infected on the same day. (D) Huh-7.5 WT and PLSCR1 KO cells electroporated with SARS-CoV-2 replicon, which produces a secreted luciferase. Luciferase activity assayed 24 hours after electroporation. n = 36 separate wells from a single electroporation event. Error bars represent SD; ns, nonsignificant; two-tailed t test. (E, F) Transduction of A549-ACE2 cells with an HIV-based replicon expressing the nanoluciferase pseudotyped with VSV-G or SARS-CoV-2 spike, respectively. n = 5 separate wells transduced on the same day. Nanoluciferase signal measured 2 dpi. Error bars represent SD; ns, nonsignificant; **, p ≤ 0.01; two-tailed t test. (G-I) A549 cells WT, expressing ACE2, or expressing ACE2-TMPRSS2 as indicated were transfected with PLSCR1 or NTC siRNAs as indicated for 3 days and infected with SARS-CoV-2 for 1 day. SARS-CoV-2 N was stained by IF, and the percentage of positive cells was determined by imaging. n = 6 separate wells infected on the same day. Error bars represent SD; ns, nonsignificant; **, p ≤ 0.01; ***, p ≤ 0.001; two-tailed t test. (J-M) HEK293T cells expressing ACE2 or ACE2-TMPRSS2, as indicated, were transfected with siRNA targeting PLSCR1, for 3 days and transduced with an HIV-based replicon expressing the nanoluciferase pseudotyped with VSV-G or SARS-CoV-2 spike, as indicated for 2 days. n = 3 separate wells transduced on the same day. Error bars represent SD; ns, nonsignificant; **, p ≤ 0.01; two-tailed t test. The data underlying this Figure can be found in S1 Table. ACE2, angiotensin converting enzyme 2; IF, immunofluorescence; KO, knockout; NTC, non-targeting control; PLSCR1, phospholipid scramblase 1; SARS-CoV-2, Severe Acute Respiratory Syndrome Coronavirus 2; TMPRSS2, transmembrane serine protease 2; WT, wild type.
Fig 6
Fig 6. Newer variants of SARS-CoV-2 are less restricted by PLSCR1.
(A-E) Infection of Huh-7.5 cells with SARS-CoV-2 (parental) or its descendant variants, Beta, Delta, Omicron BA.5, and Omicron XBB.1.5 for 24 hours. SARS-CoV-2 N was stained by IF and the percentage of positive cells determined by imaging. n = 10 separate wells infected on the same day. Error bars represent SD; ****, p < 0.0001; two-tailed t test. (F) Ratio of WT/KO percent infection from (A-E). Error bars represent SD. ns, nonsignificant; ***, p ≤ 0.001; ****, p ≤ 0.0001; one-way ANOVA. (G) Focus forming assay on Huh-7.5 WT and PLSCR1 KO cells infected with approximately 50 FFU of SARS-CoV-2 variants as indicated. FFUs were determined on PLSCR1 KO Huh-7.5 cells. Representative images. (H) Foci from (G) were counted, and then a ratio of WT-to-KO plotted for each SARS-CoV-2 variant. n = 6 separate wells infected on the same day. Error bars represent SD. **, p ≤ 0.01; one-way ANOVA. (I) Virus production over an infectious time course (growth curve) for the parental SARS-CoV-2 strain. n = 2 to 3 separate wells infected on the same day. Error bars represent SD. ns, nonsignificant, *, p ≤ 0.05, ***, p ≤ 0.001, two-tailed t test on the log10-transformed values. (J) As in (I) with the Omicron (XBB.1.5) strain. The data underlying this Figure can be found in S1 Table. FFU, focus-forming unit; IF, immunofluorescence; KO, knockout; PLSCR1, phospholipid scramblase 1; SARS-CoV-2, Severe Acute Respiratory Syndrome Coronavirus 2; WT, wild type.
Fig 7
Fig 7. PLSCR1 p.His262Tyr, which associates with severe COVID-19, leads to higher SARS-CoV-2 infection in cell culture.
(A) Protein diagram of PLSCR1. Domain coordinates from UniProt [197]. (B) CADD MAF plot showing the common variants of the PLSCR1 gene reported in gnomAD [132,133]. The plot displays the CADD scores, indicating the predicted deleteriousness of each variant, against the MAF. (C) A549-ACE2 PLSCR1 KO cells were transduced to stably and ectopically express the indicated PLSCR1 variants. The cells were then infected for 24 hours with SARS-CoV-2. SARS-CoV-2 N was stained by IF and the percentage of positive cells determined by imaging. n = 4 separate wells infected on the same day. Error bars represent SD; **, p ≤ 0.01; ****, p < 0.0001; one-way ANOVA. (D) A549-ACE2 cells, WT and PLSCR1 KO, stably expressing N-terminal FLAG-tagged Fluc, N-terminal FLAG-tagged PLSCR1, or N-terminal FLAG-tagged PLSCR1 H262Y mutant and infected with SARS-CoV-2 for 24 hours. SARS-CoV-2 N was stained by IF and the percentage of positive cells determined by imaging. n = 15 separate wells infected on the same day. Error bars represent SD; ****, p ≤ 0.0001; two-tailed t test. (E) SV40-Fibroblast-ACE2 cells, genotype as indicated, infected for 24 hours with SARS-CoV-2. n = 8 separate wells infected on the same day. ns, nonsignificant; *, p ≤ 0.05; **, p ≤ 0.01; ****, p ≤ 0.0001; one-way ANOVA. The data underlying this Figure can be found in S1 Table. ACE2, angiotensin converting enzyme 2; CADD, Combined Annotation Dependent Depletion; COVID-19, Coronavirus Disease 2019; Fluc, Firefly Luciferase; Fs, frameshift; IF, immunofluorescence; KO, knockout; MAF, minor allele frequency; PLSCR1, phospholipid scramblase 1; SARS-CoV-2, Severe Acute Respiratory Syndrome Coronavirus 2; WT, wild type.

Similar articles

Cited by

References

    1. Le Pen J, Rice CM. The antiviral state of the cell: lessons from SARS-CoV-2. Curr Opin Immunol. 2024;87:102426. Epub 20240523. doi: 10.1016/j.coi.2024.102426 . - DOI - PMC - PubMed
    1. Bastard P, Zhang Q, Zhang SY, Jouanguy E, Casanova JL. Type I interferons and SARS-CoV-2: from cells to organisms. Curr Opin Immunol. 2022;74:172–182. Epub 20220125. doi: 10.1016/j.coi.2022.01.003 ; PubMed Central PMCID: PMC8786610. - DOI - PMC - PubMed
    1. Bastard P, Gervais A, Le Voyer T, Rosain J, Philippot Q, Manry J, et al.. Autoantibodies neutralizing type I IFNs are present in ~4% of uninfected individuals over 70 years old and account for ~20% of COVID-19 deaths. Sci Immunol. 2021;6(62). Epub 2021/08/21. doi: 10.1126/sciimmunol.abl4340 . - DOI - PMC - PubMed
    1. Lopez J, Mommert M, Mouton W, Pizzorno A, Brengel-Pesce K, Mezidi M, et al.. Early nasal type I IFN immunity against SARS-CoV-2 is compromised in patients with autoantibodies against type I IFNs. J Exp Med. 2021;218(10). Epub 20210806. doi: 10.1084/jem.20211211 ; PubMed Central PMCID: PMC8352718. - DOI - PMC - PubMed
    1. Asano T, Boisson B, Onodi F, Matuozzo D, Moncada-Velez M, Maglorius Renkilaraj MRL, et al.. X-linked recessive TLR7 deficiency in ~1% of men under 60 years old with life-threatening COVID-19. Sci Immunol. 2021;6(62). doi: 10.1126/sciimmunol.abl4348 ; PubMed Central PMCID: PMC8532080. - DOI - PMC - PubMed

MeSH terms

Supplementary concepts