. 2024 Dec 5;144(23):2417-2431.
doi: 10.1182/blood.2024024281.

Disruption of cotranscriptional splicing suggests RBM39 is a therapeutic target in acute lymphoblastic leukemia

Affiliations

Disruption of cotranscriptional splicing suggests RBM39 is a therapeutic target in acute lymphoblastic leukemia

Qi Jin et al. Blood. .

Abstract

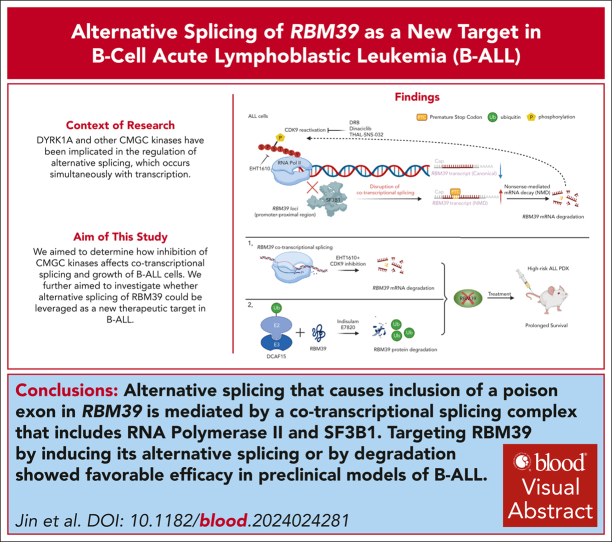
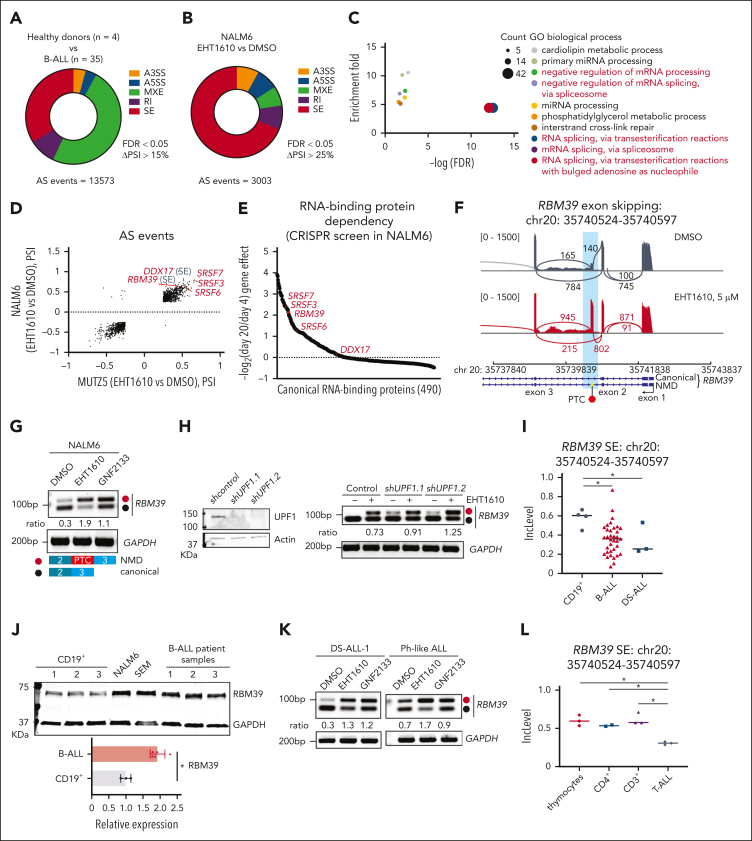
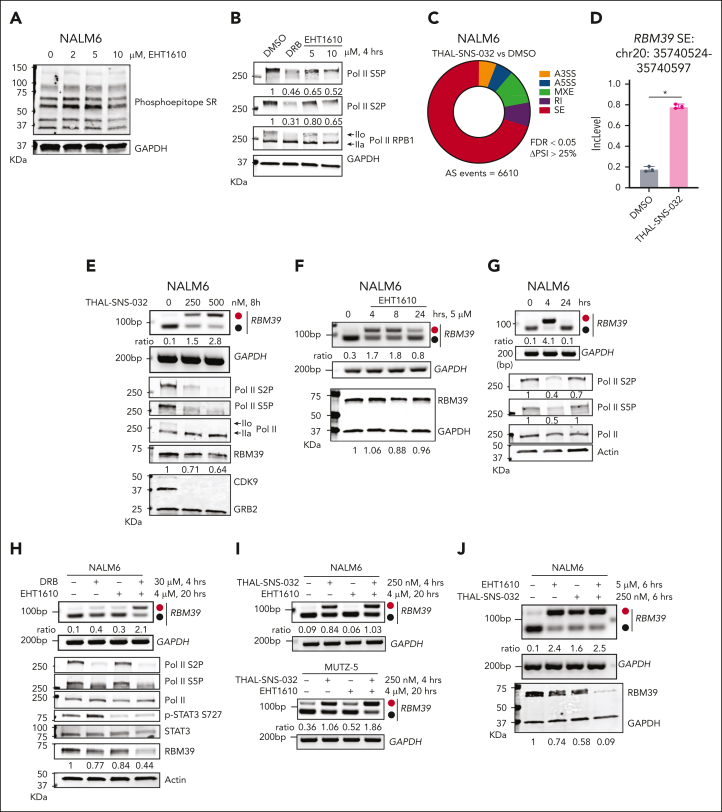
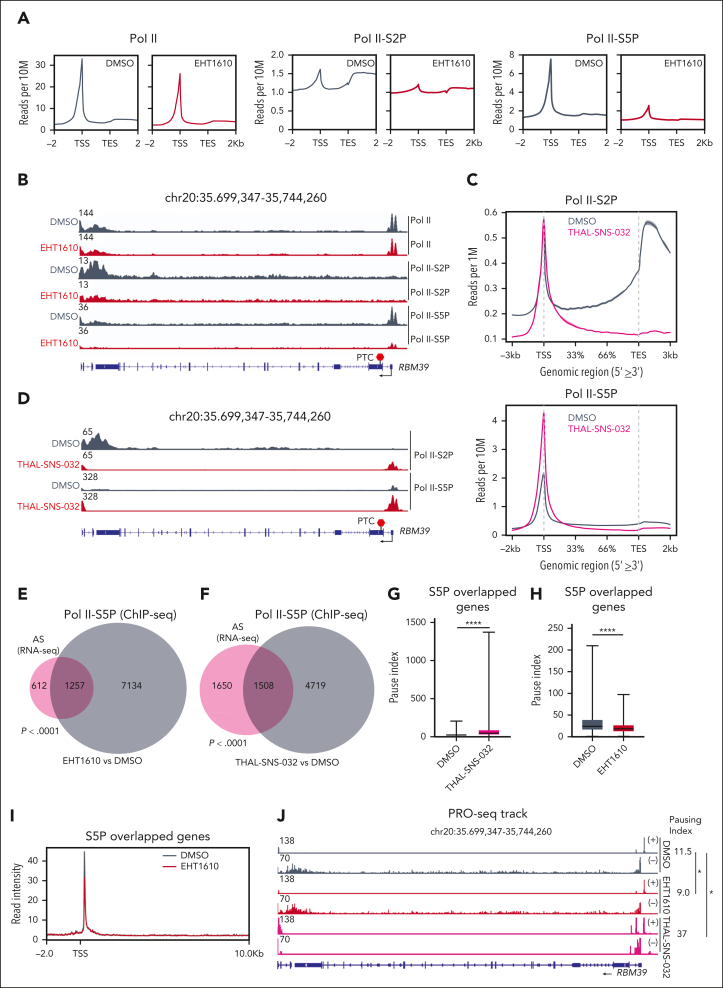
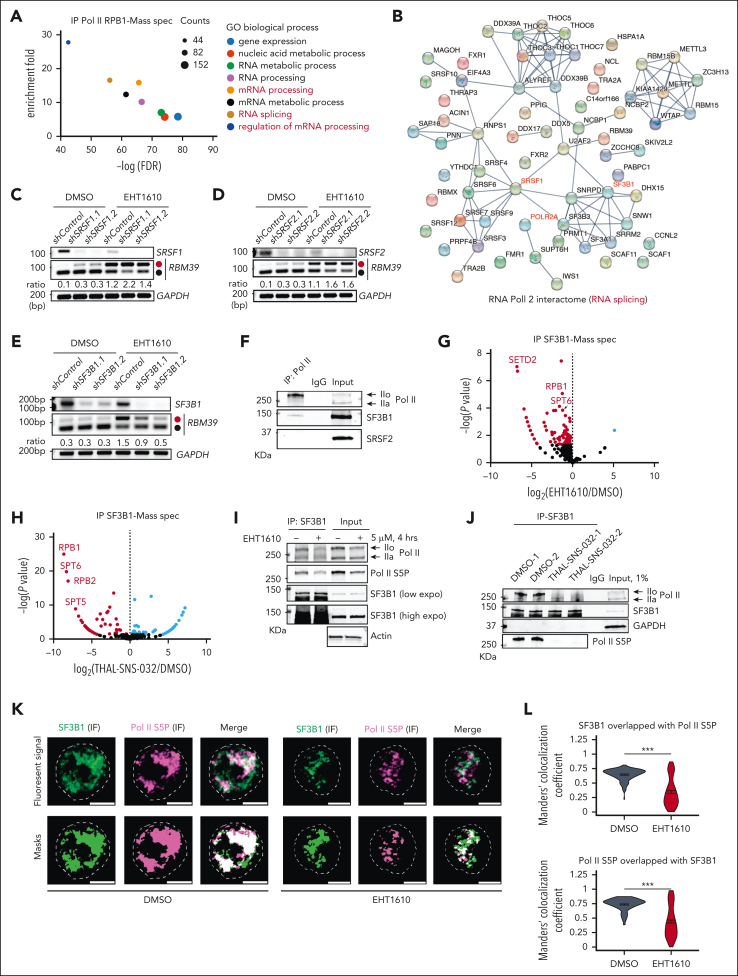
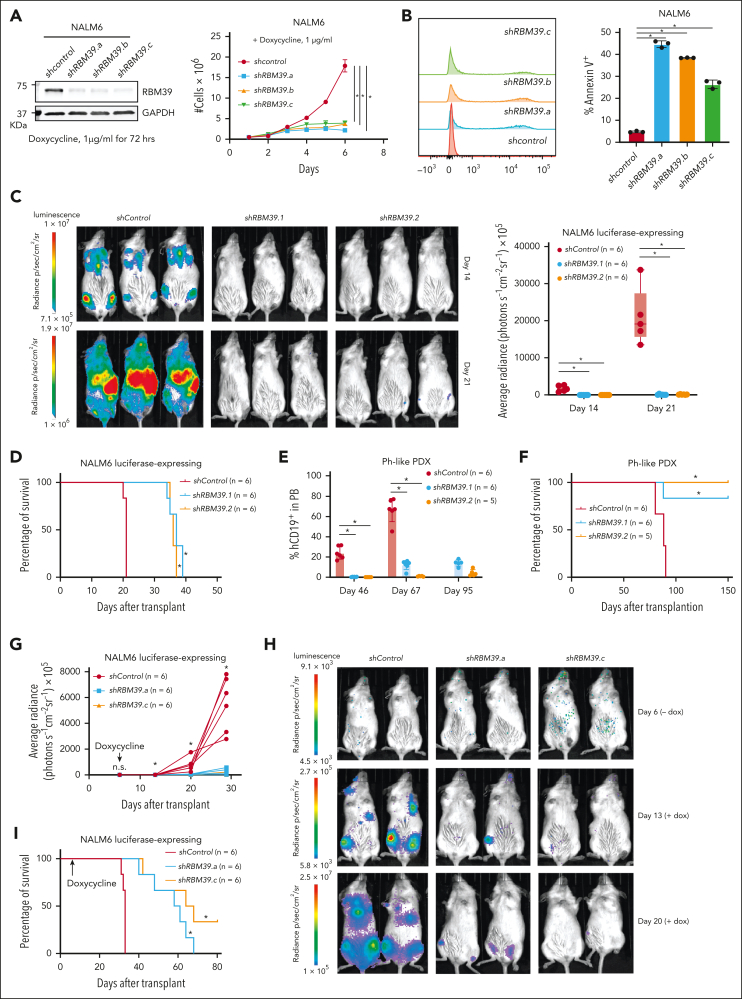
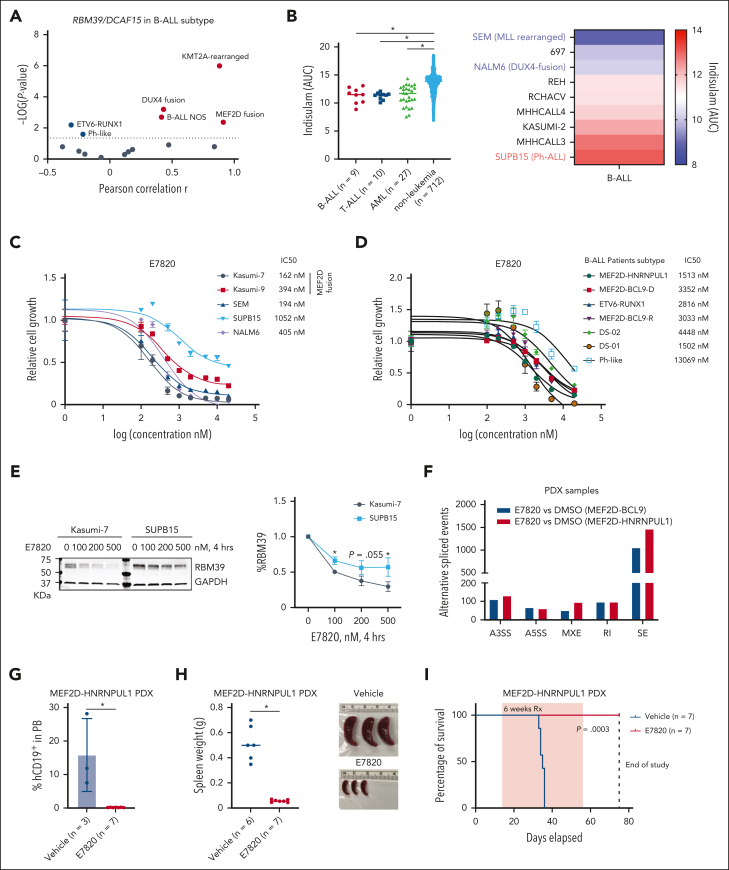
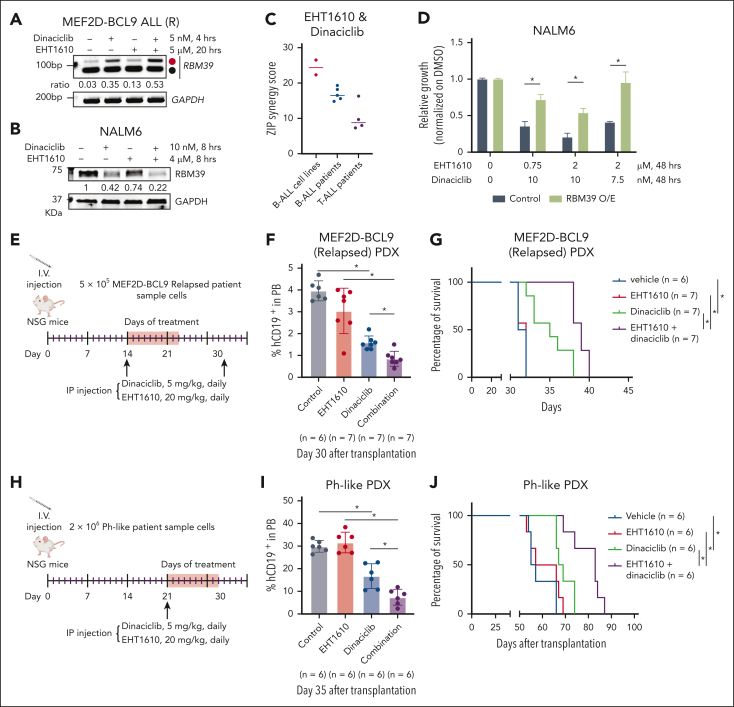
There are only a few options for patients with relapsed/refractory B-cell acute lymphoblastic leukemia (B-ALL), thus, this is a major area of unmet medical need. In this study, we reveal that the inclusion of a poison exon in RBM39, which could be induced by both CDK9 or CDK9 independent cyclin-dependent kinases, mitogen-activated protein kinases, glycogen synthase kinases, CDC-like kinases (CMGC) kinase inhibition, is recognized by the nonsense-mediated messenger RNA decay pathway for degradation. Targeting this poison exon in RBM39 with CMGC inhibitors led to protein downregulation and the inhibition of ALL growth, particularly in relapsed/refractory B-ALL. Mechanistically, disruption of cotranscriptional splicing by the inhibition of CMGC kinases, including DYRK1A, or inhibition of CDK9, which phosphorylate the C-terminal domain of RNA polymerase II (Pol II), led to alteration in the SF3B1 and Pol II association. Disruption of SF3B1 and the transcriptional elongation complex altered Pol II pausing, which promoted the inclusion of a poison exon in RBM39. Moreover, RBM39 ablation suppressed the growth of human B-ALL, and targeting RBM39 with sulfonamides, which degrade RBM39 protein, showed strong antitumor activity in preclinical models. Our data reveal that relapsed/refractory B-ALL is susceptible to pharmacologic and genetic inhibition of RBM39 and provide 2 potential strategies to target this axis.


Conflict of interest statement

Conflict-of-interest disclosure: A.Y. reports receiving research grants from Eisai Inc and Chugai Pharmaceutical Co, Ltd. J.D.C. reports receiving research support from Syndax, consulting fees from Cellarity, and serving as a scientific advisor for Alethiomics. O.A.-W. has served as a consultant for Foundation Medicine Inc, Merck, Prelude Therapeutics, and Janssen; is on the Scientific Advisory Board of Envisagenics Inc, AIChemy, Harmonic Discovery Inc, and Pfizer Boulder; has received prior research funding from H3 Biomedicine, Nurix Therapeutics, Minovia Therapeutics, and Loxo Oncology unrelated to the current manuscript; and is a founder of Codify Therapeutics for which he also serves as a consultant and receives research support. R.S.B. reports previously receiving consulting fees from Alva10. The remaining authors declare no competing financial interests.

Figures

None
Graphical abstract
Figure 1.
Figure 1.
Identification of an alternatively spliced RBM39 transcript in ALL. (A) Pie chart showing differential splicing events in B-ALL (n = 35) vs normal human CD19+ B cells (n = 4). (B) Pie chart showing differential splicing events in NALM6 cells treated with DMSO or with EHT1610 (5 μM) for 4 hours. (C) GO analysis of overlapping differentially spliced genes between (B) and supplemental Figure 1A. (D) Scatter plot comparison of the differential splicing events analyzed in (B) and supplemental Figure 1A. Red gene names depict the top differentially spliced events. Transcripts presenting ΔPSI > 25% are shown. (E) Fold-change (day 20/day 4) in sgRNA abundance in pooled RBP-focused negative selection screen in NALM6 cells. Red dots indicate RBPs that are the top differentially spliced genes shown in (D). Each dot represents the average of all sgRNAs that targeted an RBP. (F) Sashimi plots depicting splicing and exon-exon junctions for an alternative splicing event in the RBM39 transcript in NALM6 cells treated with EHT1610 for 4 hours. The gene is shown along the horizontal axis. Thicker sections represent exons that code for protein sequence. Numbers over the lines that are connecting exons represent the number of reads mapped to that exon-exon junction. (G) NALM6 cells were treated with EHT1610 (5 μM) or GNF2133 (5 μM) for 4 hours. PCR reactions were performed for the detection of an RBM39 splicing event (upper). Schematic plot showing the detection of a PTC insertion between exon 2 and exon 3 of RBM39. Red and black dots represent the NMD and canonical isoforms, respectively (lower). (H) Western blot for UPF1 upon silencing of UPF1 (shUPF1.1 and shUPF1.2) in NALM6 cells (left). PCR reactions were performed for the detection of RBM39 splicing events in indicated cells with EHT1610 (1 μM) for 4 hours (right). (I) Inclusion level in normal human CD19+ B cells (n = 4) and B-ALL (n = 35) for the identical alternative spliced event in RBM39 transcript shown in (F). ∗P < .05. (J) Western blot analysis of RBM39 in CD19+ B cells from 3 different donors, ALL cell lines, and B-ALL PDX samples (upper). Quantification of the RBM39 protein normalized to GAPDH is shown (lower). (K) B-ALL PDX samples were treated with EHT1610 (5 μM) and GNF2133 (5 μM) for 4 hours. PCR reactions were performed for the detection of RBM39 splicing events. (L) Inclusion level in thymocytes (n = 3), CD4+ (n = 2), CD3+ (n = 3), and T-ALL (n = 3) for the identical alternative spliced event in the RBM39 transcript is shown in (F). ∗P < .05. Data were acquired from GSE139622.A3SS, alternative 3′ splice sites; A5SS, alternative 5′ splice sites; AS, alternative splicing; FDR, false discovery rate; PSI, percent spliced in; PTC, premature stop codon; RI, intron retention.
Figure 2.
Figure 2.
Pol II phosphorylation mediates cotranscriptional splicing of an RBM39 poison exon. (A) Western blot to detect changes in phosphorylated SR-rich proteins after treatment of NALM6 cells with increasing concentrations of EHT1610 for 8 hours. (B) Western blot analysis of extracts from NALM6 cells treated with DMSO, DRB (30 μM), and EHT1610 for 4 hours. IIo and IIa indicate hyperphosphorylated and hypophosphorylated CTD52, respectively. (C) Pie chart showing differential splicing events in NALM6 cells treated with DMSO when compared with those treated with THAL-SNS-032 (500 nM) for 8 hours. (D) The inclusion level in NALM6 cells treated with DMSO (n = 3) and THAL-SNS-032 (n = 3) for the identical alternative spliced event in RBM39 transcript shown in Figure 1F. ∗P < .05. (E) The NALM6 cells were treated with increasing doses of THAL-SNS-032 for 8 hours. PCR reactions were performed for the detection of RBM39 splicing events (upper), and western blot analysis of extracts were shown (lower). (F) NALM6 cells were treated with EHT1610 in a time-dependent manner. PCR reactions were performed for the detection of the RBM39 splicing event (upper), and western blot analysis of extracts were shown (lower). (G) NALM6 cells were treated with EHT1610 (4 μM) for 4 and 24 hours. PCR reactions were performed for detection of the RBM39 splicing event (upper), and western blot analysis of extracts are shown (lower). (H) NALM6 cells were treated with EHT1610 for 16 hours, followed by additional treatment of DRB for 4 hours. PCR reactions were performed for the detection of RBM39 splicing event (upper), and western blot analysis of extracts were shown (lower). (I) NALM6 cells (upper) or MUTZ-5 cells (lower) were treated with EHT1610 for 16 hours, followed by additional treatment with THAL-SNS-032 for 4 hours. PCR reactions were performed to detect the RBM39 splicing event. (J) NALM6 cells were treated with EHT1610, THAL-SNS-032 or a combination for 6 hours. PCR reactions were performed for the detection of an RBM39 splicing event (upper) and representative western blot analysis of 3 biological replicates of extracts are shown (lower).
Figure 3.
Figure 3.
Pol II distribution and pausing are altered with disruption of cotranscriptional splicing. (A) ChIP-seq signal of Pol II (left), p-Ser2 Pol II (middle), and p-Ser5 Pol II (right) from NALM6 cells treated with DMSO and EHT1610 (5 μM). The average profiles of DMSO and EHT1610 that covered ±2 kb of the gene were plotted. (B) Snapshots of RBM39 loci (IGV browser) with ChIP-seq signals for Pol II, p-Ser2 Pol II, and p-Ser5 Pol II upon EHT1610 treatment in NALM6 cells. (C) ChIP-seq signal of p-Ser2 Pol II (left) and p-Ser5 Pol II (right) from NALM6 cells treated with DMSO and THAL-SNS-032 (500 nM). The average profiles of DMSO and THAL-SNS-032 were plotted and covered ±3kb of the gene. (D) Snapshots of RBM39 loci (IGV browser) with ChIP-seq signals for p-Ser2 Pol II and p-Ser5 Pol II upon THAL-SNS-032 treatment in NALM6 cells. (E) Venn diagram showing overlapped alterative spliced genes (analyzed from Figure 1B) and decreased p-Ser5 Pol II ChIP-seq signal genes upon EHT1610 treatment. (F) Venn diagram showing overlapped alternatively spliced genes (analyzed from Figure 2C) and differential p-Ser5 Pol II ChIP-seq signal genes upon THAL-SNS-032 treatment. (G-J) NALM6 cells were treated with DMSO and EHT1610 (5 μM) for 4 hours and with THAL-SNS-032 (500 nM) for 8 hours followed by PRO-seq. (G) Comparison of the pausing indexes of the overlapping genes in (F). (H) Comparison of pausing indexes of those overlapped genes in (E). (I) Metagene plot showing PRO-seq signal in NAML6 cells treated with DMSO and EHT1610 for those overlapped genes in (E). (J) Snapshot of PRO-seq track on the RBM39 locus in NALM6 cells with DMSO, EHT1610, and THAL-SNS-032 treatment. (+) indicates transcription from left to right; (−) indicates transcription from right to left. The pausing indexes for the RBM39 locus are indicated to the right (n = 2; ∗P < .05).
Figure 4.
Figure 4.
SF3B1 interacts with phosphorylated Pol II that regulates RBM39 poison exon inclusion. (A) GO analysis of the identified proteins from Pol II immunoprecipitation (IP)-mass spectrometry. Pathways with by -log (FDR) and enrichment >5 are shown. (B) Protein-protein interaction network of 66 RNA splicing proteins identified in the Pol II IP-mass spectrometry. (C-E) PCR analysis for RBM39 alternative splicing upon SRSF1 (with shSRSF1.1 and shSRSF1.2) (C), SRSF2 (with shSRSF2.1 and shSRSF2.2) (D), and of SF3B1 (with shSF3B1.1 and shSF3B1.2) (E) silencing in NALM6 cells. PCR reactions were performed for detection of RBM39 splicing event in indicated cells with EHT1610 (2 μM) treatment for 4 hours. (F) Western blot analysis following IP for Pol II in NALM6 cells. (G-H) The NALM6 cells were treated with DMSO, EHT1610 (5 μM), and THAL-SNS-032 (500 nM) for 4 hours, followed by SF3B1 IP-mass spectrometry. Scatter plot showing the differential proteins in comparison with DMSO and EHT1610 (G) or DMSO and THAL-SNS-032 (H). (I-J) Western blot analysis following IP for SF3B1 in NALM6 cells treated with EHT1610 (I) or THAL-SNS-032 (500 nM) (J) for 4 hours. (K-L) Immunofluorescence analysis of p-Ser5 Pol II and SF3B1 in NALM6 cells treated with DMSO or EHT1610 (5 μM) (K). Scale bars depict 5 microns. Quantification of Manders' colocalization coefficient values between SF3B1 and p-Ser5 Pol II Immunofluorescence signal (L) (See methods). ∗∗∗P < .001.
Figure 5.
Figure 5.
RBM39 is required for progression and maintenance of ALL. (A) Western blot for RBM39 (left) and the growth curves (right) from the inducible control hairpin RNA, shRBM39.a, shRBM39.b, and shRBM39.c expressing NALM6 cells with doxycycline treatment. (B) Annexin V staining of NALM6 cells that expressed either an inducible control short hairpin RNA or shRBM39 after 72 hours. A representative example (left) and quantification of Annexin V+ cells (n = 3, right; ∗P < .05) are shown. (C) Representative bioluminescence pictures of immunocompromised animals (left) that were transplanted with luciferase-expressing NALM6 cells that were previously transduced with a lentiviral vector expressing either a control hairpin RNA, shRBM39.1, or shRBM39.2, and selected using puromycin for a period of 3 days. Quantification of tumor growth by total flux in vivo (right). ∗P < .05. (D) Survival analysis of the immunocompromised mice that received a transplant of control hairpin RNA-, shRBM39.1-, or shRBM39.2-expressing NALM6 cells. The P value (∗P < .05) was calculated using a log-rank (Mantel-Cox) test. (E) Immunocompromised animals were transplanted with Ph-like ALL PDX cells that were previously transduced with a lentiviral vector expressing either a control hairpin RNA, shRBM39.1, or shRBM39.2, and selected using puromycin for a period of 3 days. Human CD19+ cells in peripheral blood (PB) were monitored to assess disease burden. ∗P < .05. (F) Survival analysis of immunocompromised mice transplanted with the control hairpin, shRBM39.1-, or shRBM39.2-expressing Ph-like ALL PDX cells. ∗P < .05. (G-H) The total flux from each day as indicated in immunocompromised animals that were transplanted with luciferase-expressing NALM6 cells that were previously transduced with a lentiviral vector expressing either a control hairpin RNA, shRBM39.a, or shRBM39.c (G). ∗P < .05. The relative bioluminescence intensity is shown for 3 representative mice per group on day 6 (before doxycycline administration), day 13, and day 20 (after doxycycline administration) (H). (I) Survival analysis of mice transplanted with control hairpin RNA, shRBM39.a, or shRBM39.c-expressing NALM6 cells. (∗P < .05).
Figure 6.
Figure 6.
High-risk subtypes of ALL are sensitive to RBM39 degradation. (A) Pearson correlation analysis between RBM39 mRNA and DCAF15 mRNA across the indicated subtypes of B-ALL. Patients with B-ALL mRNA expression data were obtained from the Pediatric Cancer Genome Project data portal (PeCan, St Jude, Memphis). (B) Indisulam area under the curve (AUC) of B-ALL, T-ALL and AML in comparison with nonleukemia cell lines. Data were obtained from the CTD network (left). The indisulam AUC for the indicated B-ALL cell lines (right). (C) IC50 of E7820 (n = 3; the mean value ± standard deviation [SD] is shown) across different B-ALL cell lines as indicated. MEF2D fusion subtypes include Kasumi-7 and -9. (D) The IC50 of E7820 (n = 3; the mean value ± SD is shown) across different B-ALL PDX samples as indicated. (E) Western blot analysis of RBM39 in Kasumi-7 and SUPB15 treated with increasing concentration of E7820 for 4 h. One representative blot is shown on left and quantification of 3 biological replicates is shown on right. (F) Bar graph showing different types of splicing events for patients cells with MEF2D-BCL9 ALL treated with DMSO or E7820 (1 μM) and patient cells with MEF2D-HNRNPUL1 ALL treated with DMSO or E7820 (1 μM). (G-I) MEF2D-HNRNPUL1 ALL PDX cells were transplanted into NSG mice and randomized to E7820 (50 mg/kg) or vehicle, which were orally administrated to mice beginning on day 14 for 6 weeks. The disease burden was monitored by human CD19+ cells in peripheral blood (G). ∗P < .05. (H) Spleen weight of mice when the humane end points were reached or on day 75 (end of the study, left; ∗P < .05). Representative images of spleens (right). (I) Survival analysis of the mice administrated with E7820 (50 mg/kg) or vehicle. ∗P < .05.
Figure 7.
Figure 7.
Targeting the poison exon of RBM39 with CMGC kinase inhibitors in ALL. (A) Relapsed MEF2D-BCL9 PDX cells were treated with EHT1610 (5 μM) for 16 hours, followed by additional treatment with dinaciclib (5 nM) for 4 hours. PCR reactions were performed for detection of the RBM39 splicing event. (B) Representative western blot analysis of 3 biologic replicates for RBM39 in NALM6 cells treated with dinaciclib, EHT1610, or the combination for 8 hours. (C) ZIP synergy score for EHT1610 and dinaciclib for 3 days in B-ALL cell lines, B-ALL PDX samples, and T-ALL PDX samples. (D) Cell viability assay for control or RBM39 O/E NALM6 cells treated with dinaciclib and EHT1610 for 72 hours (n = 2; ∗P < .05). (E-J) Schematic showing details of dinaciclib and EHT1610 treatment in relapsed MEF2D-BCL9 ALL (E) or Ph-like (H) ALL PDX models. Disease burden was monitored by assessing the human CD19+ cells in the peripheral blood (F, I). Survival analysis of relapsed MEF2D-BCL9 ALL (G) or Ph-like (J) ALL PDX. ∗P < .05. O/E, overexpression; ZIP, Zero interaction potency.

References

    1. Saez B, Walter MJ, Graubert TA. Splicing factor gene mutations in hematologic malignancies. Blood. 2017;129(10):1260–1269. - PMC - PubMed
    1. Chen S, Benbarche S, Abdel-Wahab O. Splicing factor mutations in hematologic malignancies. Blood. 2021;138(8):599–612. - PMC - PubMed
    1. Darman RB, Seiler M, Agrawal AA, et al. Cancer-associated SF3B1 hotspot mutations induce cryptic 3′ splice site selection through use of a different branch point. Cell Rep. 2015;13(5):1033–1045. - PubMed
    1. Wadugu BA, Nonavinkere Srivatsan S, Heard A, et al. U2af1 is a haplo-essential gene required for hematopoietic cancer cell survival in mice. J Clin Invest. 2021;131(21) - PMC - PubMed
    1. Lee SC, Dvinge H, Kim E, et al. Modulation of splicing catalysis for therapeutic targeting of leukemia with mutations in genes encoding spliceosomal proteins. Nat Med. 2016;22(6):672–678. - PMC - PubMed

MeSH terms

LinkOut - more resources