. 2024 Oct;602(20):5179-5201.
doi: 10.1113/JP286453. Epub 2024 Sep 24.

Dual ablation of the RyR2-Ser2808 and RyR2-Ser2814 sites increases propensity for pro-arrhythmic spontaneous Ca2+ releases

Affiliations

Dual ablation of the RyR2-Ser2808 and RyR2-Ser2814 sites increases propensity for pro-arrhythmic spontaneous Ca2+ releases

Radoslav Janicek et al. J Physiol. 2024 Oct.

Abstract

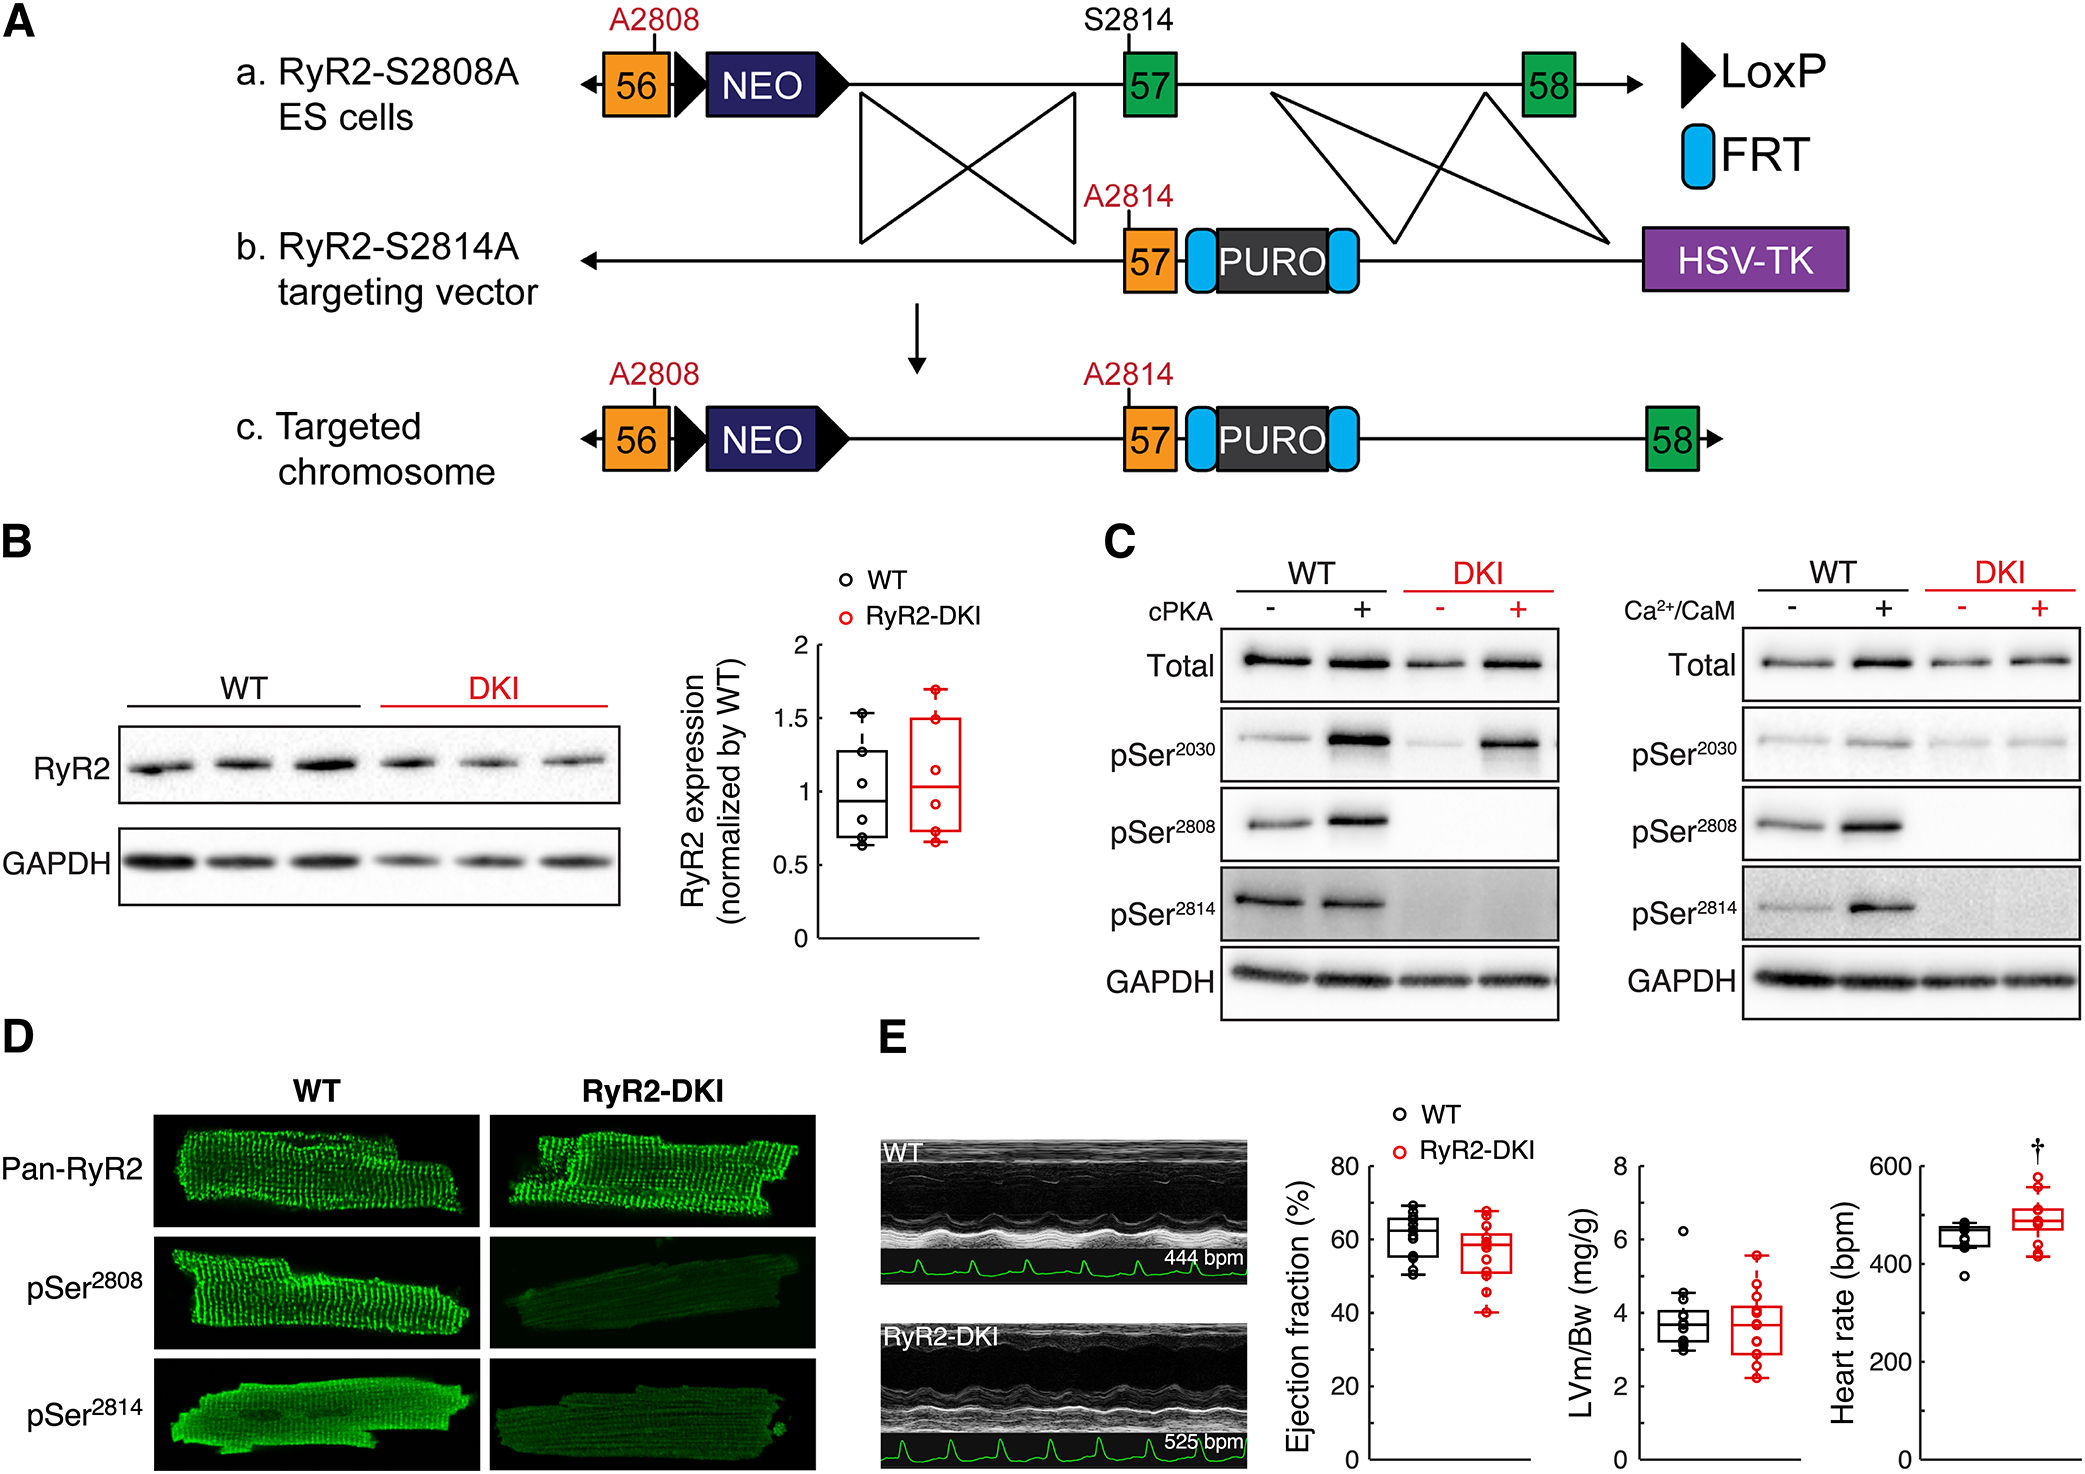
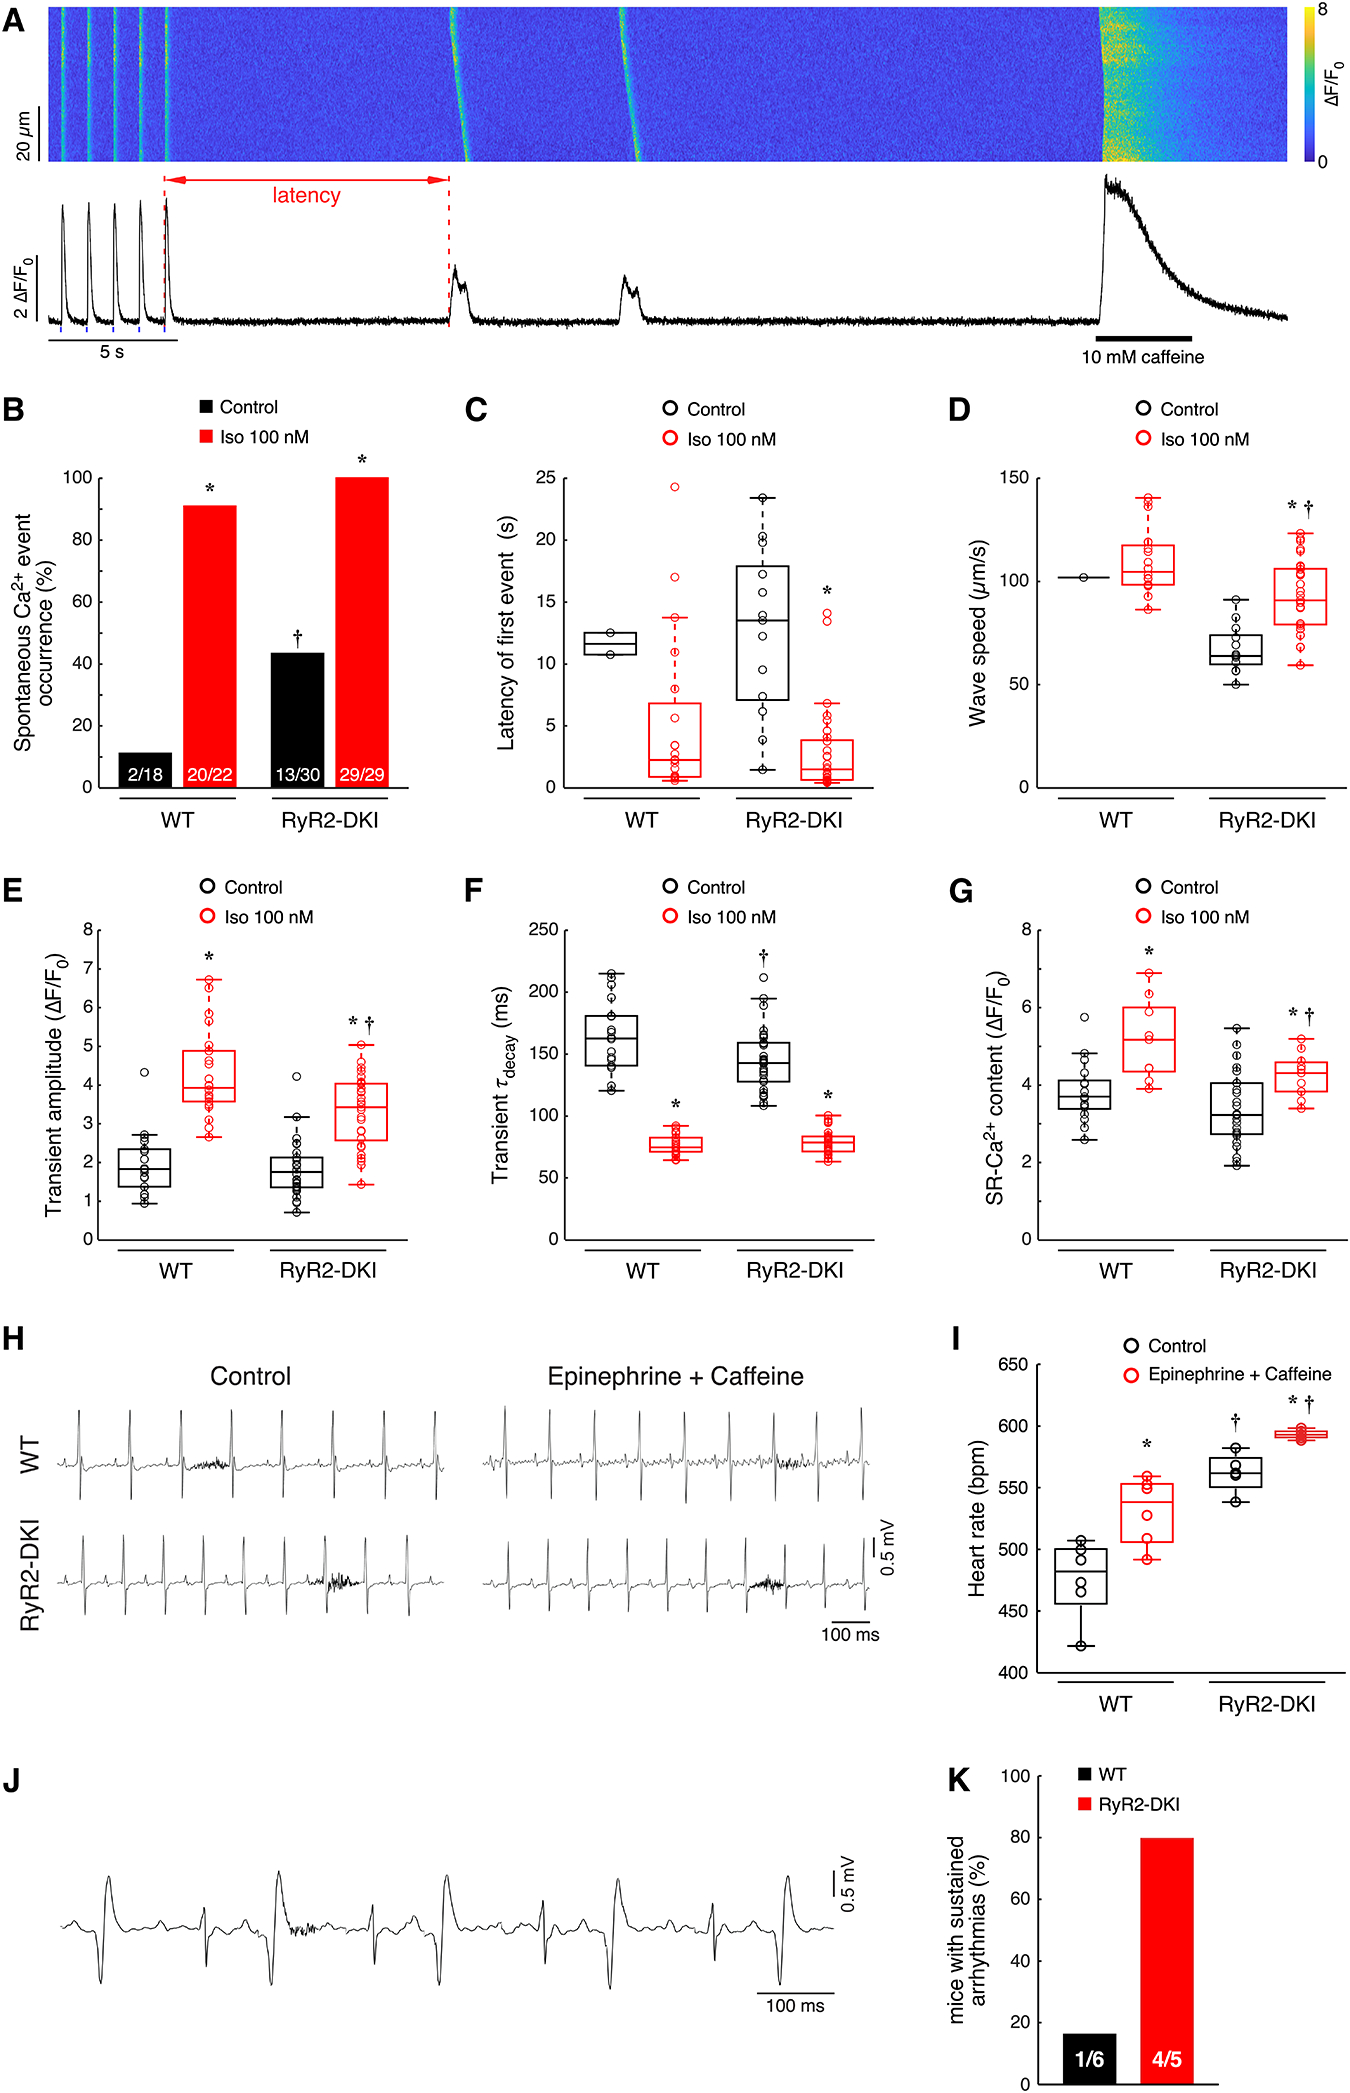
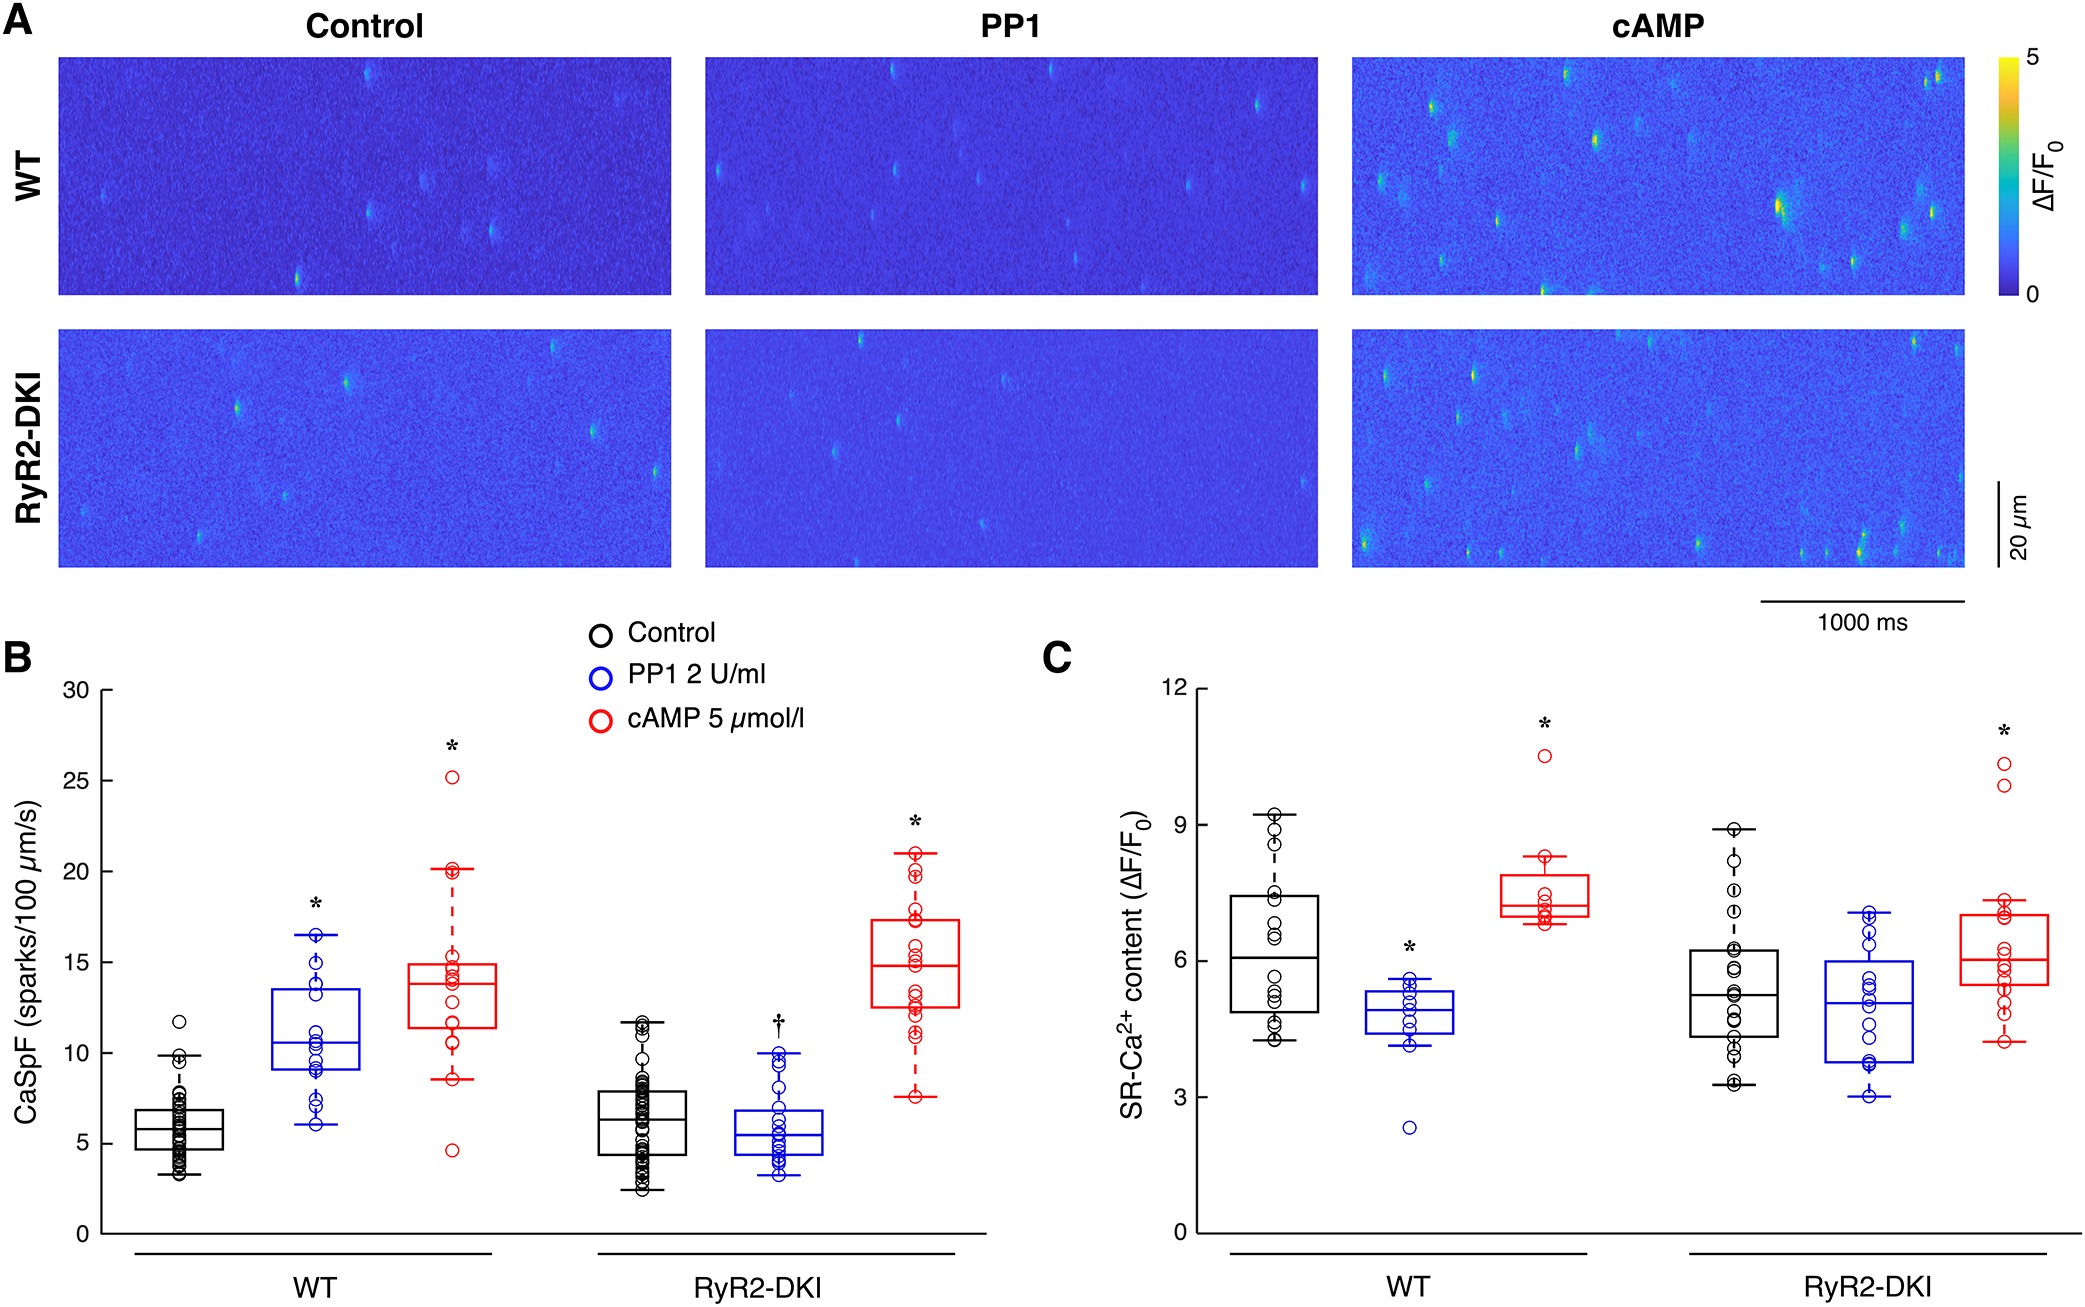
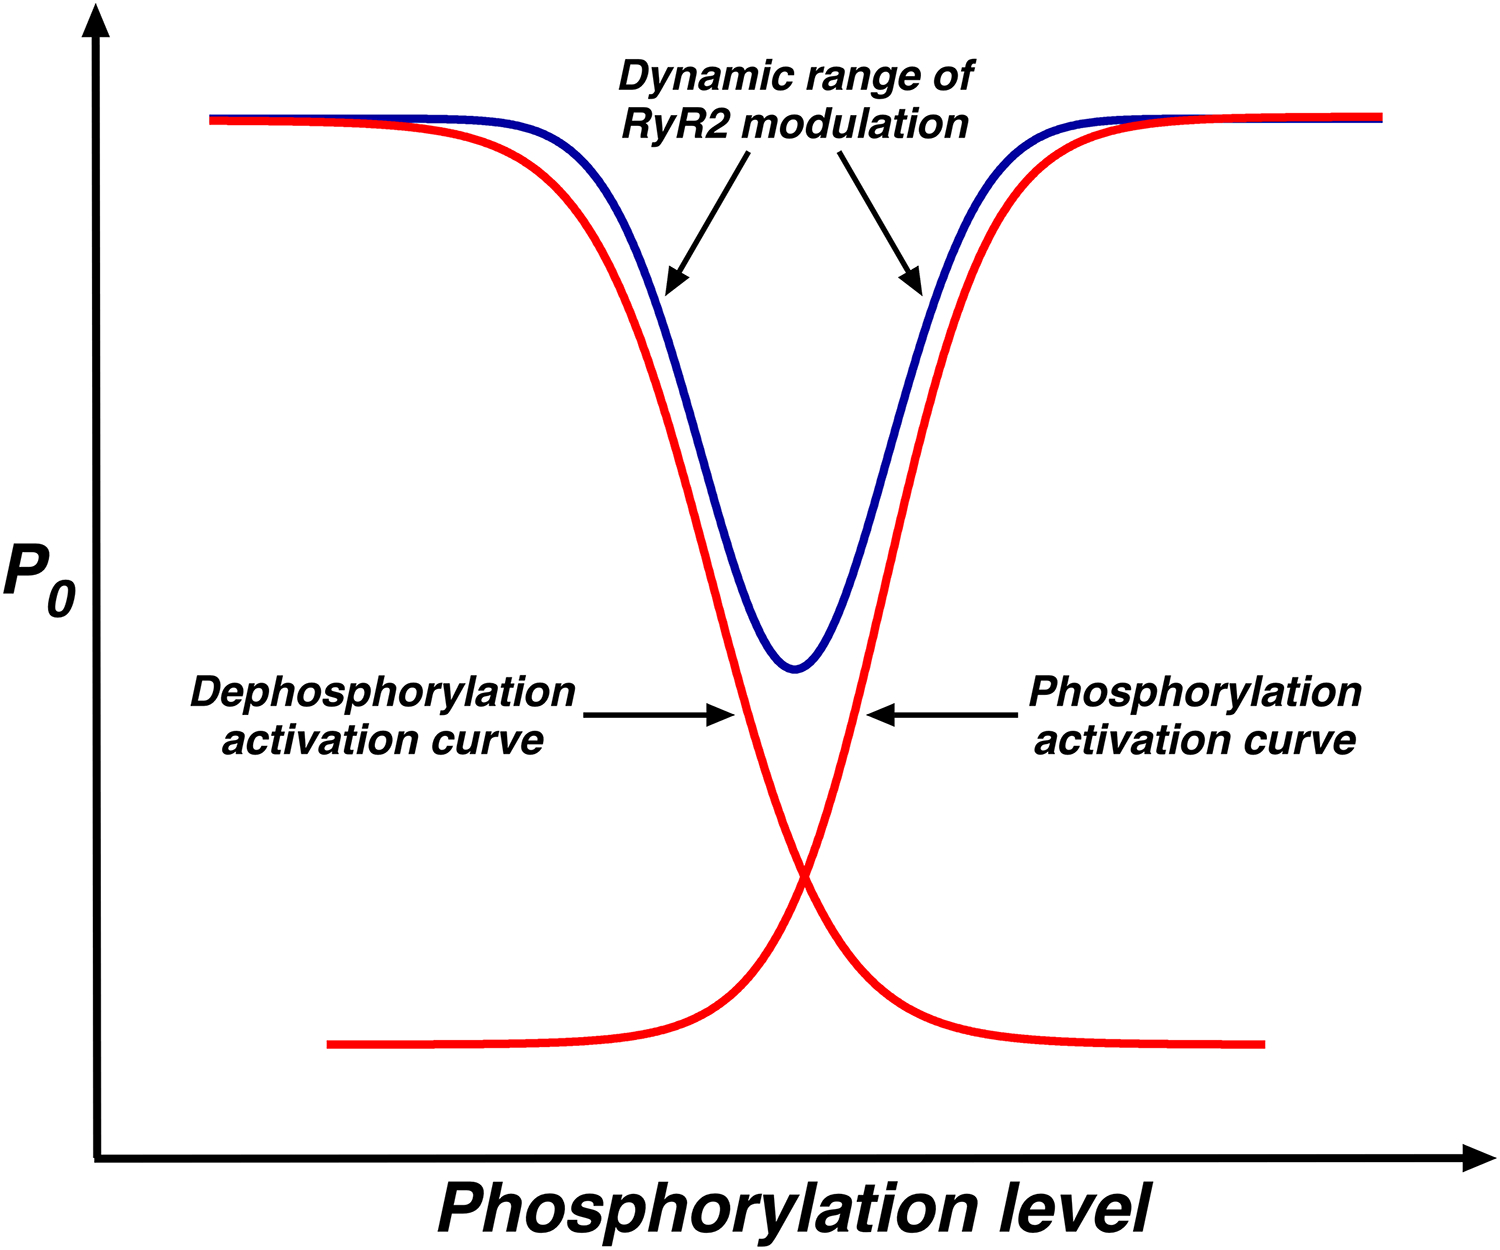
During exercise or stress, the sympathetic system stimulates cardiac contractility via β-adrenergic receptor (β-AR) activation, resulting in phosphorylation of the cardiac ryanodine receptor (RyR2). Three RyR2 phosphorylation sites have taken prominence in excitation-contraction coupling: S2808 and S2030 are described as protein kinase A specific and S2814 as a Ca2+/calmodulin kinase type-2-specific site. To examine the contribution of these phosphosites to Ca2+ signalling, we generated double knock-in (DKI) mice in which Ser2808 and Ser2814 phosphorylation sites have both been replaced by alanine (RyR2-S2808A/S2814A). These mice did not exhibit an overt phenotype. Heart morphology and haemodynamic parameters were not altered. However, they had a higher susceptibility to arrhythmias. We performed confocal Ca2+ imaging and electrophysiology experiments. Isoprenaline was used to stimulate β-ARs. Measurements of Ca2+ waves and latencies in myocytes revealed an increased propensity for spontaneous Ca2+ releases in DKI myocytes, both in control conditions and during β-AR stimulation. In DKI cells, waves were initiated from a lower threshold concentration of Ca2+ inside the sarcoplasmic reticulum, suggesting higher Ca2+ sensitivity of the RyRs. The refractoriness of Ca2+ spark triggering depends on the Ca2+ sensitivity of the RyR2. We found that RyR2-S2808A/S2814A channels were more Ca2+ sensitive in control conditions. Isoprenaline further shortened RyR refractoriness in DKI cardiomyocytes. Together, our results suggest that ablation of both the RyR2-Ser2808 and RyR2-S2814 sites increases the propensity for pro-arrhythmic spontaneous Ca2+ releases, as previously suggested for hyperphosphorylated RyRs. Given that the DKI cells present a full response to isoprenaline, the data suggest that phosphorylation of Ser2030 might be sufficient for β-AR-mediated sensitization of RyRs. KEY POINTS: Phosphorylation of cardiac sarcoplasmic reticulum Ca2+-release channels (ryanodine receptors, RyRs) is involved in the regulation of cardiac function. Ablation of both the RyR2-Ser2808 and RyR2-Ser2814 sites increases the propensity for pro-arrhythmic spontaneous Ca2+ releases, as previously suggested for hyperphosphorylated RyRs. The intra-sarcoplasmic reticulum Ca2+ threshold for spontaneous Ca2+ wave generation is lower in RyR2-double-knock-in cells. The RyR2 from double-knock-in cells exhibits increased Ca2+ sensitivity. Phosphorylation of Ser2808 and Ser2814 might be important for basal activity of the channel. Phosphorylation of Ser2030 might be sufficient for a β-adrenergic response.

Keywords: Ca2+‐induced Ca2+ release; cardiac muscle; dephosphorylation; excitation–contraction coupling; protein phosphatase; ryanodine receptor 2.


Conflict of interest statement

Competing interests:

The authors declare no competing interests.

Figures

Figure 1
Figure 1. Characterization of DKI mice.
A: Generation of the DKI mouse line. Please see method’s chapter for a complete description. B: The total RyR2 expression is comparable in RyR2-DKI and WT animals (two-sample t-test, N = 6, mixed males and females). C: Western blot analysis confirms the absence of phospho-epitopes Ser2808 and Ser2814 both in control conditions and in the presence of the catalytic subunit of PKA (cPKA) or Ca2+/calmodulin (10 μmol/L Ca2+). A marked increase of Ser2030 phosphorylation after cPKA can be seen in the blots from both animals. D: Absence of phosphorylation at Ser2808 and Ser2814 confirmed by immunofluorescence in isolated myocytes. E: Echocardiographic M-mode recording in WT and RyR2-DKI mice. Ventricular mass to body weight ratio and ejection fraction were not significantly different, but the DKI mice exhibited a higher heart rate. N = 13 (5 males and 8 females) for WT; N = 13 (6 males and 7 females) for RyR2-DKI. Significant differences: † p < 0.05 vs WT were assessed by two-sample t-test and in case of heart rate by Wilcoxon rank sum test (to test whether a data sample comes from a normal distribution Anderson-Darling test was used).
Figure 2
Figure 2. ECC in voltage-clamped cardiomyocytes.
A: Representative example of a voltage-clamped/Ca2+ transient single cardiac myocyte recording during a voltage step to 0 mV. B: Current-voltage relationship in control and in the presence of 100 nmol/L Iso. The voltage-clamp protocol is shown as an inset in the left panel. C: Amplitude of the Ca2+ transients was comparable, except at very positive voltages, similar to the ECC gain shown in D: Data for all parameters at each voltage were tested for outliers using generalized extreme Studentized deviate test for outliers in MATLAB. Box-whisker plots with overlying scatter plots were used to show the distributions of the measured parameters of ECC. Each circle represents a measurement from an individual cell. N = 3–6, n = 4–11 for WT; N = 6, n = 8–12 for RyR2-DKI. Solid lines represent fits with two-term exponential model (ECC gain), with Boltzmann function (current-voltage relationship) or with product of two Boltzmann functions (amplitudes of Ca2+ transients). Semi-transparent areas represent 95 % confidence intervals for fitted curves. F-test was used to compare global fit (both animal models together) with sum of separate fits for individual animal models for each parameter-voltage relationship in different experimental conditions.
Figure 3
Figure 3. Analysis of arrhythmia parameters.
A: Isolated ventricular myocytes were paced at 1 Hz for 30 seconds to study the propensity for pro-arrhythmic Ca2+ release. The confocal line-scan images and the fluorescence profile below show such an experiment, including the last 5 triggered transients. These are followed by spontaneous Ca2+ releases (SCaW) and the application of caffeine (10 mmol/L) to determine SR Ca2+ content. Red arrow shows the latency to the first spontaneous Ca2+ release (SCaW) after the stimuli. B: The occurrence of SCaW (% of cells) was higher in RyR2-DKI cells compared to WT during control conditions. Iso (100 nmol/L) increased the occurrence in both cell types. Significant differences were assessed by Fisher’s exact test with Benjamini–Hochberg correction for pairwise comparisons. C: Upon Iso treatment, the latency to the first SCaW was shorter in RyR2-DKI compared to control. D: Ca2+ wave speed was lower in the RyR2-DKI cells after Iso stimulation. E: Ca2+ transient amplitudes were smaller in the RyR2-DKI cells after Iso stimulation. F: the decay of the Ca2+ transients was significantly faster in RyR2-DKI in control conditions. Iso (red blots) accelerated the decay similarly in WT and mutant myocytes. G: The SR-Ca2+ content was significantly elevated after application of Iso in both type of cells. WT: N = 6, n = 18–20; RyR2-DKI: N = 8, n = 29–30 (panel G: WT: N = 5–6, n = 9–17; RyR2-DKI: N = 6–8, n = 11–25). Significant differences: * p < 0.05 vs control † p < 0.05 vs WT. H: Representative ECG traces in control conditions and during challenge protocol (epinephrine and caffeine). I: DKI mice exhibited a higher heart rate both in control conditions and under Iso and caffeine challenge. 2-way ANOVA with Tukey-Kramer post hoc test was used to assess significant differences among individual groups. J: Representative trace of ventricular bigeminy. K: Incidence of sustained (>5 seconds) arrhythmias in WT and RyR2-DKI mice. Significant difference was assessed by Fisher’s exact test. All measured ECG parameters are summarized in Table 3.
Figure 4
Figure 4. Increased SERCA activity in the RyR2-DKI myocytes.
A: Representative Western blotting of total SERCA, total phospholamban (PLB), and phosphorylation of PLB-Ser16 and PLB-Thr17 in protein homogenates of WT and RyR2-DKI hearts. B: Quantification of SERCA and PLB expression, as well as PLB phosphorylation. It shows that in mutant hearts the expression of PLB, the natural inhibitor of SERCA, is decreased (p = 0.0015, two-sample t-test) while its phosphorylation level is increased. This leads to higher SERCA activity in the RyR2-DKI hearts. * p < 0.05 vs. WT.
Figure 5
Figure 5. Calcium sparks in intact cells.
Ablation of RyR2-Ser2808 and Ser2814 phosphorylation sites does not modify the frequency of the Ca2+ sparks, but results in the increase of sparks mass and RyR2-mediated Ca2+ leak in both control and ISO conditions. A: Representative examples of Ca2+ sparks recorded in WT and RyR2-DKI myocytes. B, C, and D: Quantitative analysis of, respectively, Ca2+ sparks frequency, Ca2+ sparks mass, and RyR2-mediated Ca2+ leak. For the WT group: N = 4 hearts and n = 23 myocytes, for the RyR2-DKI group: N = 3 hearts and n = 14–17 myocytes. 2-way ANOVA with Tukey-Kramer post hoc test was used to assess significant differences among individual groups. * p < 0.05 vs control; † p < 0.05 vs WT.
Figure 6
Figure 6. Acute de-phosphorylation by PP1 increased CaSpF in WT but not in RyR2-DKI cells.
A: Confocal line-scan images of Ca2+ sparks recorded in permeabilized cells under control conditions, 1 minute after exposure to protein phosphatase-1 (PP1; 2 U/mL) or 10 minutes after application of 5 μmol/L cAMP. B: Basal Ca2+ spark frequency (CaSpF) was similar both in RyR2-DKI and WT myocytes; PP1 increased the CaSpF in WT but failed to modify the spontaneous activity of mutant cells. cAMP elevated CaSpF in both types of cells. WT: N = 5–8, n = 17–53; RyR2-DKI: N = 5–9, n = 19–61. C: The amplitudes of the caffeine-induced Ca2+ transients were similar in control between WT and RyR2-DKI. Only in WT myocytes, the increased CaSpF was accompanied by partial depletion of the SR Ca2+ content. WT: N = 4–6, n = 8–16; RyR2-DKI: N = 5–6, n = 16–22. Significant differences: * p < 0.05 vs control and † p < 0.05 vs WT.
Figure 7.
Figure 7.. Estimates of intra-SR Ca2+ wave thresholds in WT and RyR2-DKI myocytes.
A: Representative line-scan images (upper panel) and respective traces (lower panel) of cytosolic and SR luminal Ca2+ signals in permeabilized cardiomyocytes from WT and RyR2-DKI mice. B: Quantitative analysis of SR Ca2+ wave threshold in permeabilized cardiomyocytes with a [Ca2+]cyt of 100 nmol/L. WT: N = 9, n = 17; RyR2-DKI: N = 6, n = 14. Significant differences: † p < 0.05 vs WT.
Figure 8.
Figure 8.. Spark recovery analysis indicates elevated Ca2+ sensitivity in RyR2-DKI cardiomyocytes.
A: Representative line-scan image in the presence of a very low concentration of ryanodine (50 nmol/L), which can induce repetitive sparks. B: Histograms of delays of Ca2+ sparks in control conditions and in the presence of 100 nmol/L Iso. Black vertical lines are medians of respective spark-to-spark delay distributions. C: Summary and comparison of medians with 95% confidence intervals of each individual groups. WT: control N = 6, n = 25, 497 spark pairs; Iso N = 6, n = 35, 1334 spark pairs. RyR2-DKI: control N = 6, n = 18, 563 spark pairs; Iso N = 6, n = 19, 1120 spark pairs. Individual groups were tested for the significance using Kruskal Wallis test with Dunn-Sidak post hoc test.
Figure 9
Figure 9. Proposed model for regulation of RyR2 activity by its degree of phosphorylation.
Both protein kinases and protein phosphatases may increase RyR2 activity. The blue curve represents the dynamic range of bimodal regulation of RyR2 by dephosphorylation (left curve) and phosphorylation (right curve).

References

    1. Alvarado FJ, Chen X & Valdivia HH (2017). Ablation of the cardiac ryanodine receptor phospho-site Ser2808 does not alter the adrenergic response or the progression to heart failure in mice. J Mol Cell Cardiol 103, 40–47. - PMC - PubMed
    1. Bankhead P, Scholfield CN, Curtis TM & McGeown JG (2011). Detecting Ca2+ sparks on stationary and varying baselines. Am J Physiol Cell Physiol 301, C717–28. - PubMed
    1. Benkusky NA, Weber CS, Scherman JA, Farrell EF, Hacker TA, John MC, Powers PA & Valdivia HH (2007). Intact beta-adrenergic response and unmodified progression toward heart failure in mice with genetic ablation of a major protein kinase A phosphorylation site in the cardiac ryanodine receptor. Circ Res 101, 819–829. - PubMed
    1. Bers DM (2002). Cardiac excitation-contraction coupling. Nature 415, 198–205. - PubMed
    1. Bers DM & Berlin JR (1995). Kinetics of [Ca]i decline in cardiac myocytes depend on peak [Ca]i. Am J Physiol-Cell Physiol 268, C271–C277. - PubMed

MeSH terms