

Assessment of the Effective Sensitivity of SARS-CoV-2 Sample Pooling Based on a Large-Scale Screening Experience: Retrospective Analysis
- PMID: 39316785
- PMCID: PMC11462102
- DOI: 10.2196/54503
Assessment of the Effective Sensitivity of SARS-CoV-2 Sample Pooling Based on a Large-Scale Screening Experience: Retrospective Analysis
Abstract
Background: The development of new large-scale saliva pooling detection strategies can significantly enhance testing capacity and frequency for asymptomatic individuals, which is crucial for containing SARS-CoV-2.
Objective: This study aims to implement and scale-up a SARS-CoV-2 screening method using pooled saliva samples to control the virus in critical areas and assess its effectiveness in detecting asymptomatic infections.
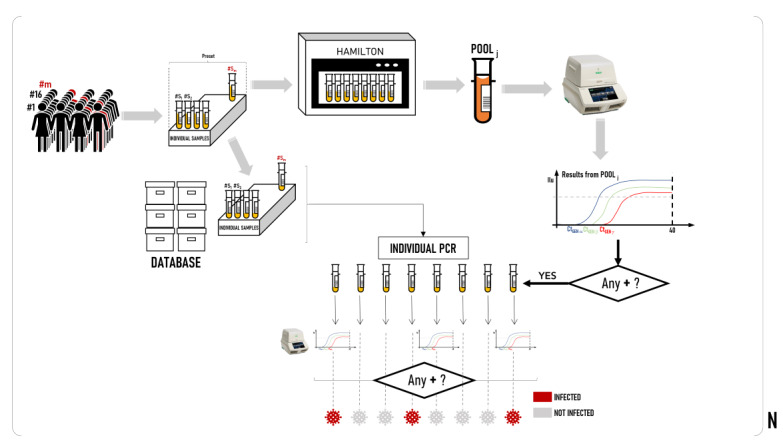
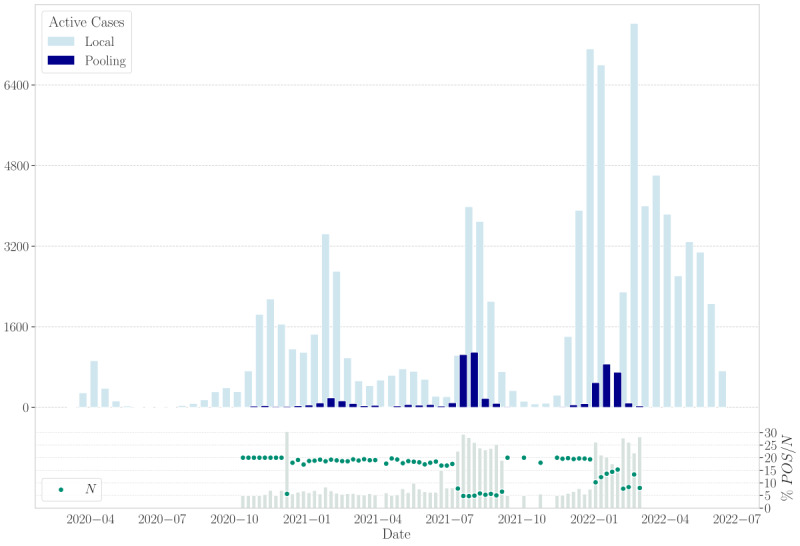
Methods: Between August 2020 and February 2022, our laboratory received a total of 928,357 samples. Participants collected at least 1 mL of saliva using a self-sampling kit and registered their samples via a smartphone app. All samples were directly processed using AutoMate 2550 for preanalytical steps and then transferred to Microlab STAR, managed with the HAMILTON Pooling software for pooling. The standard pool preset size was 20 samples but was adjusted to 5 when the prevalence exceeded 2% in any group. Real-time polymerase chain reaction (RT-PCR) was conducted using the Allplex SARS-CoV-2 Assay until July 2021, followed by the Allplex SARS-CoV-2 FluA/FluB/RSV assay for the remainder of the study period.
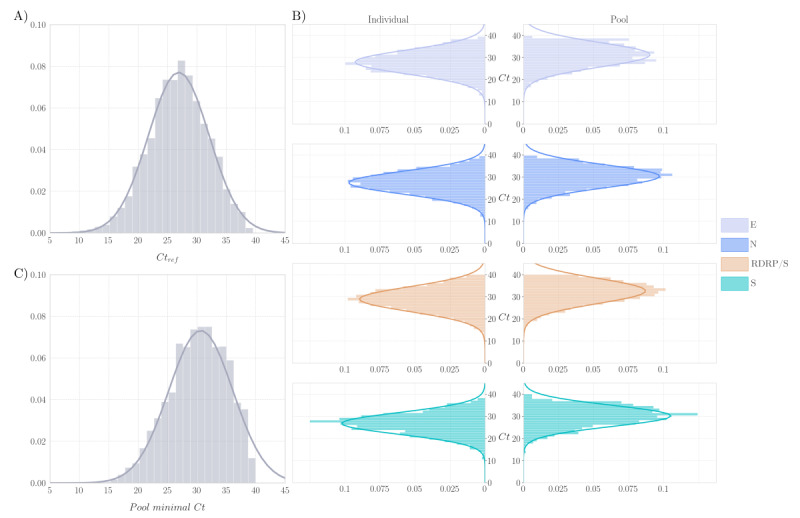
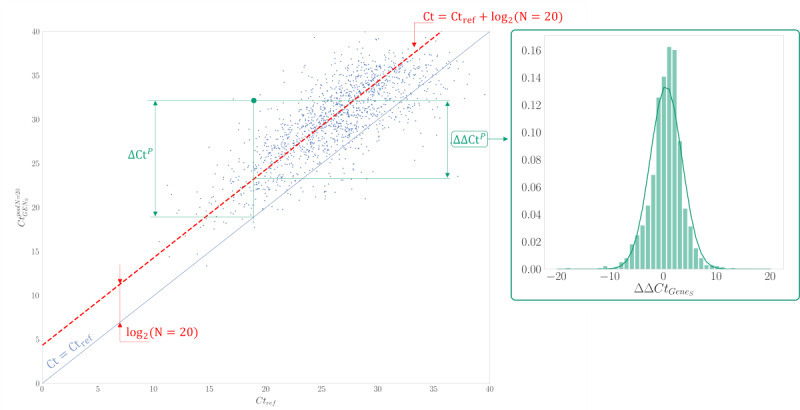
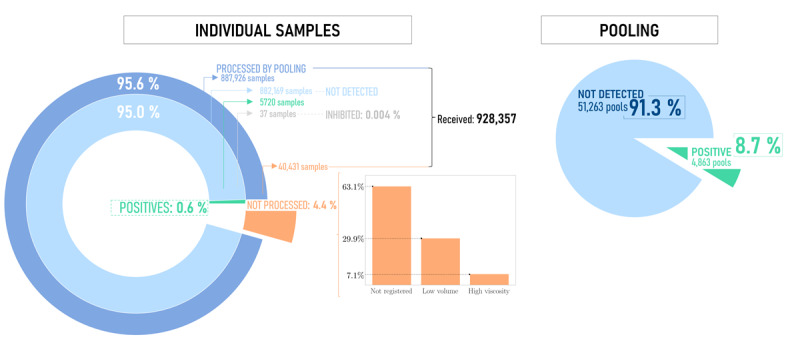
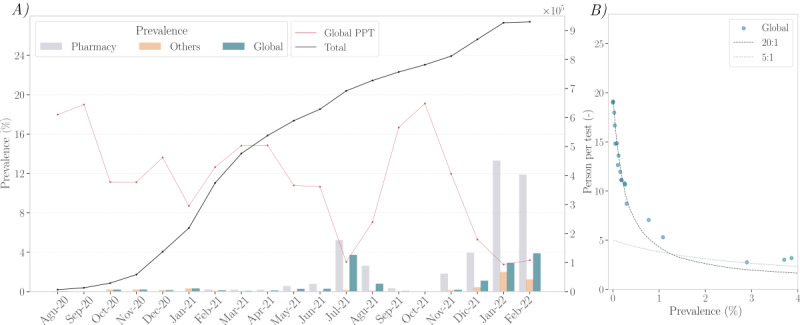
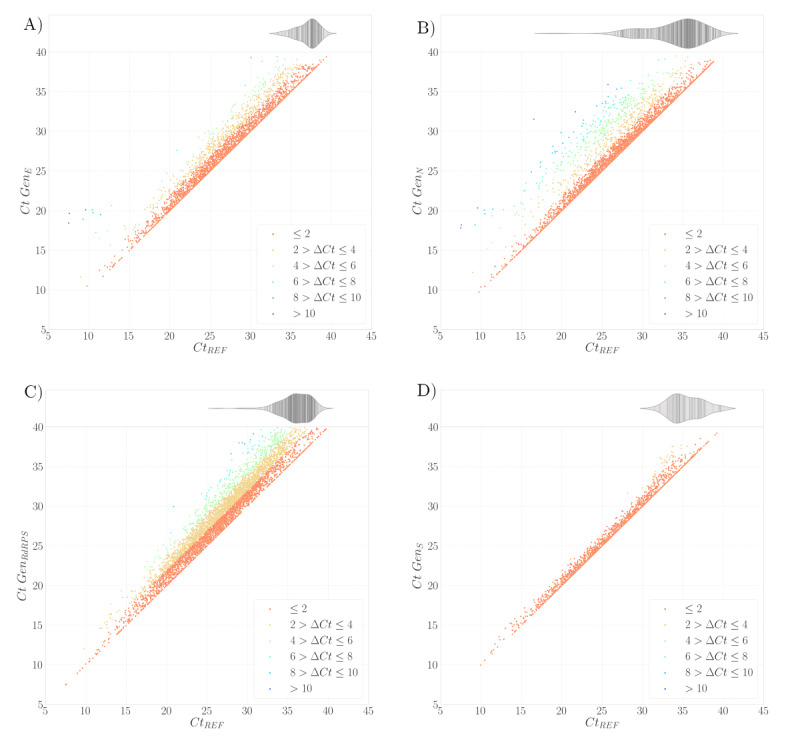
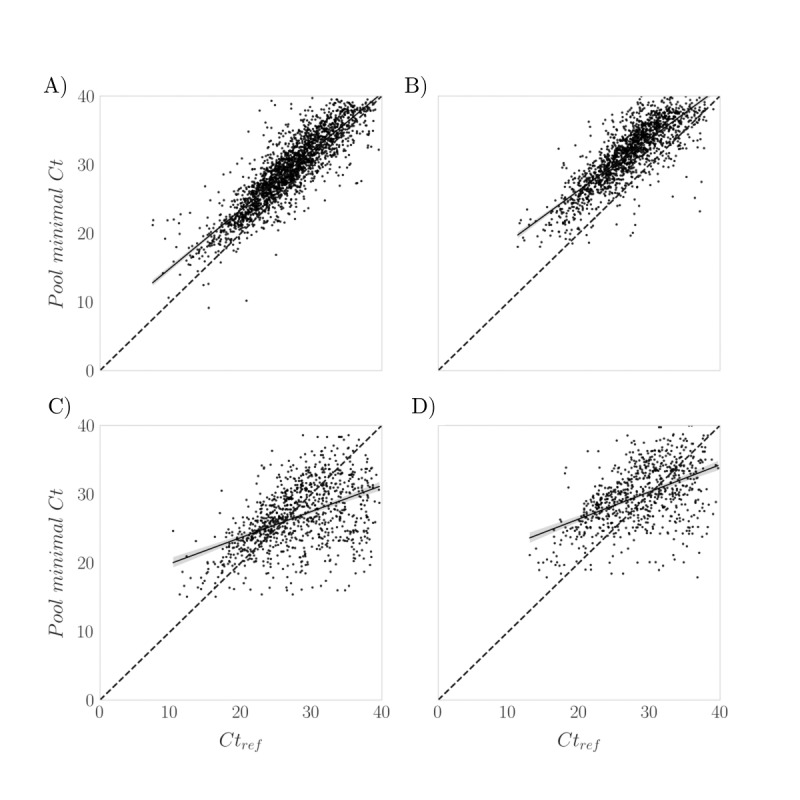
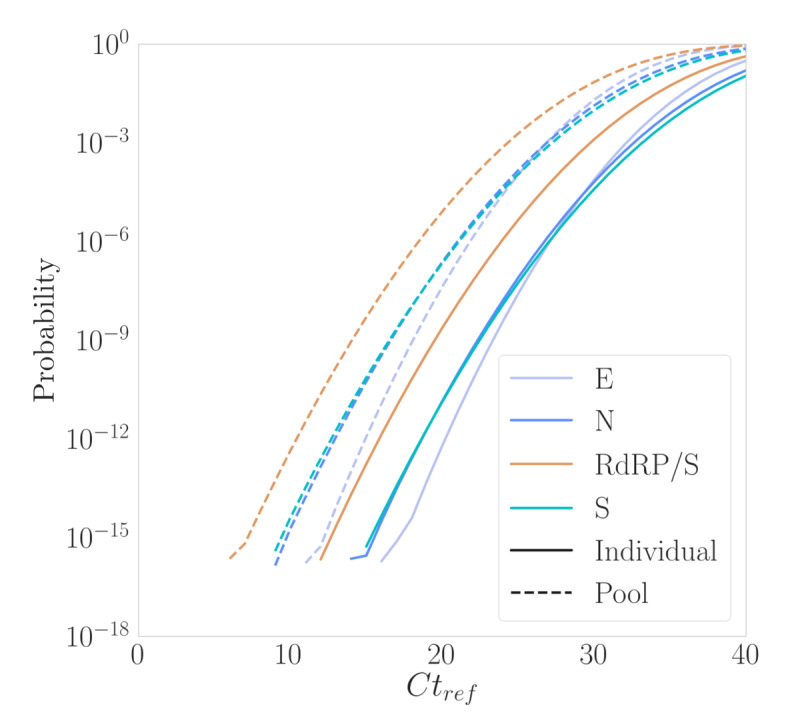
Results: Of the 928,357 samples received, 887,926 (95.64%) were fully processed into 56,126 pools. Of these pools, 4863 tested positive, detecting 5720 asymptomatic infections. This allowed for a comprehensive analysis of pooling's impact on RT-PCR sensitivity and false-negative rate (FNR), including data on positive samples per pool (PPP). We defined Ctref as the minimum cycle threshold (Ct) of each data set from a sample or pool and compared these Ctref results from pooled samples with those of the individual tests (ΔCtP). We then examined their deviation from the expected offset due to dilution [ΔΔCtP = ΔCtP - log2]. In this work, the ΔCtP and ΔΔCtP were 2.23 versus 3.33 and -0.89 versus 0.23, respectively, comparing global results with results for pools with 1 positive sample per pool. Therefore, depending on the number of genes used in the test and the size of the pool, we can evaluate the FNR and effective sensitivity (1 - FNR) of the test configuration. In our scenario, with a maximum of 20 samples per pool and 3 target genes, statistical observations indicated an effective sensitivity exceeding 99%. From an economic perspective, the focus is on pooling efficiency, measured by the effective number of persons that can be tested with 1 test, referred to as persons per test (PPT). In this study, the global PPT was 8.66, reflecting savings of over 20 million euros (US $22 million) based on our reagent prices.
Conclusions: Our results demonstrate that, as expected, pooling reduces the sensitivity of RT-PCR. However, with the appropriate pool size and the use of multiple target genes, effective sensitivity can remain above 99%. Saliva pooling may be a valuable tool for screening and surveillance in asymptomatic individuals and can aid in controlling SARS-CoV-2 transmission. Further studies are needed to assess the effectiveness of these strategies for SARS-CoV-2 and their application to other microorganisms or biomarkers detected by PCR.
Keywords: COVID-19; PCR; SARS-CoV-2; nonsymptomatic; pooling; saliva; screening; sensitivity; surveillance; transmission control.
©Jorge J Cabrera Alvargonzalez, Ana Larrañaga, Javier Martinez, Sonia Pérez Castro, Sonia Rey Cao, Carlos Daviña Nuñez, Víctor Del Campo Pérez, Carmen Duran Parrondo, Silvia Suarez Luque, Elena González Alonso, Alfredo José Silva Tojo, Jacobo Porteiro, Benito Regueiro. Originally published in JMIR Public Health and Surveillance (https://publichealth.jmir.org), 24.09.2024.
Conflict of interest statement
Conflicts of Interest: None declared.
Figures
Similar articles
-
Effectiveness and cost-effectiveness of four different strategies for SARS-CoV-2 surveillance in the general population (CoV-Surv Study): a structured summary of a study protocol for a cluster-randomised, two-factorial controlled trial.Trials. 2021 Jan 8;22(1):39. doi: 10.1186/s13063-020-04982-z. Trials. 2021. PMID: 33419461 Free PMC article.
-
Evaluation of sample pooling for screening of SARS CoV-2.PLoS One. 2021 Feb 26;16(2):e0247767. doi: 10.1371/journal.pone.0247767. eCollection 2021. PLoS One. 2021. PMID: 33635923 Free PMC article.
-
Evaluation of Fecal Sample Pooling for Real-Time RT-PCR Testing SARS-CoV-2 in Animals.Viruses. 2024 Oct 23;16(11):1651. doi: 10.3390/v16111651. Viruses. 2024. PMID: 39599766 Free PMC article.
-
Universal screening for SARS-CoV-2 infection: a rapid review.Cochrane Database Syst Rev. 2020 Sep 15;9(9):CD013718. doi: 10.1002/14651858.CD013718. Cochrane Database Syst Rev. 2020. PMID: 33502003 Free PMC article.
-
Diagnostic performance of different sampling approaches for SARS-CoV-2 RT-PCR testing: a systematic review and meta-analysis.Lancet Infect Dis. 2021 Sep;21(9):1233-1245. doi: 10.1016/S1473-3099(21)00146-8. Epub 2021 Apr 12. Lancet Infect Dis. 2021. PMID: 33857405 Free PMC article.
Cited by
-
Implementation of pooled testing to increase access to routine viral load monitoring for people living with HIV on antiretroviral therapy.Sci Rep. 2025 Apr 27;15(1):14713. doi: 10.1038/s41598-025-92709-y. Sci Rep. 2025. PMID: 40289156 Free PMC article.
-
Impact of viral load on sample pooling for reverse-transcription polymerase chain reaction detection-based diagnosis of coronavirus disease 2019 in Nigeria.Afr J Lab Med. 2025 Feb 10;14(1):2514. doi: 10.4102/ajlm.v14i1.2514. eCollection 2025. Afr J Lab Med. 2025. PMID: 40061863 Free PMC article.
References
-
- World Health Organization WHO COVID-19 dashboard. data.who.int. [2023-08-15]. https://data.who.int/dashboards/covid19/cases?n=c .
-
- Ferretti L, Wymant C, Kendall M, Zhao L, Nurtay A, Abeler-Dörner Lucie, Parker M, Bonsall D, Fraser C. Quantifying SARS-CoV-2 transmission suggests epidemic control with digital contact tracing. Science. 2020 May 08;368(6491):6936. doi: 10.1126/science.abb6936. https://www.science.org/doi/abs/10.1126/science.abb6936?url_ver=Z39.88-2... science.abb6936 - DOI - DOI - PMC - PubMed
-
- Hellewell J, Abbott S, Gimma A, Bosse NI, Jarvis CI, Russell TW, Munday JD, Kucharski AJ, Edmunds WJ, Centre for the Mathematical Modelling of Infectious Diseases COVID-19 Working Group. Funk S, Eggo RM. Feasibility of controlling COVID-19 outbreaks by isolation of cases and contacts. Lancet Glob Health. 2020 Apr;8(4):e488–e496. doi: 10.1016/S2214-109X(20)30074-7. https://linkinghub.elsevier.com/retrieve/pii/S2214-109X(20)30074-7 S2214-109X(20)30074-7 - DOI - PMC - PubMed
-
- Riou J, Althaus CL. Pattern of early human-to-human transmission of Wuhan 2019 novel coronavirus (2019-nCoV), December 2019 to January 2020. Euro Surveill. 2020 Jan;25(4):2000058. doi: 10.2807/1560-7917.ES.2020.25.4.2000058. https://boris.unibe.ch/id/eprint/139715 - DOI - PMC - PubMed
-
- Gandhi M, Yokoe DS, Havlir DV. Asymptomatic transmission, the Achilles' heel of current strategies to control Covid-19. N Engl J Med. 2020 May 28;382(22):2158–2160. doi: 10.1056/NEJMe2009758. https://europepmc.org/abstract/MED/32329972 - DOI - PMC - PubMed
MeSH terms
LinkOut - more resources
Full Text Sources
Medical
Miscellaneous
