. 2024 Nov 20;112(22):3715-3733.e9.
doi: 10.1016/j.neuron.2024.08.015. Epub 2024 Sep 23.

The sodium-bicarbonate cotransporter Slc4a5 mediates feedback at the first synapse of vision

Affiliations

The sodium-bicarbonate cotransporter Slc4a5 mediates feedback at the first synapse of vision

Rei Morikawa et al. Neuron. .

Abstract

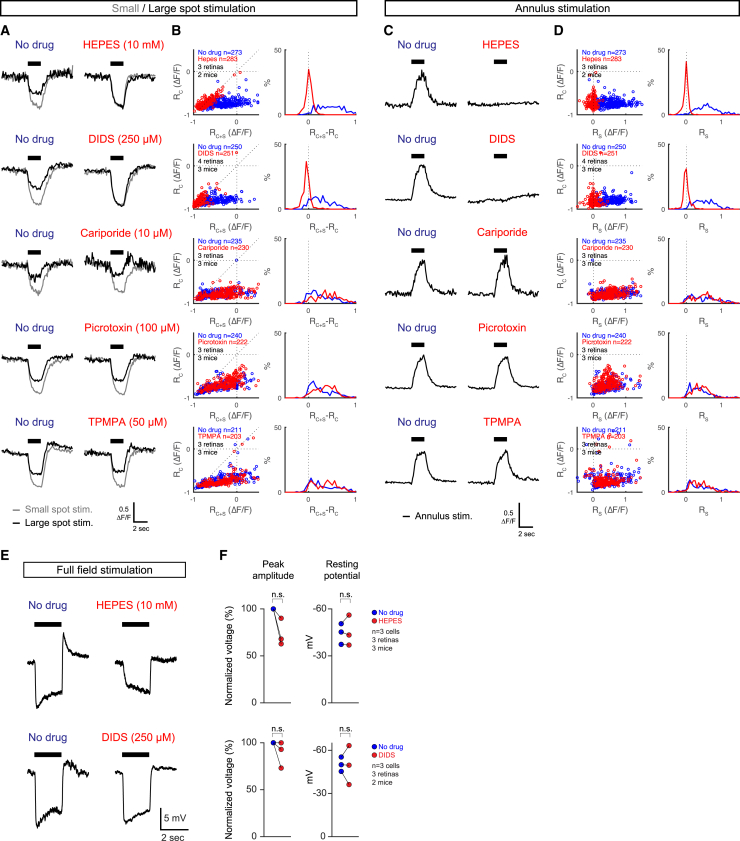
Feedback at the photoreceptor synapse is the first neuronal circuit computation in vision, which influences downstream activity patterns within the visual system. Yet, the identity of the feedback signal and the mechanism of synaptic transmission are still not well understood. Here, we combined perturbations of cell-type-specific genes of mouse horizontal cells with two-photon imaging of the result of light-induced feedback in cones and showed that the electrogenic bicarbonate transporter Slc4a5, but not the electroneutral bicarbonate transporter Slc4a3, both expressed specifically in horizontal cells, is necessary for horizontal cell-to-cone feedback. Pharmacological blockage of bicarbonate transporters and buffering pH also abolished the feedback but blocking sodium-proton exchangers and GABA receptors did not. Our work suggests an unconventional mechanism of feedback at the first visual synapse: changes in horizontal cell voltage modulate bicarbonate transport to the cell, via Slc4a5, which leads to the modulation of feedback to cones.

Keywords: CRISPR; calcium imaging; cone; feedback; horizontal cell; inhibitory feedback; inhibitory neuron; knock out; lateral inhibition; mouse; negative feedback; retina; surround inhibition; synaptic transmission; two-photon imaging; vision.


Conflict of interest statement

Declaration of interests The authors declare no competing interests.

Figures

None
Graphical abstract
Figure 1
Figure 1
Slc4a5 knockout mice lack horizontal cell feedback (A) Left: GCaMP6s was targeted to cones by subretinal injection of BP2 serotype AAV-ProA1-GCaMP6s. Right: schematic of the retina. Cones, green; horizontal cells, red. Dashed line, focal plane of two-photon imaging. ONL, outer nuclear layer; INL, inner nuclear layer; GCL, ganglion cell layer. (B) Two visual stimulation approaches to evoke horizontal cell feedback. Schematics of the time courses, the spatial configurations of the stimuli, and the expected responses of the cones in the imaging area are shown. Left: stimulations with small or large spots. Right: stimulation with an annulus. (C) Two-photon images of cone axon terminals expressing GCaMP6s in wild-type (WT), Slc4a3tm1, and Slc4a5tm1 mice. (D) Small (gray) and large (black) spot stimulation response traces of GCaMP6s fluorescence in a single cone terminal in no-drug control (left) and in NBQX (right). (E) Left: scatterplot of cone responses to a large spot (RC+S) and a small spot (RC) in no-drug control (blue) and in NBQX (red). Right: histogram of the difference between large and small spot responses (RC+S − RC) in no-drug control (blue) and in NBQX (red). (F) Annulus stimulation response traces of GCaMP6s fluorescence in a single cone terminal in no-drug control (left) and in NBQX (right). The traces are from the same cells as shown in (D). (G) Left: scatterplot of cone responses to an annulus (RS) and to a small spot (RC) in no-drug control (blue) and in NBQX (red). Right: histogram of annulus response (RS) in no-drug control (blue) and in NBQX (red). (H) Left: EGFP was targeted to horizontal cells by intravenous injection of PHP.eB serotype AAV-ProA445-EGFP. Right: schematic of two-photon guided sharp electrode recording of horizontal cells. (I) Confocal images of a retinal section from a mouse injected with PHP.eB AAV-ProA445-EGFP. Calbindin was immunostained as a marker for horizontal cells (magenta). Höchst was used to stain the nuclei (gray). Arrowheads, horizontal cell somas. (J) Two-photon images of the EGFP labeled horizontal cells (green) and the recorded dye-filled horizontal cell (red). Arrows indicate the sharp electrode filled with Alexa 568 dye. (K) Full-field stimulation response traces of membrane voltages in a horizontal cell in wild-type (WT) and Slc4a5tm1 mice. (L) Response peak amplitude and resting potential of horizontal cells in wild-type (WT) and Slc4a5tm1 mice. Two outliers are removed from the peak amplitude plot. (M) The proposed Slc4a5-dependent mechanism of light-evoked horizontal cell feedback. VGCC, voltage-gated calcium channel; Glu, glutamate; In, intracellular space; Ex, extracellular space. Illustrations were partly created by BioRender. See also Figures S1–S5.
Figure 2
Figure 2
Feedback at different stimulation contrasts in wild-type and Slc4a5 knockout mice (A) Schematics of small spot stimulation to evoke direct light responses in cones with different contrasts. (B and D) Small spot response traces of GCaMP6s fluorescence in a single cone terminal with different contrasts in wild type (B) and Slc4a5tm1 (D). (C and E) Left: histogram of small spot responses (RC) with different contrasts in wild type (4 retinas, 3 mice) (C) and in Slc4a5tm1 (3 retinas, 3 mice) (E). (F and G) Schematics of two approaches to evoke horizontal cell feedback with different stimulation contrasts. (H and L) Response traces of GCaMP6s fluorescence in a single cone terminal with small or combination spot stimulation of different contrasts in wild type (H) and in Slc4a5tm1 (L). (J and N) Wild type (4 retinas, 3 mice) (J) and Slc4a5tm1 (3 retinas, 3 mice) (N). From left to right: scatterplot of cone responses to a combination spot of different contrasts (RC+S) and a small spot of 100% contrast (RC); two-dimensional Gaussian fit of the scatterplot; histogram of the difference between combination and small spot responses (RC+S − RC); median of the difference between combination and small spot responses (RC+S − RC) as a function of stimulation contrast. (I and M) Response traces of GCaMP6s fluorescence in a single cone terminal with annulus stimulation of different contrasts in wild type (I) and in Slc4a5tm1 (M). The traces are from the same cells as shown in (H) and (L). (K and O) Wild type (4 retinas, 3 mice) (K), Slc4a5tm1 (3 retinas, 3 mice) (O). From left to right: scatterplot of cone responses to an annulus of different contrasts (RS) and a small spot of 100% contrast (RC); two-dimensional Gaussian fit of the scatterplot; histogram of annulus responses (RS); median of annulus responses (RS) as a function of stimulation contrast.
Figure 3
Figure 3
Feedback at different stimulation sizes in wild-type and Slc4a5 knockout mice (A and B) Schematics of two approaches to evoke horizontal cell feedback with different stimulation sizes. (C and G) Response traces of GCaMP6s fluorescence in a single cone terminal with a small spot or large spots of different sizes in wild type (C) and in Slc4a5tm1 (G). (E and I) Wild type (3 retinas, 3 mice) (E), Slc4a5tm1 (4 retinas, 3 mice) (I). From left to right: scatterplot of cone responses to a large spot of different diameters (RC+S) and a small spot (RC); two-dimensional Gaussian fit of the scatterplot; histogram of the difference between large and small spot responses (RC+S − RC); median of the difference between large and small spot responses (RC+S − RC) as a function of large spot diameter. (D and H) Response traces of GCaMP6s fluorescence in a single cone terminal with annulus stimulation of different outer diameters in wild type (D) and in Slc4a5tm1 (H). The traces are from the same cells as shown in (C) and (G). (F and J) Wild type (3 retinas, 3 mice) (F), Slc4a5tm1 (4 retinas, 3 mice) (J). From left to right: scatterplot of cone responses to an annulus of different outer diameters (RS) and a small spot (RC); two-dimensional Gaussian fit of the scatterplot; histogram of annulus responses (RS); median of annulus responses (RS) as a function of stimulation contrast.
Figure 4
Figure 4
Feedback in the dorsal retina of wild-type and Slc4a5 knockout mice (A and G) Wild type (A), Slc4a5tm1 (G). Left and middle: scatterplot of cone responses to a large spot (RC+S) and a small spot (RC) in no-drug control (blue) and in NBQX (red) in ventral and dorsal retina. Right: histogram of small spot responses in no-drug control. Dashed blue line, cone responses in the ventral retina. Solid blue line, cone responses in the dorsal retina. (C and I) Wild type (C), Slc4a5tm1 (I). Small (gray) and large (black) spot stimulation response traces of GCaMP6s fluorescence in a single low-response cone terminal (RC > −0.3, top) or high-response cone terminal (RC < −0.3, bottom) in no-drug control (left) and in NBQX (right). (D and J) Histogram of the difference between large and small spot responses (RC+S − RC) in wild type (D) and in Slc4a5tm1 (J). (B and H) Wild type (B), Slc4a5tm1 (H). Scatterplot of cone responses to an annulus (RS) and a small spot (RC) in no-drug control (blue) and in NBQX (red) in ventral and dorsal retina. (E and K) Wild type (E), Slc4a5tm1 (K). Annulus response traces of GCaMP6s fluorescence in a single low-response cone terminal (RC > −0.3, top) or high-response cone terminal (RC < −0.3, bottom) in no-drug control (left) and in NBQX (right). The traces are from the same cells as shown in (C) and (I). (F and L) Histogram of annulus response (RS) in no-drug control (blue) and in NBQX (red) in wild type (F) and in Slc4a5tm1 (L).
Figure 5
Figure 5
Pharmacology of horizontal cell feedback (A) Small (gray) and large (black) spot stimulation response traces of GCaMP6s fluorescence in a single cone terminal in no-drug control, in HEPES, in DIDS, in cariporide, in picrotoxin, and in TPMPA. (B) Left: scatterplot of cone responses to a large spot (RC+S) and a small spot (RC) in no-drug control (blue) and in the indicated drugs (red). Right: histogram of the difference between large and small spot responses (RC+S − RC) in no-drug control (blue) and in the indicated drugs (red). (C) Annulus stimulation response traces of GCaMP6s fluorescence in a single cone terminal in no-drug control and in the indicated drugs. The traces are from the same cells as shown in (A). (D) Left: scatterplot of cone responses to an annulus (RS) and to a small spot (RC) in no-drug control (blue) and in the indicated drugs (red). Right: histogram of annulus response (RS) in no-drug control (blue) and in the indicated drugs (red). (E) Full-field stimulation response traces of membrane voltages in a horizontal cell in no-drug control, in HEPES, and in DIDS. (F) Response peak amplitude and resting potential of horizontal cells in no-drug control, in HEPES, and in DIDS. See also Figures S6 and S7.
Figure 6
Figure 6
Cone synapses are structurally and functionally intact in Slc4a5 knockout mice (A) Serial block-face electron microscopy of cone synapses in wild-type (WT, left) and Slc4a5tm1 (right) mice. Pale red, horizontal cell processes. Yellow arrows, synaptic ribbons. (B) Synaptic ribbon counts and areas in wild-type (WT) and Slc4a5tm1 mice. (C–H) Calcium imaging of ganglion cells in wild-type and Slc4a5tm1 mice. (C) Left: GCaMP6s was targeted to ganglion cells by intravenous injection of serotype-PHP.eB AAV-ProA5-GCaMP6s. Right: schematic of the retina with ganglion cells labeled with GCaMP6s (green). Dashed line, focal plane of two-photon imaging. ONL, outer nuclear layer; INL, inner nuclear layer; GCL, ganglion cell layer. (D) Confocal images of a retinal section from a mouse injected as in (C), stained for GCaMP6s with an anti-GFP antibody. Cell nuclei were labeled with Höchst. (E) Two-photon images of ganglion cell bodies expressing GCaMP6s in wild-type and Slc4a5tm1 mice. (F) Response traces of ON, OFF, and ON-OFF cells in wild-type and Slc4a5tm1 mice. The shades indicate the timing of light stimulation. (G) Percentages of ON, OFF, and ON-OFF ganglion cells in wild-type and Slc4a5tm1 mice. (H) Response amplitude of ganglion cells in wild-type and Slc4a5tm1 mice. See also Figures S8 and S9.
Figure 7
Figure 7
Horizontal-cell-specific knockdown of Slc4a5 in adult mice (A) Horizontal-cell-specific targeting of shRNAs against Slc4a5 and simultaneous labeling of cones with GCaMP6s. Schematic of the retina shows horizontal cells labeled with tdTomato (red) and cones with GCaMP6s (green). Dashed line, focal plane of two-photon imaging. ONL, outer nuclear layer; INL, inner nuclear layer; GCL, ganglion cell layer. (B) Confocal images of retinal sections from mice injected as in (A), stained for GCaMP6s, Calbindin, and tdTomato with anti-GFP, anti-Calbindin, and anti-RFP antibodies, respectively. Cell nuclei were labeled with Höchst. (C) Two-photon images of cone axon terminals expressing GCaMP6s in Cre−/− control and Cre+/−Slc4a5 knockdown mice. (D) Small (gray) and large (black) spot stimulation response traces of GCaMP6s fluorescence in a single cone terminal in no-drug control (left) and in NBQX (right). (E) Left: scatterplot of cone responses to a large spot (RC+S) and a small spot (RC) in no-drug control (blue) and in NBQX (red). Right: histogram of the difference between large and small spot responses (RC+S − RC) in no-drug control (blue) and in NBQX (red). (F) Annulus stimulation response traces of GCaMP6s fluorescence in a single cone terminal in no-drug control (left) and in NBQX (right). The traces are from the same cells as shown in (D). (G) Left: scatterplot of cone responses to an annulus (RS) and to a small spot (RC) in no-drug control (blue) and in NBQX (red). Right: histogram of annulus response (RS) in no-drug control (blue) and in NBQX (red). See also Figures S10 and S11.
Figure 8
Figure 8
Expression patterns of SLC4A5 in human retina (A) In situ hybridization of SLC4A5 (magenta) and ONECUT1 (a horizontal cell marker, green) in a human retina. DAPI marks cell nuclei (gray). ONL, outer nuclear layer; INL, inner nuclear layer; GCL, ganglion cell layer. (B and C) Expression patterns of SLC4A3 and SLC4A5 as well as horizontal cell marker genes (NTRK1, ONECUT1, ONECUT2, NAT16, TNR, TBC1D16, LHX1, and CMYA5) and retinal pigmented epithelium (RPE) marker genes (RPE65, MITF, and PMEL) in a previously published single-cell sequencing data of the human retina and choroid across major cell classes (B), and in horizontal cells from peripheral or foveal regions (C).

References

    1. Baylor D.A., Fuortes M.G., O’Bryan P.M. Receptive fields of cones in the retina of the turtle. J. Physiol. 1971;214:265–294. doi: 10.1113/jphysiol.1971.sp009432. - DOI - PMC - PubMed
    1. Chapot C.A., Euler T., Schubert T. How do horizontal cells “talk” to cone photoreceptors? Different levels of complexity at the cone-horizontal cell synapse. J. Physiol. 2017;595:5495–5506. doi: 10.1113/JP274177. - DOI - PMC - PubMed
    1. Thoreson W.B., Mangel S.C. Lateral interactions in the outer retina. Prog. Retin. Eye Res. 2012;31:407–441. doi: 10.1016/j.preteyeres.2012.04.003. - DOI - PMC - PubMed
    1. Ströh S., Puller C., Swirski S., Hölzel M.-B., van der Linde L.I.S., Segelken J., Schultz K., Block C., Monyer H., Willecke K., et al. Eliminating Glutamatergic Input onto Horizontal Cells Changes the Dynamic Range and Receptive Field Organization of Mouse Retinal Ganglion Cells. J. Neurosci. 2018;38:2015–2028. doi: 10.1523/JNEUROSCI.0141-17.2018. - DOI - PMC - PubMed
    1. Drinnenberg A., Franke F., Morikawa R.K., Jüttner J., Hillier D., Hantz P., Hierlemann A., Azeredo da Silveira R., Roska B. How Diverse Retinal Functions Arise from Feedback at the First Visual Synapse. Neuron. 2018;99:117–134.e11. doi: 10.1016/j.neuron.2018.06.001. - DOI - PMC - PubMed

MeSH terms

LinkOut - more resources