. 2024 Oct 1;36(10):2341-2354.e6.
doi: 10.1016/j.cmet.2024.08.012. Epub 2024 Sep 23.

IL-22 resolves MASLD via enterocyte STAT3 restoration of diet-perturbed intestinal homeostasis

Affiliations

IL-22 resolves MASLD via enterocyte STAT3 restoration of diet-perturbed intestinal homeostasis

Peng Zhang et al. Cell Metab. .

Abstract

The exponential rise in metabolic dysfunction-associated steatotic liver disease (MASLD) parallels the ever-increasing consumption of energy-dense diets, underscoring the need for effective MASLD-resolving drugs. MASLD pathogenesis is linked to obesity, diabetes, "gut-liver axis" alterations, and defective interleukin-22 (IL-22) signaling. Although barrier-protective IL-22 blunts diet-induced metabolic alterations, inhibits lipid intake, and reverses microbial dysbiosis, obesogenic diets rapidly suppress its production by small intestine-localized innate lymphocytes. This results in STAT3 inhibition in intestinal epithelial cells (IECs) and expansion of the absorptive enterocyte compartment. These MASLD-sustaining aberrations were reversed by administration of recombinant IL-22, which resolved hepatosteatosis, inflammation, fibrosis, and insulin resistance. Exogenous IL-22 exerted its therapeutic effects through its IEC receptor, rather than hepatocytes, activating STAT3 and inhibiting WNT-β-catenin signaling to shrink the absorptive enterocyte compartment. By reversing diet-reinforced macronutrient absorption, the main source of liver lipids, IL-22 signaling restoration represents a potentially effective interception of dietary obesity and MASLD.

Keywords: IL-22; MASLD; STAT3; WNT-β-catenin; hepatosteatosis; lipid absorption.


Conflict of interest statement

Declaration of interests M.K. was a founder and stockholder in Elgia Pharmaceuticals and had received research support from Merck and Janssen Pharmaceuticals. P.C.D. consulted for DSM animal health in 2023; is an advisor and holds equity in Cybele, bileOmix, and Sirenas; and is a scientific co-founder and advisor and holds equity in Ometa, Enveda, and Arome, with prior approval by UC San Diego.

Figures
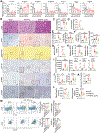
Figure 1.
Figure 1.. Exogenous IL22 resolves diet induced hepatosteatosis and fibrosis
(A) qRT-PCR of the indicated SI mRNAs collected from C57BL/6 mice at the indicated times after initiation of NCD or HFD+30% fructose drink feeding (NCD 2w, n=4; NCD 16w, n=3; HFD 2w, n=4; HFD 4w, n=4; HFD 8w, n=4; HFD 12w, n=6; HFD 16w, n=5). (B-M) C57BL/6 mice were placed on NCD (n=5) or HFD+30% fructose water for 16 weeks and treated with Fc isotype control (n=12) or IL-22Fc (n=12) (10 μg/dose/3d) for the last 4 weeks. (B) Representative H&E, oil red O (ORO) and Sirius Red staining and Col1a1, αSMA and F4/80 IHC of liver sections. Scale bar, 100 μm and 200 μm inset. (C) Body weight (BW). (D) Food intake. (E) Liver weight and liver/body weight ratio. (F) Liver and serum TG. (G) NASH CRN scores. (H) Quantification of ORO staining in (B). (I) Quantification of Col1a1 staining in (B) and relative Col1a1, Col3a1, and Col4a1 mRNA amounts. (J) Serum ALT and AST concentrations. (K) Serum lipopolysaccharide (LPS). (L) Blood insulin and glucose. (M) Gating strategy and percentage of M1 (CD80+) and M2 (CD206+) Kupffer cells (CD45+LINF4/80+CD11bint) and monocyte derived macrophages (CD45+LINF4/80CD11bHi) from NCD (n=4) or HFD fed mice treated with Fc (n=4) or IL-22Fc (n=5). Data are presented as mean ± SEM. *p<0.05, **p<0.01, ****p<0.0001 (unpaired two-tailed t test).
Figure 2.
Figure 2.. IL-22Fc signals in IEC to resolve MASLD
Il22ra1f/f (Fc, n=10; IL-22Fc, n=10), Il22ra1ΔHep (Fc, n=7; IL-22Fc, n=8) and Il22ra1ΔIEC (Fc, n=8; IL-22Fc, n=7) mice were placed on HFD+30% fructose water for 16 weeks and treated with Fc or IL-22Fc as above. (A) BW, liver weight and liver/body weight ratio. (B) Liver TG, serum ALT and AST. (C) Representative H&E, ORO and Col1a1 IHC of liver sections and quantification. Scale bar, 100 μm and 200 μm inset. (D) NASH CRN scores of above mice. Data are presented as mean ± SEM. n.s, not significant, *p<0.05, **p<0.01, ***p<0.001 (unpaired two-tailed t test).
Figure 3.
Figure 3.. IL-22Fc signaling in IEC inhibits macronutrient uptake and metabolism
(A-B) qRT-PCR of indicated mRNAs (A) and immunoblot of indicated proteins (B) in SI of C57BL/6 mice at the indicated times after initiation of NCD or HFD+30% fructose water feeding (NCD 2w, n=4; NCD 16w, n=3; HFD 2w, n=4; HFD 4w, n=4; HFD 8w, n=4; HFD 12w, n=6; HFD 16w, n=5). (C) Relative mRNA amounts of indicated genes in the SI of NCD (n=5), or HFD+fructose drink fed mice treated with Fc (n=7) or rIL-22Fc (n=8), as above. (D) IB analysis of SI proteins in above mice. (E,H) Serum TGs after olive oil gavage of Fc or IL-22Fc treated C57BL/6 mice (E) or Il22ra1ΔIEC mice (H) that were HFD fed for 2 weeks (E, Fc, n=7; IL-22Fc, n=7; H, Fc, n=5; IL-22Fc, n=6). (F) Blood glucose after 20% lactose gavage of Fc or IL-22Fc treated C57BL/6 mice (Fc, n=5; IL-22Fc, n=8). (G) qRT-PCR of indicated genes in SI of HFD+30% fructose fed Il22ra1f/f and Il22ra1ΔIEC mice treated with Fc or IL-22Fc as above. Data are presented as mean ± SEM. n.s, not significant, *p<0.05, **p<0.01, ***p<0.001 (unpaired two-tailed t test).
Figure 4.
Figure 4.. IL-22Fc resolves MASLD in microbiota-depleted mice
(A-C) The fecal microbiome of the indicated mice (Il22ra1f/f (Fc, n=10; IL-22Fc, n=10), Il22ra1ΔHep (Fc, n=7; IL-22Fc, n=8), Il22ra1ΔIEC (Fc, n=8; IL-22Fc, n=7) and C57BL/6+Abx (Fc, n=6; IL-22Fc, n=6) that were HFD+fructose fed and treated with Fc or IL-22Fc as above was investigated by 16s sequencing. (A) Chao richness. (B) Shannon diversity. (C) Simpson diversity. (D-N) C57BL/6 mice were fed HFD+fructose for 16 weeks and treated with an antibiotics cocktail for the last 5 weeks followed by Fc (n=6) or IL-22Fc (n=6) treatments as above. (D) Food intake. (E) Liver weight and liver/body weight ratio. (F) eWAT weight. (G) Spleen weight. (H) Colon length. (I, J) Serum ALT (I), TG and cholesterol (J). (K) NASH CRN scores. (L) Representative H&E, ORO and Col1a1 IHC of liver sections and their quantification. Scale bar, 100 μm. (M) IB analysis of indicated SI proteins. (N) TG in feces from the indicated mice. Data are presented as mean ± SEM. *p<0.05, **p<0.01, ***p<0.001, ****p<0.0001 (unpaired two-tailed t test).
Figure 5.
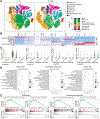
Figure 5.. IL-22Fc restores diet-perturbed IEC homeostasis, reducing mature absorptive enterocytes and increasing enterocyte progenitors
The SI of C57BL/6 mice fed HFD+fructose and treated with Fc or IL-22Fc as above was isolated and single cell suspensions of crypt epithelial cells were subjected to RNA sequencing. (A) t-SNE plots depicting color-coded clustering of 17,213 and 14,660 single epithelial cells from Fc and rIL-22Fc treated mice, respectively (n=2 mice per group), based on known marker genes. The bar graphs show frequencies of different epithelial subsets. (B) Heatmap of top 25 genes for each cell cluster. (C) Expression of individual mRNAs in the indicated cell clusters. (D) Top 20 downregulated Gene Ontology terms (Biological Process) for the Fc and IL-22Fc treated cell clusters. (E) Gene set enrichment analysis (GSEA) focusing on hallmark fatty acid metabolism (left panels) and transporter (right panels) genes in the Fc and IL-22Fc treated cell clusters.
Figure 6.
Figure 6.. IL-22Fc inhibits Wnt-β catenin signaling
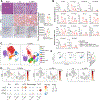
(A, B) IB (A) and qRT-PCR (B) analyses of indicated SI proteins and mRNAs from C57BL/6 mice kept on NCD (n=7) or HFD+30% fructose drink (n=11) for 16 weeks. (C, D) Whole cell and nuclear proteins (C) and mRNA (D) analyses of SI from HFD+fructose fed C57BL/6 mice treated with Fc (n=6) or IL-22Fc (n=6) as above. (E) GSEA analysis of the indicated cell clusters (from Figure 5) focusing on hallmark Wnt pathway. Data are presented as mean ± SEM. *p<0.05, **p<0.01 (unpaired two-tailed t test).
Figure 7.
Figure 7.. The MASLD remedial effects of IL-22Fc require STAT3 expression in IEC
(A,B)Stat3ΔIEC mice were kept on NCD (n=2) or HFD+30% fructose water for 16 weeks and treated with Fc (n=4) or IL-22Fc (n=7) as above. (A) Representative H&E and ORO staining and Col1a1 IHC of liver sections from above mice and quantification. Scale bar, 100 μm. (B) qRT-PCR of the indicated SI mRNAs from above mice. (C,D) SI of C57BL/6 mice fed HFD+fructose and treated with Fc or IL-22Fc were isolated as above and single cell suspensions of lamina propria lymphocytes were subjected to RNA-seq. (C) t-SNE plots depicting color-coded clustering of 12,862 and 12,360 single CD45+ immune cells from Fc and IL-22Fc treated mice, respectively (n=2 mice per group), based on known marker genes. (D) Heatmaps and dot plots of Il22, Il17a and Il23a mRNA amounts in the designated immune cell populations revealed by scRNA-seq. (E) Flow cytometric analysis of IL-22 expression in ILC3 (CD45+LINCD3TCRTCRgRORgt+) from the SI of NCD (n=4), HFD+Fc (n=4) or HFD+IL-22Fc (n=4) treated C57BL/6 mice. Data are presented as mean ± SEM. n.s, not significant, *p<0.05 (unpaired two-tailed t test).

References

    1. Younossi ZM, Koenig AB, Abdelatif D, Fazel Y, Henry L, and Wymer M (2016). Global epidemiology of nonalcoholic fatty liver disease-Meta-analytic assessment of prevalence, incidence, and outcomes. Hepatology 64, 73–84. 10.1002/hep.28431. - DOI - PubMed
    1. Dufour JF, Anstee QM, Bugianesi E, Harrison S, Loomba R, Paradis V, Tilg H, Wong VW, and Zelber-Sagi S (2022). Current therapies and new developments in NASH. Gut 71, 2123–2134. 10.1136/gutjnl-2021-326874. - DOI - PMC - PubMed
    1. Tilg H, and Moschen AR (2010). Evolution of inflammation in nonalcoholic fatty liver disease: the multiple parallel hits hypothesis. Hepatology 52, 1836–1846. 10.1002/hep.24001. - DOI - PubMed
    1. Kodali A, Okoye C, Klein D, Mohamoud I, Olanisa OO, Parab P, Chaudhary P, Mukhtar S, Moradi A, and Hamid P (2023). Crohn’s Disease is a Greater Risk Factor for Nonalcoholic Fatty Liver Disease Compared to Ulcerative Colitis: A Systematic Review. Cureus. 10.7759/cureus.42995. - DOI - PMC - PubMed
    1. Kirpich IA, Marsano LS, and McClain CJ (2015). Gut-liver axis, nutrition, and non-alcoholic fatty liver disease. Clin Biochem 48, 923–930. 10.1016/j.clinbiochem.2015.06.023. - DOI - PMC - PubMed