Comparative Study
. 2024 Oct 9;4(10):100656.
doi: 10.1016/j.xgen.2024.100656. Epub 2024 Sep 23.

Comparative modeling reveals the molecular determinants of aneuploidy fitness cost in a wild yeast model

Affiliations
Comparative Study

Comparative modeling reveals the molecular determinants of aneuploidy fitness cost in a wild yeast model

Julie Rojas et al. Cell Genom. .

Abstract

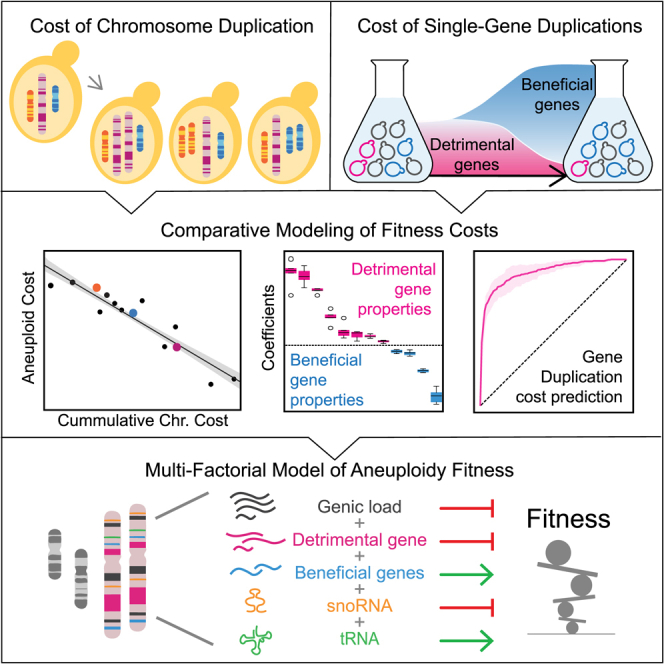
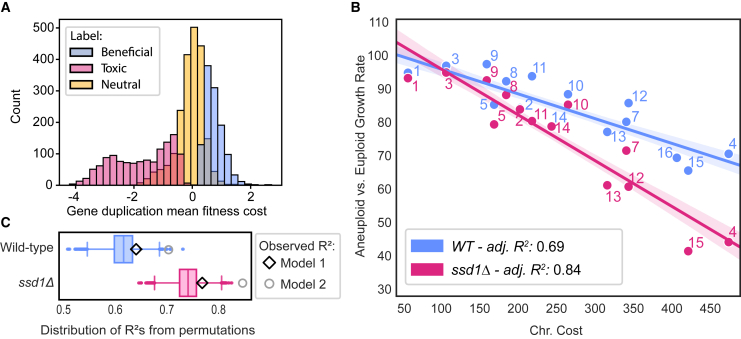
Although implicated as deleterious in many organisms, aneuploidy can underlie rapid phenotypic evolution. However, aneuploidy will be maintained only if the benefit outweighs the cost, which remains incompletely understood. To quantify this cost and the molecular determinants behind it, we generated a panel of chromosome duplications in Saccharomyces cerevisiae and applied comparative modeling and molecular validation to understand aneuploidy toxicity. We show that 74%-94% of the variance in aneuploid strains' growth rates is explained by the cumulative cost of genes on each chromosome, measured for single-gene duplications using a genomic library, along with the deleterious contribution of small nucleolar RNAs (snoRNAs) and beneficial effects of tRNAs. Machine learning to identify properties of detrimental gene duplicates provided no support for the balance hypothesis of aneuploidy toxicity and instead identified gene length as the best predictor of toxicity. Our results present a generalized framework for the cost of aneuploidy with implications for disease biology and evolution.

Keywords: CNV; aneuploidy; balance hypothesis; dosage-sensitive genes; driver genes; genic load; snoRNA; tRNA.


Conflict of interest statement

Declaration of interests The authors have no competing interests to declare.

Figures

None
Graphical abstract
Figure 1
Figure 1
Chromosome duplications inflict variable fitness costs in wild-type and ssd1Δ cells (A) Average and standard deviation (n = 4) of aneuploid growth rates relative to isogenic euploid. All SSD1+ (“WT,” blue) aneuploids grew slower than the euploid (p < 0.05, replicate-paired t test); ssd1Δ aneuploids that grew significantly slower than their wild-type aneuploid equivalent are indicated with an asterisk (p < 0.05, t test). (B) Mean relative growth rate of each aneuploid strain (numbered by duplicated chromosome) relative to the isogenic euploid plotted against the number of genes per amplified chromosome. Ordinary least-squares regression with 95% confidence interval (shaded) and adjusted R2 indicated in the box. See also Table S1 and source data for Figures 1, 2, and 3 in S6.
Figure 2
Figure 2
Considering gene-specific fitness costs improves the modeling (A) Distribution of log2 fitness scores for single-gene duplications for gene groups in the key. (B) Linear fit of the mean relative growth rate as in Figure 1 plotted against the sum of the log2 fitness costs for genes encoded on each chromosome (“Chr. Cost”). (C) Distribution of R2 values from 10,000 random permutations of gene fitness scores affiliated with each chromosome (whiskers – 1.5 times the interquartile range). The observed adjusted-R2 values for model 1 and model 2 are shown for each strain panel. See also Tables S1, S2, and S6.
Figure 3
Figure 3
A multi-factorial model best explains the costs of chromosome duplication (A) Distribution of coefficients obtained from 1,000 lasso regression bootstrap iterations (whiskers – 1.5 times the interquartile range). Only features exhibiting non-zero weights in more than 90% of bootstrap resamples are depicted. The likelihood-ratio test’s p values for each selected feature for the wild-type (blue) and ssd1Δ (pink) regression models are displayed. (B) Linear fit of the mean relative growth rates as in Figure 1 against model 3 predictions (using significant features for each strain as shown in A). The adjusted R2 value is indicated in the lower right corner. See also Tables S1, S2, S5, and S6.
Figure 4
Figure 4
Duplication of select snoRNAs and tRNAs contributes to aneuploidy fitness (A) Average and standard deviation of growth rates of strains containing the empty vector (EV) or plasmids encoding either seven C/D box snoRNAs or seven H/ACA snoRNAs as described in the text (∗p < 0.05, replicate-paired t test versus empty vector, n > 6). (B) Average and standard deviation of growth rates of chr13 aneuploids with or without restoration of the seven C/D box snoRNAs’ copy number to euploid levels (∗p < 0.05, replicate-paired t tests, n > 7). (C) Average and standard deviation of relative growth rates of strains harboring chr12 tRNA cassette versus strain with the empty vector (∗p < 0.01, replicate paired t tests, between each aneuploid and the corresponding euploid, n > 3). (D) Average and standard deviation of relative growth rates of each strain in the maf1Δ versus MAF1+ background (∗p < 0.05, replicate-paired t tests between MAF1 and maf1Δ, n > 4). See source data in Table S6.
Figure 5
Figure 5
Gene length is the main predictor of deleterious gene duplications (A) Mean receiver operating characteristic (ROC) curve for 5-fold cross validation of the logistic regression model using the top 12 features (see STAR Methods), applied to 1,177 deleterious and 3,028 neutral gene duplications (all genes) or the restricted set of 613 substantially deleterious genes and 1,472 clearly neutral genes (filtered genes). Dashed, colored lines show the fit when only gene length is considered in the model. The mean area under the curve (AUC) is shown in the key. (B) Error matrix shows the percentage recovery of true labels by the predicted labels of the combined 5-fold cross-validation test sets. (C) Boxplot of the mean feature importance (n = 10) for the 5-fold cross-validation measured with respect to ROC-AUC gain (whiskers – 1.5 times the interquartile range, see STAR Methods). Features associated with or higher in the deleterious gene duplication group are labeled with a “T”, while enrichment in the neutral group is indicated with an “N”. (D) Distribution of gene lengths for the 613 deleterious (“toxic”) and 1,472 neutral gene duplicates (p value, Wilcoxon rank-sum test). See also Tables S2 and S3 as well as corresponding source data in Table S6.
Figure 6
Figure 6
Model predictions applied to 2-μm overexpression dataset (A) As shown in Figure 5 but using the top 70 identified features applied to 400 commonly deleterious genes versus 1,657 commonly neutral genes based on data from Robinson et al. (blue curve). Robinson data fitted only with gene length (dashed line). Gene-duplication data from this study (“duplications,” purple curve) predicted using the 70 feature-model trained on the Robinson data. (B) Error matrix for the Robinson et al. model as described in Figure 5. (C) Boxplot of the mean feature importance (n = 10) for the 5-fold cross-validation, measured with respect to ROC-AUC gain (whiskers – 1.5 times the interquartile range, see STAR Methods) for Robinson’s model with the top 25 features, as shown in Figure 5. See the source data in Table S6. A complete report of the permutation feature importance for all 70 features of the model is available for this figure in Table S6.

Update of

References

    1. Hassold T., Hunt P. To err (meiotically) is human: the genesis of human aneuploidy. Nat. Rev. Genet. 2001;2:280–291. doi: 10.1038/35066065. - DOI - PubMed
    1. Torres E.M., Williams B.R., Amon A. Aneuploidy: Cells Losing Their Balance. Genetics. 2008;179:737–746. doi: 10.1534/genetics.108.090878. - DOI - PMC - PubMed
    1. Zhu J., Tsai H.-J., Gordon M.R., Li R. Cellular Stress Associated with Aneuploidy. Dev. Cell. 2018;44:420–431. doi: 10.1016/j.devcel.2018.02.002. - DOI - PMC - PubMed
    1. Selmecki A., Forche A., Berman J. Aneuploidy and Isochromosome Formation in Drug-Resistant Candida albicans. Science. 2006;313:367–370. doi: 10.1126/science.1128242. - DOI - PMC - PubMed
    1. Vande Zande P., Zhou X., Selmecki A. The Dynamic Fungal Genome: Polyploidy, Aneuploidy and Copy Number Variation in Response to Stress. Annu. Rev. Microbiol. 2023;77:341–361. doi: 10.1146/annurev-micro-041320-112443. - DOI - PMC - PubMed

Publication types