. 2024 Oct 9;11(10):ENEURO.0234-24.2024.
doi: 10.1523/ENEURO.0234-24.2024. Print 2024 Oct.

A Novel Mouse Home Cage Lickometer System Reveals Sex- and Housing-Based Influences on Alcohol Drinking

Affiliations

A Novel Mouse Home Cage Lickometer System Reveals Sex- and Housing-Based Influences on Alcohol Drinking

Nicholas Petersen et al. eNeuro. .

Abstract

Alcohol use disorder (AUD) is a significant global health issue. Despite historically higher rates among men, AUD prevalence and negative alcohol-related outcomes in women are rising. Loneliness in humans has been associated with increased alcohol use, and traditional rodent drinking models involve single housing, presenting challenges for studying social enrichment. We developed LIQ PARTI (Lick Instance Quantifier with Poly-Animal RFID Tracking Integration), an open-source tool to examine home cage continuous access two-bottle choice drinking behavior in a group-housed setting, investigating the influence of sex and social isolation on ethanol consumption and bout microstructure in C57Bl/6J mice. LIQ PARTI, based on our previously developed single-housed LIQ HD system, accurately tracks drinking behavior using capacitive-based sensors and RFID technology. Group-housed female mice exhibited higher ethanol preference than males, while males displayed a unique undulating pattern of ethanol preference linked to cage changes, suggesting a potential stress or novelty-related response. Chronic ethanol intake distinctly altered bout microstructure between male and female mice, highlighting sex and social environmental influences on drinking behavior. Social isolation with the LIQ HD system amplified fluid intake and ethanol preference in both sexes, accompanied by sex- and fluid-dependent changes in bout microstructure. However, these effects largely reversed upon resocialization, indicating the plasticity of these behaviors in response to social context. Utilizing a novel group-housed home cage lickometer device, our findings illustrate the critical interplay of sex and housing conditions in voluntary alcohol drinking behaviors in C57Bl/6J mice, facilitating nuanced insights into the potential contributions to AUD etiology.

Keywords: alcohol; microstructure; open-source; sex differences; social drinking; social isolation.


Conflict of interest statement

The authors declare no competing financial interests.

Figures
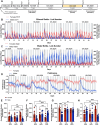
Figure 1.
Figure 1.
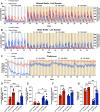
Female mice form a significantly higher preference for ethanol compared with males in a group-housed continuous access two-bottle choice task, and males display an undulating pattern of ethanol preference that aligns with cage-changing days. A, Timeline of experimental setup. Ten male and 10 female mice across four cages were implanted with RFID tags under the scruff of the neck and given 7 d to recover and habituate with the LIQ PARTI devices. Mice were then exposed to a continuous two-bottle choice paradigm with water only for 1 week, 3% ethanol and water for 3 d, 7% ethanol and water for 1 week, and 10% ethanol and water for 4 weeks. Mice were then socially isolated with the LIQ HD system for 3 weeks and then returned to group housing with LIQ PARTI for 16 d. Lick number per hour and estimated volume consumed from male and female mice at the ethanol bottle (B) and water bottle (C) throughout ethanol exposure with LIQ PARTI prior to social isolation. D, Ethanol preference score calculated by lick number in male and female mice throughout ethanol exposure with LIQ PARTI prior to social isolation. E, Male and female mice had a similar number of average daily licks at the ethanol bottle during exposure to 3 and 7% ethanol, and female mice compared with males had a significantly higher number of licks at the ethanol bottle during exposure to 10% ethanol (repeated-measures two-way ANOVA, with the Geisser–Greenhouse correction and Tukey's multiple-comparisons test; significant main effect of sex p < 0.01 and significant interaction effect of sex × time p < 0.0001). F, Female mice compared with males had significantly more licks at the water bottle during exposure to 3% ethanol, and male mice had significantly more licks at the water bottle during exposure to 10% ethanol compared with females (repeated measures two-way ANOVA, with the Geisser–Greenhouse correction and Tukey's multiple-comparisons test; significant main effect of time p < 0.05 and significant interaction effect of sex × time p < 0.0001). G, Male and female mice show similar levels of average total lick number per day (both bottles) throughout ethanol exposure, except for during 3% ethanol and water where males displayed significantly fewer licks than females (repeated-measures two-way ANOVA, with the Geisser–Greenhouse correction and Tukey's multiple-comparisons test; significant main effect of sex p < 0.01 and time p < 0.01, significant interaction effect of sex × time p < 0.0001). H, Male mice have a significantly higher preference for ethanol during exposure to 3% ethanol and water, but they significantly reduce their preference through exposure to 10% ethanol (repeated-measures two-way ANOVA, with the Geisser–Greenhouse correction and Tukey's multiple-comparisons test; significant interaction effect of sex × time p < 0.0001). Female mice have a significantly higher preference for ethanol than males during exposure to 10% ethanol with LIQ PARTI prior to social isolation. The solid lines (B–D) represent the mean lick number and estimated volume consumed in 1 h bins, and the red/blue shaded areas represent ±SEM. Gray-shaded areas represent the dark cycle and vertical dotted lines represent when cages were cleaned, when bottles were weighed, and when bottle positions were swapped. Error bars (E–H) represent ±SEM (n = 10 mice per group and reported as individual mice). *p < 0.05, **p < 0.01, ****p < 0.0001. See Extended Data Figure 1-1 for the LIQ PARTI wiring diagram and schematic, Extended Data Figure 1-1 for the LIQ PARTI Arduino source code, Extended Data Figure 1-2 for a representative annotated validation video, Extended Data Figure 1-2 for the LIQ PARTI video validation and correlation data, Extended Data Figure 1-3 for the water week lick data, Extended Data Figure 1-4 for the water week individual bout data, and Extended Data Figure 1-5 for the estimated hourly and daily ethanol intake (g/kg).
Figure 2.
Figure 2.
Exposure to ethanol significantly alters drinking microstructure in a sex- and bottle-specific manner in group-housed mice. Average daily bout number (A), bout size (B), bout duration (C), lick duration (D), lick frequency (E), and ILI (F) at the water and ethanol bottles for males and females during the water week (both bottles with water) and during the fourth week of 10% ethanol exposure (repeated-measures three-way ANOVA, with the Geisser–Greenhouse correction and Šidák multiple-comparisons test). G, Three-way ANOVA results for the microstructure parameters showing the main effects of sex, ethanol exposure, fluid, and interactions. Error bars represent ±SEM (n = 10 mice per group and reported as individual mice). *p < 0.05, **p < 0.01, ***p < 0.001, ****p < 0.0001. See Extended Data Figure 2-1 for the individual bout data during the fourth week of 10% ethanol exposure.
Figure 3.
Figure 3.
Social isolation in the LIQ HD system significantly increases ethanol preference and total consumption in male and female mice and changes the overall ethanol preference pattern over time in males. Lick number per hour and estimated volume consumed from male and female mice at the ethanol bottle (A) and water bottle (B) throughout the last week of 10% ethanol exposure with the group-housed (GH) LIQ PARTI system and through social isolation (SI) with LIQ HD with 10% ethanol and water. C, Ethanol preference score calculated by lick number in male and female mice throughout the last week of 10% ethanol exposure with the group-housed LIQ PARTI system and through social isolation with LIQ HD with 10% ethanol and water. D, Both male and female mice significantly increased their average daily lick number at the ethanol bottle during social isolation compared with grouped housing, and female mice had significantly higher licks at the ethanol bottle compared with males during social isolation and grouped housing (repeated-measures two-way ANOVA, Šidák multiple-comparisons test; significant main effect of sex p < 0.0001 and housing p < 0.0001). E, Males, but not females, significantly decreased their average daily number at the water bottle during social isolation compared with grouped housing, and males had significantly higher licks at the water bottle compared with females during social isolation and grouped housing (repeated-measures two-way ANOVA, Šidák multiple-comparisons test; significant main effect of sex p < 0.0001 and housing p < 0.0001). F, Both male and female mice display an increase in the average total lick number per day (both bottles) during social isolation with no significant difference between male and female mice (repeated-measures two-way ANOVA, Šidák multiple-comparisons test; significant main effect of housing p < 0.0001, significant interaction effect of sex × housing p < 0.05). G, Both male and female mice have an increased preference for ethanol during social isolation and female mice have a higher ethanol preference than males during group housing with LIQ PARTI and social isolation with LIQ HD (repeated-measures two-way ANOVA, Šidák multiple-comparisons test; significant main effect of sex p < 0.0001 and housing p < 0.0001, significant interaction effect of sex × housing p < 0.0001). The solid lines (A–C) represent the mean lick number in 1 h bins, and the red/blue shaded areas represent ±SEM. Gray-shaded areas represent the dark cycle and vertical dotted lines represent when cages were cleaned, when bottles were weighed, and when bottle positions were swapped. Yellow-shaded regions indicate periods of social isolation with LIQ HD. Error bars (D–G) represent ±SEM (n = 10 mice per group and reported as individual mice). **p < 0.01, ***p < 0.001, ****p < 0.0001.
Figure 4.
Figure 4.
Social isolation significantly alters drinking microstructure in a sex- and bottle-specific manner. Average daily bout number (A), bout size (B), bout duration (C), lick duration (D), lick frequency (E), and ILI (F) at the water and ethanol bottles for males and females during the fourth week of group-housed 10% ethanol exposure and during social isolation with 10% ethanol (averaged across the 3 weeks; repeated-measures three-way ANOVA, with the Geisser–Greenhouse correction and Šidák multiple-comparisons test). G, Three-way ANOVA results for the microstructure parameters showing the main effects of sex, housing, fluid, and interactions. Error bars represent ±SEM (n = 10 mice per group and reported as individual mice). *p < 0.05, **p < 0.01, ***p < 0.001, ****p < 0.0001.
Figure 5.
Figure 5.
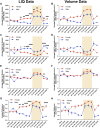
Summary of LIQ and volume measurement data throughout the two-bottle choice drinking paradigm. A, Average daily lick number at the ethanol bottle with a significant main effect of time (p < 0.0001) and sex (p < 0.0001) and a significant interaction effect (time × sex, p < 0.0001). B, Average daily consumption at the ethanol bottle with a significant main effect of time (p < 0.01) and sex (p < 0.05) and a significant interaction effect (time × sex, p < 0.01). C, Average daily lick number at the water bottle with a significant main effect of time (p < 0.0001) and sex (p < 0.001) and a significant interaction effect (time × sex, p < 0.0001). D, Average daily consumption at the water bottle with a significant main effect of sex (p < 0.05) and a significant interaction effect (time × sex, p < 0.01). E, Average daily lick number at both bottles combined with a significant main effect of time (p < 0.0001) and a significant interaction effect (time × sex, p < 0.0001). F, Average daily consumption at both bottles combined with a significant main effect of time (p < 0.01) and sex (p < 0.01). G, Average preference by lick number with a significant main effect of time (p < 0.0001) and sex (p < 0.0001) and a significant interaction effect (time × sex, p < 0.0001). H, Average preference by average volume consumed with a significant main effect of time (p < 0.05) and sex (p < 0.05) and a significant interaction effect (time × sex, p < 0.01). Volume measurement data was calculated as the average across all animals per cage (LIQ data: repeated-measures mixed-effects model, with the Geisser–Greenhouse correction and Šidák multiple-comparisons test for female versus male at each time point. Volume data: repeated-measures two-way ANOVA, with the Geisser–Greenhouse correction and Šidák multiple-comparisons test for female vs male at each time point). Yellow-shaded regions indicate periods of social isolation with LIQ HD. Error bars represent ±SEM (LIQ data n = 10 mice per group, except males post-SI week 2 n = 5, and are reported as individual mouse values; volume data n = 2 cages per group and are reported as whole-cage values). *p < 0.05, **p < 0.01, ***p < 0.001, ****p < 0.0001.
Figure 6.
Figure 6.
The average lick number per day modestly decreases in females and returns to baseline in males, and ethanol preference returns to baseline in both males and females during the return to a group-housed setting postisolation compared with the last previous group-housed week. Lick number per hour and estimated volume consumed from male and female mice at the ethanol bottle (A) and water bottle (B) throughout the last week of 10% ethanol exposure with the group-housed LIQ PARTI system and through postsocial isolation with 10% ethanol and water. C, Ethanol preference score calculated by lick number in male and female mice throughout the last week of 10% ethanol exposure with the group-housed LIQ PARTI system and through postsocial isolation with 10% ethanol and water. Male mice resume the previously observed pattern of undulating ethanol preference that corresponds with cage-changing days. D, Female mice, but not males, significantly decreased their average daily lick number at the ethanol bottle during the first week of postsocial isolation compared with presocial isolation but returned to presocial isolation levels by Week 2. Female mice had significantly more licks at the water bottle compared with males during all three time periods (repeated-measures mixed-effects model, Tukey's multiple-comparisons test; significant main effect of sex p < 0.0001 and housing p < 0.0001, significant interaction effect of sex × housing p < 0.01). E, Both male and female mice significantly increased their daily average lick number at the water bottle during the first postsocial isolation week compared with presocial isolation but returned to presocial isolation levels by Week 2. Males have significantly more licks at the water bottle during all three time periods compared with females (repeated-measures mixed-effects model, Tukey's multiple-comparisons test; significant main effect of sex p < 0.0001 and housing p < 0.0001). F, Female mice show no significant difference in the average total licks per day (both bottles) during the first postsocial isolation recording session, but modestly decrease during the second session. Male mice display a significantly greater average total lick number per day during with first recording session postsocial isolation with no significant difference during the second session compared with the last week of presocial isolation 10% ethanol (repeated-measures mixed-effects model, Tukey's multiple-comparisons test; significant main effect of sex p < 0.05 and housing p < 0.0001, significant interaction effect of sex × housing p < 0.001). G, Female mice have a significantly lower ethanol preference during the first week of postsocial isolation compared with the last week of presocial isolation with 10% ethanol. Ethanol preference returns to presocial isolation levels in females during the second postsocial isolation recording session. Male mice immediately return to presocial isolation ethanol preference post-social (repeated-measures mixed-effects model, Tukey's multiple-comparisons test; significant main effect of sex p < 0.0001 and housing p < 0.001, significant interaction effect sex × housing p < 0.01). The solid lines (A–C) represent the mean lick number in 1 h bins, and the red/blue shaded areas represent ±SEM. Gray-shaded areas represent the dark cycle and vertical dotted lines represent when cages were cleaned, when bottles were weighed, and when bottle positions were swapped. Error bars (D–G) represent ±SEM (n = 10 mice per group, except males post-SI week 2 n = 5, and reported as individual mice). *p < 0.05, **p < 0.01, ***p < 0.001, ****p < 0.0001.
Figure 7.
Figure 7.
Social reintegration significantly alters drinking microstructure in a sex- and bottle-specific manner, which largely reverts to presocial isolation values. Average daily bout number (A), average bout size (B), bout duration (C), lick duration (D), lick frequency (E), and ILI (F) at the water and ethanol bottles for males and females during fourth week of group-housed 10% ethanol exposure (pre-SI) and during postsocial isolation with 10% ethanol (post-SI, averaged across the 2 recording periods; repeated-measures three-way ANOVA, with the Geisser–Greenhouse correction and Šidák multiple-comparisons test). G, Three-way ANOVA results for the microstructure parameters showing the main effects of sex, housing, fluid, and interactions. Error bars represent ±SEM (n = 10 mice per group and reported as individual mice). *p < 0.05, **p < 0.01, ***p < 0.001, ****p < 0.0001. See Extended Data Figure 7-1 for the average daily microstructure over the course of the experiment.

Update of

Similar articles

Cited by

References

    1. Acuff SF, Strickland JC, Tucker JA, Murphy JG (2022) Changes in alcohol use during COVID-19 and associations with contextual and individual difference variables: a systematic review and meta-analysis. Psychol Addict Behav 36:1–19. 10.1037/adb0000796 - DOI - PMC - PubMed
    1. Åkerlind I, Hörnquist JO (1992) Loneliness and alcohol abuse: a review of evidences of an interplay. Soc Sci Med 34:405–414. 10.1016/0277-9536(92)90300-F - DOI - PubMed
    1. Anderson RI, Lopez MF, Becker HC (2016) Forced swim stress increases ethanol consumption in C57BL/6J mice with a history of chronic intermittent ethanol exposure. Psychopharmacology 233:2035–2043. 10.1007/s00213-016-4257-2 - DOI - PMC - PubMed
    1. Augustine V, Gokce SK, Lee S, Wang B, Davidson TJ, Reimann F, Gribble F, Deisseroth K, Lois C, Oka Y (2018) Hierarchical neural architecture underlying thirst regulation. Nature 555:204–209. 10.1038/nature25488 - DOI - PMC - PubMed
    1. Bade R, Simpson BS, Ghetia M, Nguyen L, White JM, Gerber C (2021) Changes in alcohol consumption associated with social distancing and self-isolation policies triggered by COVID-19 in South Australia: a wastewater analysis study. Addiction 116:1600–1605. 10.1111/add.15256 - DOI - PMC - PubMed

LinkOut - more resources