. 2024 Oct 9;11(10):ENEURO.0222-24.2024.
doi: 10.1523/ENEURO.0222-24.2024. Print 2024 Oct.

Signal Detection Theoretic Estimates of the Murine Absolute Visual Threshold Are Independent of Decision Bias

Affiliations

Signal Detection Theoretic Estimates of the Murine Absolute Visual Threshold Are Independent of Decision Bias

Sam LaMagna et al. eNeuro. .

Abstract

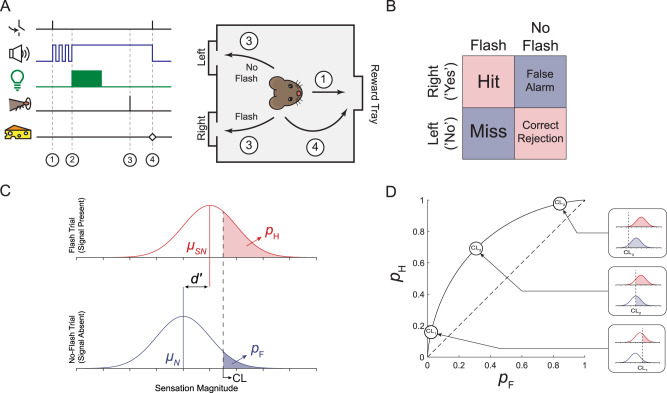
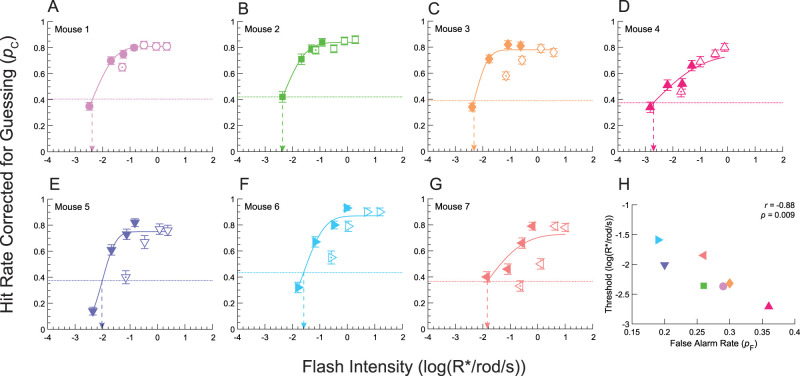
Decision bias influences estimates of the absolute visual threshold. However, most psychophysical estimates of the murine absolute visual threshold have not taken bias into account. Here we developed a one-alternative forced choice (1AFC) assay to assess the decision bias of mice at the absolute visual threshold via the theory of signal detection and compared our approach with the more conventional high-threshold theoretic approach. In the 1AFC assay, mice of both sexes were trained to signal whether they detected a flash stimulus. We directly measured both hit and false alarm rates, which were used to estimate d' Using the theory of signal detection, we obtained absolute thresholds by interpolating the intensity where d' = 1 from d'-psychometric functions. This gave bias-independent estimates of the absolute visual threshold which ranged over sixfold, averaging ∼1 R* in 1,000 rods (n = 7 mice). To obtain high-threshold theoretic estimates of the absolute visual threshold from the same mice, we estimated threshold intensities from the frequency of seeing curves, corrected for guessing. This gave us thresholds that were strongly correlated with decision bias, ranging over 13-fold and averaged ∼1 R* in 2,500 rods. We conclude that the theory of signal detection uses false alarms to overcome decision bias and narrow the range of threshold estimates in mice, providing a powerful tool for understanding detection behavior near absolute visual threshold.

Keywords: absolute visual thresholds; mouse vision; operant behavior; response bias; theory of signal detection; visual noise.


Conflict of interest statement

The authors declare no competing financial interests.

Figures

Figure 1.
Figure 1.
A one-alternative forced choice (1AFC) task for measuring sensitivity to flash stimuli. A, Schematic of the 1AFC task. (1) Mice self-initiate trials by visiting the reward tray, which commences an auditory “countdown” cue. (2) At the end of the cue, a solid tone begins. During stimulus trials, this is coincident with the presentation of a flash stimulus. During catch trials, there is no flash stimulus given. (3) For stimulus trials, mice are trained to visit the right nose-poke. For no-flash trials, mice are trained to visit the left nose-poke. (4) Mice return to the reward tray; mice receive a reward only if they visit the correct nose-poke. B, Decision matrix. For stimulus trials, correctly visiting the right nose-poke (RNP) is termed a hit; incorrectly visiting the left nose-poke is termed a miss. For no-flash trials, correctly visiting the LNP is termed a correct rejection (CR); incorrectly visiting the RNP is termed a false alarm (FA). C, Definition of d′. According to the theory of signal detection, we can think of all perceptual judgments as discriminating signal from noise. In the absence of stimulus, basal neural activity will elicit sensations of a certain magnitude; we can describe the resultant sensation magnitudes by a probability distribution with mean μN. By sensation magnitude, we mean the intensity of the sensation on a psychological scale. When given a stimulus, there will be an increase in neural activity that will shift this distribution to a new mean μSN. This distance, which is the difference between means, is the d′. Since the distributions overlap, an observer in a detection task is liable to confuse sensations coming from basal neural noise as a true signal. Thus, the observer establishes an internal criterion location (CL), above which an observer will categorize as a signal and below which an observer will categorize as the absence of a signal. The pH and pF, then, are simply the integral of the probability distribution from the criterion to +∞. D, The isosensitivity curve. The placement of the observer's criterion is dynamic and reliant on the payoffs, punishments, and a priori probabilities of signal presentation during a detection task. Since the pH and pF are reliant on the criterion, they will both change as an observer shifts their criterion. At CL1, the observer is behaving very conservatively; they are biased toward saying “no” more often. At CL3, the observer is behaving very liberally; they are biased toward saying “yes” more often. At CL2, the observer is behaving in an unbiased manner. No matter the bias of the observer, however, the pH–pF pairs all fall along the same isosensitivity curve. This isosensitivity curve reflects the d′, which remains constant as bias changes.
Figure 2.
Figure 2.
Conditioning and training progression. A, An outline of the conditioning and training regimen used to teach and stabilize mouse performance, respectively (see Materials and Methods). B, Progression of training for Phase 4. Fraction correct of training Phase 4 plotted as a function of training day number. Data are shown for each individual mouse, denoted by color code. The dotted reference line is 0.7, the fraction correct mice must exceed to finish training Phase 4. C, Progression of training for Phase 5. Fraction correct of training Phase 5 plotted as a function of training day number. Each mouse is color-coded as in B. The dotted line is 0.8, the fraction correct mice must exceed for 3 consecutive days to finish training Phase 5.
Figure 3.
Figure 3.
Single-intensity training progression. A, Progression of single-intensity training over time. The sensitivity index (d′) plotted as a function of training day number for 2, 0.26, and 0.06 s, respectively. The filled symbols connected by solid lines indicate the final 4 training days used to determine average d′ and coefficient of variation for stability. Empty symbols connected by the dashed lines indicate training sessions prior to stability. Colors and symbols correspond to the mouse ID's in Figure 2C. B, Average d′ values of the final 4 training days of the corresponding plots in A; error bars are standard deviations. C, Coefficients of variation for the final 4 training days. The dotted line is 20%; to finish single-intensity training for a given duration, CV ≤ 20%.
Figure 4.
Figure 4.
Multi-intensity experiment performance progresses over time. See Materials and Methods for a full description of performance progression. More transparent symbols/lines correspond to performance at later training days in a respective condition. The dotted horizontal lines show threshold performance (d = 1). The dashed vertical lines delineate the intensity condition range. A, Performance over 4 consecutive training days under intensity Condition 1. As time progresses, performance enhances. B, Performance for a single day under intensity Condition 2. Because performance was so high, the mouse moved on to Condition 3. C, Performance for a single day under intensity Condition 3. Again, because performance was so high, the mouse moved on to Condition 4. D, Performance for 2 d under intensity Condition 4. Note that Days 7 and 8 were not shown because the mouse was unable to reliably respond on those days because we made the stimulus condition too dim, too quickly (see Materials and Methods). d′ values increased substantially from Day 9 to Day 10. E, Performance for 6 d under the final Condition 5. Under this condition, the mouse met our stability criteria (see Materials and Methods). F, Demonstration of stable coefficients of variation (CV) under Condition 5. The CV values are obtained from moving averages and standard deviations of d′ for each intensity, with a window of 3 d. Note that once our stability criteria have been met (d′ values have a CV <45%, dashed line), they remain so for the whole 6 d.
Figure 5.
Figure 5.
Signal detection theoretic estimation of absolute visual threshold. A–G, d′-psychometric functions for each mouse. The solid lines are psychometric functions obtained by fitting d′ to Equation 2. The dotted lines show d′ = 1, i.e., the performance level at threshold. Threshold intensities are indicated by arrows. Error bars are d′ standard errors. H, Threshold intensities plotted against false alarm rates (pF). Threshold intensities are not correlated with pF (Pearson's correlation analysis).
Figure 6.
Figure 6.
High-threshold theoretic estimation of absolute visual threshold. A–G, pC-psychometric functions for each mouse. Hit rates corrected for guessing (pC) plotted as a function of log(R*/rod/s). The solid symbols are from the low-intensity condition, and the empty symbols are taken from the high-intensity condition, i.e., asymptotic performance levels. The solid lines are psychometric functions obtained by fitting Equation 4 to solid symbols and Equation 5 to empty symbols. The dotted lines show threshold performance as given by μ in Equation 4. Threshold intensities are indicated by arrows. Error bars are standard errors. H, Threshold intensities plotted against false alarm rates (pF). Threshold intensities are correlated with pF (Pearson's correlation analysis).
Figure 7.
Figure 7.
The theory of signal detection accounts for intersession variability in detection. Hit rate (pH) and false alarm rate (pF) pairs plotted in ROC space from three consecutive experimental sessions under low-intensity (A–C) and high-intensity (D–G) conditions. Each session was conducted on a different day. For each mouse and condition, the session number corresponds to a different symbol color; the color code is common to all mice and conditions. Also plotted are isosensitivity curves implied by the d′ that corresponds to the data pooled from all three sessions. The corresponding d′ values for each plot were as follows: A, d′ = 0.89; B, d′ = 0.58; C, d′ = 1.07; D, d′ = 1.28; E, d′ = 1.38; F, d′ = 1.28; G, d′ = 2.16. Note that only three mice (Mice 1, 5, and 6) completed the high-intensity condition, as we could not obtain reliable data for Mouse 3 under the high-intensity condition.
Figure 8.
Figure 8.
The theory of signal detection accounts for intrasession variability in detection. Representative ROC plots of hit rate (pH) and false alarm rate (pF) pairs taken from single experimental sessions of Mice 1 (A and C) and 5 (B and D). A and B show plots of data obtained under the low-intensity condition, whereas C and D show plots of data obtained under the high-intensity condition. In each plot, each point reflects data taken from trials 0 to 100, 100 to 200, 200 to 300, and 300 to 400. Symbols are color-coded such that the tint becomes darker as the number of trials increases. Also plotted are isosensitivity curves implied by the d′ that corresponds to the pooled data of that session. The corresponding d′ values were as follows: A, d′ = 0.76; B, d′ = 0.47; C, d′ = 1.24; D, d′ = 1.12. Note that each experimental session was conducted on a different day.

Similar articles

References

    1. Ala-Laurila P, Rieke F (2014) Coincidence detection of single-photon responses in the inner retina at the sensitivity limit of vision. Curr Biol 24:2888–2898. 10.1016/j.cub.2014.10.028 - DOI - PMC - PubMed
    1. Barlow HB (1956) Retinal noise and absolute threshold. J Opt Soc Am 46:634–639. 10.1364/JOSA.46.000634 - DOI - PubMed
    1. Barlow HB (1958) Temporal and spatial summation in human vision at different background intensities. J Physiol 141:337–350. 10.1113/jphysiol.1958.sp005978 - DOI - PMC - PubMed
    1. Barlow HB (1977) Retinal and central factors in human vision limited by noise. In: Photoreception in vertebrates (Barlow HB, Fatts P, eds), pp 337–358. London: Academic Press.
    1. Barlow HB, Levick WR, Yoon M (1971) Responses to single quanta of light in retinal ganglion cells of the cat. Vision Res 11:87–101. 10.1016/0042-6989(71)90033-2 - DOI - PubMed

LinkOut - more resources