. 2024 Oct 4;16(10):mfae044.
doi: 10.1093/mtomcs/mfae044.

ATH434, a promising iron-targeting compound for treating iron regulation disorders

Affiliations

ATH434, a promising iron-targeting compound for treating iron regulation disorders

Ashley E Pall et al. Metallomics. .

Abstract

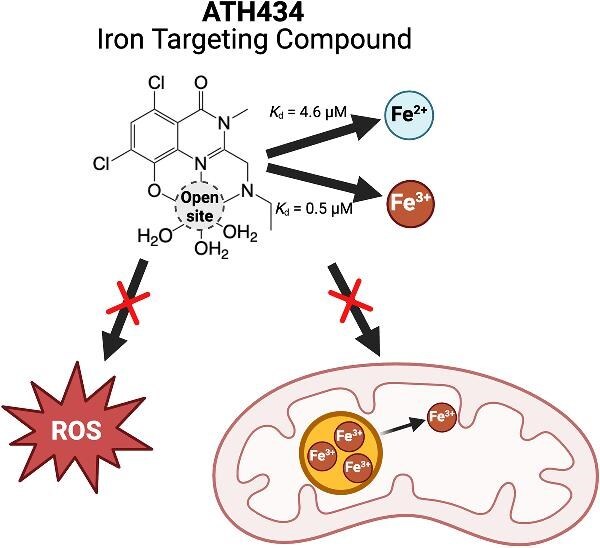
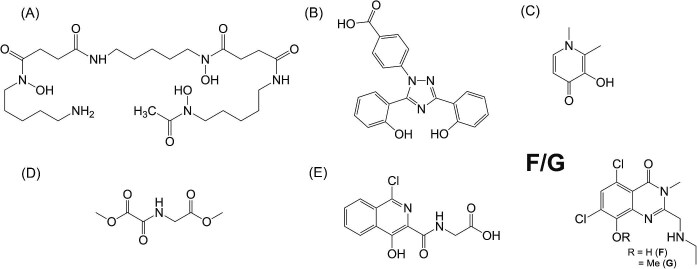
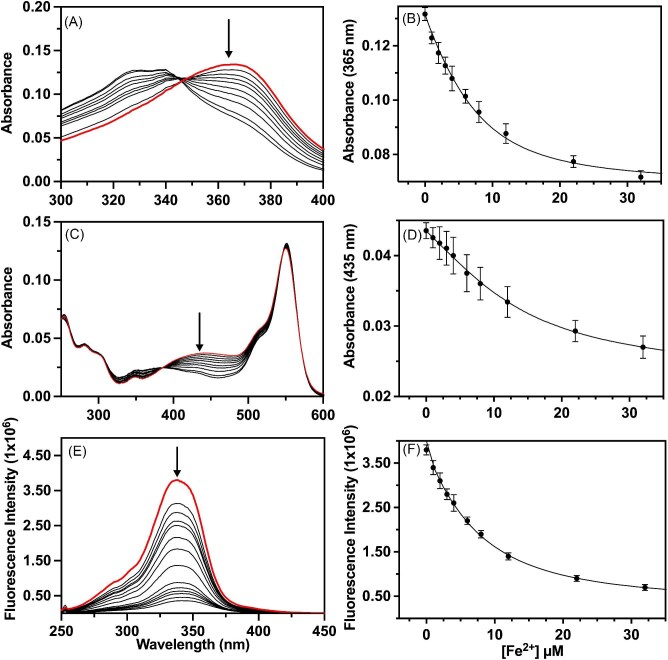
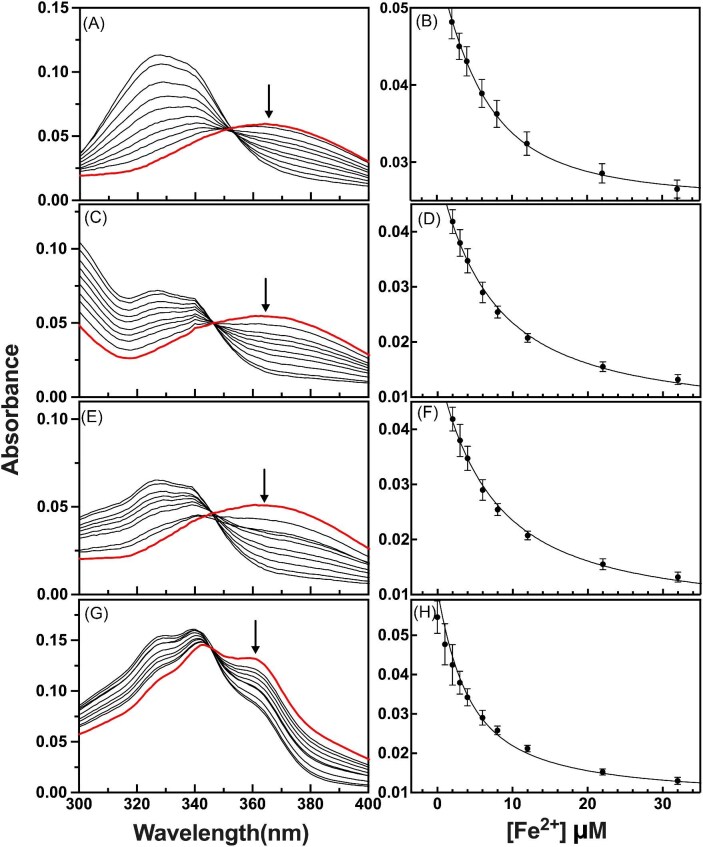
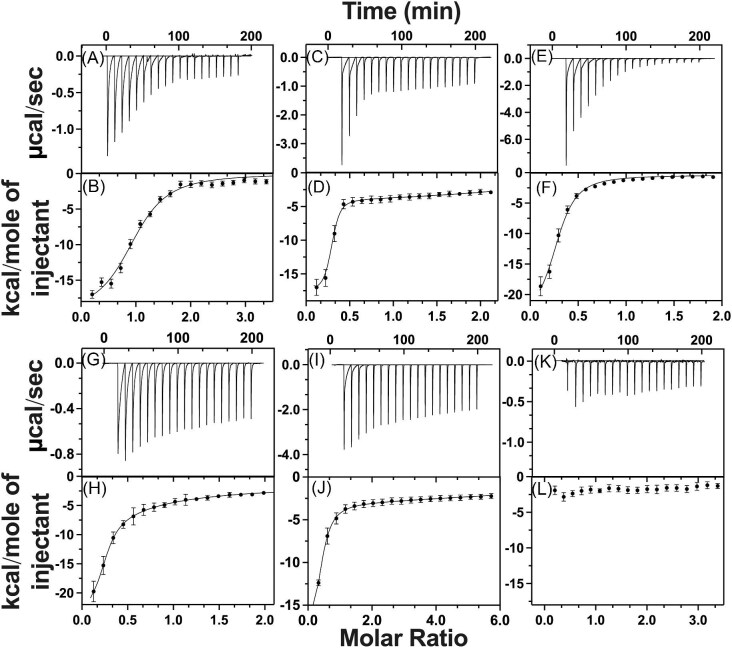
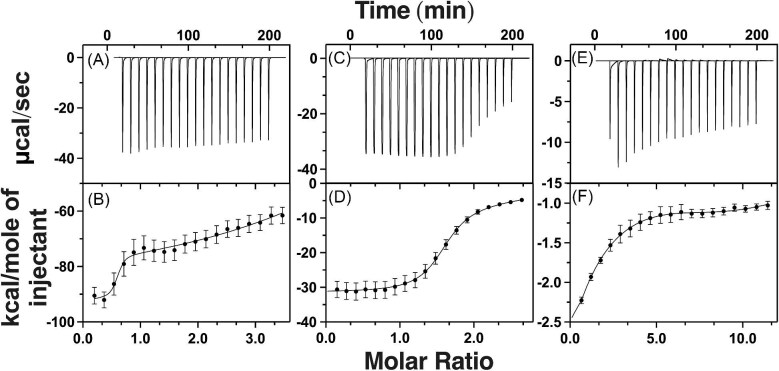
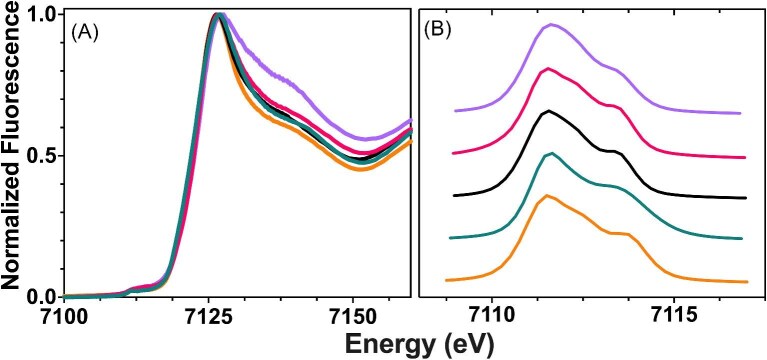
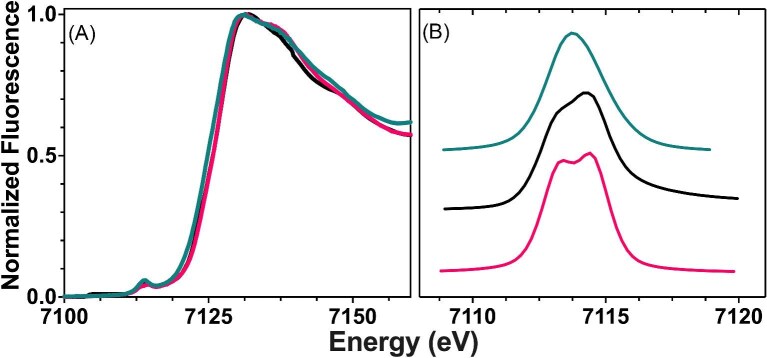
Cytotoxic accumulation of loosely bound mitochondrial Fe2+ is a hallmark of Friedreich's Ataxia (FA), a rare and fatal neuromuscular disorder with limited therapeutic options. There are no clinically approved medications targeting excess Fe2+ associated with FA or the neurological disorders Parkinson's disease and Multiple System Atrophy. Traditional iron-chelating drugs clinically approved for systemic iron overload that target ferritin-stored Fe3+ for urinary excretion demonstrated limited efficacy in FA and exacerbated ataxia. Poor treatment outcomes reflect inadequate binding to excess toxic Fe2+ or exceptionally high affinities (i.e. ≤10-31) for non-pathologic Fe3+ that disrupts intrinsic iron homeostasis. To understand previous treatment failures and identify beneficial factors for Fe2+-targeted therapeutics, we compared traditional Fe3+ chelators deferiprone (DFP) and deferasirox (DFX) with additional iron-binding compounds including ATH434, DMOG, and IOX3. ATH434 and DFX had moderate Fe2+ binding affinities (Kd's of 1-4 µM), similar to endogenous iron chaperones, while the remaining had weaker divalent metal interactions. These compounds had low/moderate affinities for Fe3+(0.46-9.59 µM) relative to DFX and DFP. While all compounds coordinated iron using molecular oxygen and/or nitrogen ligands, thermodynamic analyses suggest ATH434 completes Fe2+ coordination using H2O. ATH434 significantly stabilized bound Fe2+ from ligand-induced autooxidation, reducing reactive oxygen species (ROS) production, whereas DFP and DFX promoted production. The comparable affinity of ATH434 for Fe2+ and Fe3+ position it to sequester excess Fe2+ and facilitate drug-to-protein iron metal exchange, mimicking natural endogenous iron binding proteins, at a reduced risk of autooxidation-induced ROS generation or perturbation of cellular iron stores.

Keywords: ATH434; Iron; Iron-Targeting Compound; Regulation; Treating; Unique.


Figures

Graphical Abstract
Graphical Abstract
Illustration of the putative binding site of ATH434 and mechanism of iron targeting. ATH434 has affinities similar to endogenous iron binding chaperones, capable of removing excess Fe2+ without stripping ferritin bound Fe3+.
Fig. 1
Fig. 1
Structures of iron binding compounds. Traditional iron chelators: (A) Deferoxamine (DFO), (B) deferasirox (DFX), and (C) deferiprone (DFP). Iron coordinating compounds: (D) dimethyloxalylglycine (DMOG) and (E) N-[(1-chloro-4-hydroxy-3-isoquinolinyl)carbonyl]-glycine (IOX3). Novel iron targeting molecules: (F) ATH434, and its 8-methoxy derivative (G) ATH434-OMe.
Fig. 2
Fig. 2
Anaerobic Fe2+ competition binding assay for ATH434. Representative titration absorption spectra with corresponding binding profiles of Rhod-5 N (A and B) and Mag-Fura-2 (C and D) competing with ATH434 for Fe2+ ions. Fluorescence Fe2+ quenching of Fura-4F in competition with ATH434 with fluorescence spectra (E) and corresponding binding profile (F). Spectra of chromophore or fluorophore by itself indicated in red and an arrow that designates the wavelength of characterization (panels A, C, and E, respectively). Best-fit simulations of data points for each binding profile shown with error bars from three independent titrations.
Fig. 3
Fig. 3
Anaerobic Fe2+ competition binding assay for DFX, DFP, DMOG, and IOX3. Representative titration absorption spectra with corresponding binding profiles of Mag-Fura-2 competing for Fe2+ ions with DFX (A and B), DFP (C and D), DMOG (E and F), and IOX3 (G and H). Spectra of chromophore by itself indicated in red and the arrow designates wavelength of characterization (panels A, C, E, G, respectively). Best-fit simulations of data points for each binding profile shown with error bars from three independent titrations.
Fig. 4
Fig. 4
Isothermal titration calorimetry spectra for Fe2+ binding to ATH434, DFX, DFP, DMOG, IOX3, and ATH434-OMe. Raw isothermal titration calorimetry data (top) and the corresponding integrated thermogram with best-fit simulation (bottom) for Fe2+ titrations into: ATH434 (A and B), DFX (C and D), DFP (E and F), DMOG (G and H), IOX3 (I and J), and ATH434-OMe (K and L), respectively.
Fig. 5
Fig. 5
Isothermal titration calorimetry spectra for Fe3+ binding to ATH434, DMOG, and IOX3. Raw isothermal titration calorimetry data (top) and the corresponding integrated thermogram with best-fit simulation (bottom) for Fe3+ titrations into: ATH434 (A and B), DMOG (C and D), and IOX3 (E and F), respectively.
Fig. 6
Fig. 6
Normalized k-edge XANES spectrum of Fe2+ drug complexes for ATH434, DFX, DFP, DMOG, and IOX3. (A) Representative Fe k-edge XANES spectra of Fe2+ bound to ATH434 (teal), DFX (purple), DFP (orange), DMOG (black), and IOX3 (pink). (B) Expanded pre-edge spectra of representative 1s→3d transitions for each complex offset for clarity.
Fig. 7
Fig. 7
Normalized k-edge XANES spectrum of Fe3+ bound ATH434, DMOG, and IOX3. (A) Representative Fe k-edge XANES spectra of Fe3+ bound to ATH434 (teal), DMOG (black), and IOX3 (pink). (B) Expanded pre-edge spectra of representative 1s→3d transitions for each complex offset for clarity.
Fig. 8
Fig. 8
Raw EXAFS and Fourier Transform or Fe2+ bound ATH434, DFX, DFP, DMOG, and IOX3. Full EXAFS with corresponding Fourier transform of the EXAFS data for Fe2+ loaded complexes: ATH434 (A and B), DFX (C and D), DFP (E and F), DMOG (G and H), and IOX3 (I and J), respectively. Empirical data shown in black and theoretical simulation shown in green.
Fig. 9
Fig. 9
Raw EXAFS and Fourier Transform or Fe3+ bound ATH434, DMOG, and IOX3. Full EXAFS with corresponding Fourier transform of the EXAFS data for Fe3+ loaded complexes: ATH434 (A and B), DMOG (C and D), and IOX3 (E and F), respectively. Empirical data shown in black and theoretical simulation shown in green.
Fig. 10.
Fig. 10.
Ligand-dependent O2 consumption data reflecting Fe2+ autooxidation for DFX, ATH434, and DFP. Initial oxygen consumption velocities (Clark-type O2 electrode) measured as a function of [Fe2+] (panel A) and [Ligand] (panel B) for: DFX (green), ATH434 (blue), DFP (red), and control (black) samples. Straight line represents the fitted first-order relationship between these concentrations and the theoretical first-order rate constants provided in Table 7. Error bars on the mean velocity values are not apparent as they are smaller than the dimension of symbols in most cases.
Fig. 11.
Fig. 11.
ATH434-dependent Fe2+ autooxidation correlates with ATH434 binding of metal. Titration of ATH434 with Fe2+ is compared to the calorimetric behavior in the titration of ATH434-OMe (A). Initial oxygen consumption velocities due to the autoxidation of Fe2+ (0.5 mM) were measured in the absence serving as the control (black dashed line) or presence of 1.0 mM ATH434 (solid black line) or ATH434-OMe (dashed black line) (B). Ligand injection occurred at 125 s in panel B.

Similar articles

Cited by

References

    1. Galaris D., Pantopoulos K., Oxidative stress and iron homeostasis: mechanistic and health aspects, Crit. Rev. Clin. Lab. Sci., 2008, 45(1), 1–23. 10.1080/10408360701713104 - DOI - PubMed
    1. Chang K. H., Chen C. M., The role of oxidative stress in Parkinson's disease, Antioxidants (Basel), 2020, 9(7), 597. - PMC - PubMed
    1. Calabrese V., Lodi R., Tonon C., D'Agata V., Sapienza M., Scapagnini G., Mangiameli A., Pennisi G., Stella A. M., Butterfield D. A., Oxidative stress, mitochondrial dysfunction and cellular stress response in Friedreich's ataxia, J. Neurol. Sci., 2005, 233(1–2), 145–162. 10.1016/j.jns.2005.03.012 - DOI - PubMed
    1. Schapira A. H., Mitochondrial dysfunction in neurodegenerative disorders, Biochimica et Biophysica Acta (BBA)—Bioenergetics, 1998, 1366(1–2), 225–233. 10.1016/S0005-2728(98)00115-7 - DOI - PubMed
    1. Bradley J. L., Homayoun S., Hart P. E., Schapira A. H., Cooper J. M., Role of oxidative damage in Friedreich's ataxia, Neurochem. Res., 2004, 29(3), 561–567. 10.1023/B:NERE.0000014826.00881.c3 - DOI - PubMed

Publication types

MeSH terms