. 2024 Oct;56(10):2054-2067.
doi: 10.1038/s41588-024-01896-3. Epub 2024 Sep 24.

Statistically and functionally fine-mapped blood eQTLs and pQTLs from 1,405 humans reveal distinct regulation patterns and disease relevance

Affiliations

Statistically and functionally fine-mapped blood eQTLs and pQTLs from 1,405 humans reveal distinct regulation patterns and disease relevance

Qingbo S Wang et al. Nat Genet. 2024 Oct.

Erratum in

Abstract

Studying the genetic regulation of protein expression (through protein quantitative trait loci (pQTLs)) offers a deeper understanding of regulatory variants uncharacterized by mRNA expression regulation (expression QTLs (eQTLs)) studies. Here we report cis-eQTL and cis-pQTL statistical fine-mapping from 1,405 genotyped samples with blood mRNA and 2,932 plasma samples of protein expression, as part of the Japan COVID-19 Task Force (JCTF). Fine-mapped eQTLs (n = 3,464) were enriched for 932 variants validated with a massively parallel reporter assay. Fine-mapped pQTLs (n = 582) were enriched for missense variations on structured and extracellular domains, although the possibility of epitope-binding artifacts remains. Trans-eQTL and trans-pQTL analysis highlighted associations of class I HLA allele variation with KIR genes. We contrast the multi-tissue origin of plasma protein with blood mRNA, contributing to the limited colocalization level, distinct regulatory mechanisms and trait relevance of eQTLs and pQTLs. We report a negative correlation between ABO mRNA and protein expression because of linkage disequilibrium between distinct nearby eQTLs and pQTLs.


Conflict of interest statement

Q.S.W. is an employee of Calico Life Sciences. The other authors declare no competing interests.

Figures
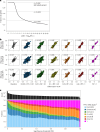
Fig. 1
Fig. 1. A fine-mapped pQTL resource from 1,384 EAS samples.
a, Fraction of genes passing the minimum P threshold. b, Concordance of variant effect size in an external large pQTL dataset (the UKB PPP), stratified according to the population in the UKB PPP (row) and the PIP of our pQTL fine-mapping (column). For simplicity, only variants with P < 0.05 in the UKB PPP are included. c, Concordance of PIP with an external pQTL fine-mapping dataset that used the SOMAscan platform (ARIC).
Fig. 2
Fig. 2. Functional characterization of fine-mapped pQTLs.
a, Enrichment of major functional annotations along with pQTL PIPs. The missing dot in the category corresponds to n = 0. b, Enrichment of protein-level structure and localization annotations along with pQTL PIPs for missense variants. c, Concordance between the fine-mapped pQTL PIPs in our dataset and the ARIC dataset, stratified according to major functional annotations. d, Enrichment of missense variation in possibly causal (PIP > 0.1) pQTLs, with inconsistent effect direction between datasets. e, Enrichment of colocalization score between pQTLs and 49 fine-mapped eQTLs in the GTEx. *P < 0.05, **P < 0.05/49. a,b, n = 27,354,135, 164,350, 32,868, 4,257, 562, 508 and 81 variant–gene pairs are included in each category. c, n = 1,008, 1,304, 1,759 and 4,705 variant–gene pairs are included in each panel. e, All 27,556,761 variant–gene pairs are included. Those missing in the GTEx were omitted from the downsampling process (Methods).
Fig. 3
Fig. 3. Characterization of mRNA-specific and protein-specific or colocalizing QTLs and genes.
a, Correlation between eQTL and pQTL effect sizes in our dataset, stratified according to the PIPs from the fine-mapping of each QTL. b, Fraction of fine-mapped sQTLs for different QTL categories. c, Enrichment of major functional annotations for mRNA-specific or protein-specific QTL PIP bins. d, Number of genes harboring mRNA-specific or protein-specific or colocalizing QTLs. e, Distribution of constraint score (LOEUF) and number of mRNA-expressing (TPM > 1) tissues in the GTEx for different QTL categories. f, Ridge plot showing the distribution of correlation between mRNA and protein expression in 998 samples, stratified according to the percentage of whole-blood expression in the GTEx. g, Fraction with colocalization evidence according to varying thresholds, stratified according to the percentage of whole-blood expression in the GTEx. Each stratum contains 1,429, 510 and 272 (174 + 55 + 43) genes, as visible in f. h, Locus zoom around the NDST1 gene, as an example of blood mRNA-specific regulation on a constrained gene.
Fig. 4
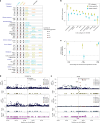
Fig. 4. Complex trait colocalization.
a, Number of colocalizing genes for each of the major BBJ trait–QTL pairs, along with gene examples. The color coding of the genes corresponds to the QTL classifications. b, Enrichment of complex trait PIPs from the UKB according to trait category, for variants with putative mRNA-specific or protein-specific causal QTL effects. c, Enrichment of complex trait PIPs from the UKB, stratified according to the percentage of whole-blood expression in the GTEx. d,e, Specific examples where pQTLs colocalize with complex trait-causal variants (TNFRSF11A (d) and APOE (e)). b, n = 3,206 protein-specific and n = 5,308 mRNA expression-specific QTLs passing the PIP > 0.1 threshold were included. c, Those QTLs were further divided into n = 3,181, 1,344 and 799 mRNA-specific QTLs and n = 1,908, 723 and 585 protein-specific QTLs in each whole-blood mRNA expression level stratum (from low to high), after removing the ones where GTEx data were missing. AID, autoimmune disease; AG, albumin to globulin ratio; ALP, alkaline phosphatase; ALT, alanine aminotransferase; AST, aspartate aminotransferase; CAD, coronary artery disease; CRP, C-reactive protein; eGFR, estimated glomerular filtration rate; GD, Graves’ disease; GGT, γ-glutamyltransferase; HDLC, high-density lipoprotein cholesterol; LDLC, low-density lipoprotein cholesterol; MAP, mean arterial pressure; MCH, mean corpuscular hemoglobin; MCHC, mean corpuscular hemoglobin concentration; MCV, mean corpuscular volume; Meno, age at menopause; MI, myocardial infarction; NAP, nucleosome assembly protein; RA, rheumatoid arthritis; RBC, red blood cell; SBP, systolic blood pressure; sCr, serum creatinine response; T2D, type 2 diabetes; WBC, white blood cell.
Fig. 5
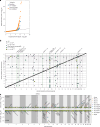
Fig. 5. The trans-QTL analysis.
a, Q–Q plot comparing the P distribution when testing trans-pQTL effects for random variants (blue) or lead cis-pQTL variants (orange). b, Overview of the trans-pQTL effects. c, Miami plot for genome-wide trans-eQTL and trans-pQTL effects of variation in HLA genes. Genes passing the suggestive P < 1 × 10−5 threshold have been enlarged and annotated (in bold if the gene had both mRNA and protein measurements). The largest association in eQTL effect for RNF5P1 was probably driven by a sequencing error. In the plot, we omitted chromosome X, which contained only one significant pQTL association (CFP; P = 9 × 10−5), for visual simplicity.
Fig. 6
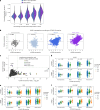
Fig. 6. COVID-19 severity interaction eQTLs (ieQTLs) and interaction pQTLs (ipQTLs).
a, Increase of correlation between mRNA and protein expression in severe COVID-19 across a ranging fraction of whole-blood expression in the GTEx. The boxes inside the violin plots show the 25%, 50% and 75% quantiles. b, An example of increased correlation between mRNA and protein expression along with COVID-19 severity (IL1RL1 gene). c, Scatter plot comparing the significance (−log10(P)) of ieQTLs (x axis) and ipQTLs (y axis), colored according to the rank of expression in lymphocytes in the GTEx, when significant. d, Scatter plot showing the effect of rs77767746 on IL1RL1 mRNA and protein expression. e, Scatter plot showing the effect of rs11202918 on FAS mRNA and protein expression. f, Scatter plot showing the effect of rs11055602 on CLEC4C mRNA and protein expression.
Fig. 7
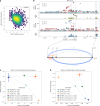
Fig. 7. Negative correlation between whole-blood mRNA and plasma protein expression in ABO.
a, Density scatter plot showing negatively correlated mRNA and protein expression for the ABO gene. b, Locus zoom around the ABO locus containing two putative causal eQTLs and three putative causal pQTLs, and visualization of LD between those five causal variants. c, Normalized protein (x axis) and mRNA (y axis) expression for the rs8176719 genotype, with and without controlling for LD with two nearby putative causal eQTLs. d, Normalized protein (x axis) and mRNA (y axis) expression for the rs656105 genotype, with and without controlling for LD with another nearby putative causal pQTL.
Extended Data Fig. 1
Extended Data Fig. 1. Overview of the study.
We performed mRNA expression QTL (eQTL) fine-mapping from 1,019 RNA-sequenced samples, pQTL fine-mapping from 1,384 protein measured samples, as well as mRNA or protein specific QTL fine-mapping from 998 samples with both measures, all genotyped and processed in a single platform as part of the Japan COVID-19 Task Force. Massive parallel reporter assay (MPRA) was performed for validation of a subset of fine-mapped eQTLs.
Extended Data Fig. 2
Extended Data Fig. 2. eQTL fine-mapping expanded.
a. Comparison of the numbers of eQTLs in our dataset compared to the previous release. b. Functional score (the expression modifier score = EMS) enrichment in eQTLs along with the posterior inclusion probability (PIP). c. Percentage of expression modifying variants (emvars) experimentally validated in massive parallel reporter assay (MPRA). Tier 1 corresponds to FDR < 0.01 and tier 2 to FDR < 0.1. n in each bin = 7,418, 2,060, 685, 885 and 317 variants. d. Percentage of agreement between the direction of variant effects in eQTL or MPRA study. n in each bin = 7,418, 2,992 and 955 variants.

References

    1. Aguet, F. et al. Genetic effects on gene expression across human tissues. Nature550, 204–213 (2017). - PMC - PubMed
    1. Aguet, F. et al. The GTEx Consortium atlas of genetic regulatory effects across human tissues. Science369, 1318–1330 (2020). - PMC - PubMed
    1. Liu, Y., Beyer, A. & Aebersold, R. On the dependency of cellular protein levels on mRNA abundance. Cell165, 535–550 (2016). - PubMed
    1. Buccitelli, C. & Selbach, M. mRNAs, proteins and the emerging principles of gene expression control. Nat. Rev. Genet.21, 630–644 (2020). - PubMed
    1. Umans, B. D., Battle, A. & Gilad, Y. Where are the disease-associated eQTLs? Trends Genet.37, 109–124 (2021). - PMC - PubMed