. 2024 Oct;56(10):2174-2184.
doi: 10.1038/s41588-024-01920-6. Epub 2024 Sep 24.

Defining heritability, plasticity, and transition dynamics of cellular phenotypes in somatic evolution

Affiliations

Defining heritability, plasticity, and transition dynamics of cellular phenotypes in somatic evolution

Joshua S Schiffman et al. Nat Genet. 2024 Oct.

Abstract

Single-cell sequencing has characterized cell state heterogeneity across diverse healthy and malignant tissues. However, the plasticity or heritability of these cell states remains largely unknown. To address this, we introduce PATH (phylogenetic analysis of trait heritability), a framework to quantify cell state heritability versus plasticity and infer cell state transition and proliferation dynamics from single-cell lineage tracing data. Applying PATH to a mouse model of pancreatic cancer, we observed heritability at the ends of the epithelial-to-mesenchymal transition spectrum, with higher plasticity at more intermediate states. In primary glioblastoma, we identified bidirectional transitions between stem- and mesenchymal-like cells, which use the astrocyte-like state as an intermediary. Finally, we reconstructed a phylogeny from single-cell whole-genome sequencing in B cell acute lymphoblastic leukemia and delineated the heritability of B cell differentiation states linked with genetic drivers. Altogether, PATH replaces qualitative conceptions of plasticity with quantitative measures, offering a framework to study somatic evolution.


Conflict of interest statement

Competing Interests Statement. MLS is equity holder, scientific co-founder, and advisory board member of Immunitas Therapeutics. CG is a co-founder, equity holder, and board member of BioSkryb Genomics. DAL has served as a consultant for Abbvie, AstraZeneca and Illumina, and is on the Scientific Advisory Board of Mission Bio, Pangea, Alethiomics, Montage Bio and Veracyte; DAL has received prior research funding from BMS, 10x Genomics, Ultima Genomics, and Illumina unrelated to the current manuscript. All other authors declare no competing interests.

Figures

Extended Data Fig. 1
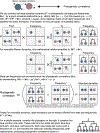
Extended Data Fig. 1. Cell state transition dynamics and phylogenetic correlations.
Cell state transition dynamics can be linked with phylogenetic correlations using mathematical modeling (Methods).
Extended Data Fig. 2
Extended Data Fig. 2. Cell state transition dynamics predict phylogenetic correlations.
a, Simulated idealized phylogeny containing 26 = 64 cells (Supplementary Note) in which cells can transition between three possible cell states. Cell state transitions are represented as a discrete-time Markov chain (Supplementary Note). b, Simulated cell state transition dynamics and measured phylogenetic auto-correlations (Methods) for the first cell state for 1,000 independent simulations on idealized phylogenies, containing 210 cells, in which state transition probabilities were randomly generated for each trial. Phylogenetic correlations were computed using a weighting function that included only sibling cells (one-node only, as described in Methods). LOESS regression line (blue) with 95% confidence interval (light gray) is shown. c, (Left) Simulated versus PATH-inferred cell state self-transition (i.e., stability) probabilities (Methods), by transforming the phylogenetic auto-correlations measured in b. (Right) Simulated versus PATH-inferred cell state transition probabilities from state 1 to 2, on idealized phylogenies (Supplementary Note). Dashed red lines both have slope 1 and pass through the origin. Linear regression lines (blue) with 95% confidence intervals (light gray) are shown for both plots. Spearman’s correlation coefficients shown in panels b and c had two-sided p-values < 2.2e-16, the limit of precision in R.
Extended Data Fig. 3
Extended Data Fig. 3. PATH inferences and simulations of somatic evolution.
a, Same as Fig. 2b but for systems where heritability is not detectable for all cell states (at least one state phylogenetic auto-correlation z score ≤ 2) b, Comparing the state transition dynamic inference accuracy of PATH using phylogenetic correlations measured at different node depths. Transition inference error is measured as the Euclidean distance between simulated and inferred transition probabilities, and the number of possible states in a simulated system is shown on the x-axis. 1,000 phylogenies were simulated for each system and sampled at a rate of 10−2. c, Mean path length distance, Phylogenetic correlation difference, and Robinson-Foulds distance between simulated true and reconstructed phylogenies (Supplementary Note). Phylogenies were simulated 1,000 times for each barcode length (x-axis). d, Expected pendant edge lengths for a sampled somatic evolutionary process, as a function of birth, death, and sampling rates (Supplementary Note). e, Transition inference error (Euclidean distance between inferred and true transition probabilities) using PATH or MLE for 3, 4, or 5 cell states in a phylogeny composed of either 100, 500, or 1,000 cells, representing a sample of 10−6 or 10−3 of the total population. Each parameter combination was simulated 1,000 times. f, Runtimes corresponding to simulations sampled at a rate of 10−6 depicted in e. Box plots represent median, bottom and upper quartiles; whiskers correspond to 1.5 times interquartile range.
Extended Data Fig. 4
Extended Data Fig. 4. PATHpro inferences from simulations of somatic evolution with cell state-specific proliferation rates.
a, Comparison of PATH versus PATHpro transition inference errors (Euclidean distance between inferred and simulated transition probabilities) on simulated data when proliferation rates depend on cell state (Methods). Phylogenies were simulated in forward time, starting with one cell and ending after reaching 104 cells, and then subsampled to 103 cells. The state of the first cell was randomly chosen, and 1, the proliferation rate of state 1, is shown by the x-axis, and 2, the proliferation rate of state 2, was fixed at 1. Cell state transitions between states were symmetric with P12=P21=0.1. 100 phylogenies were simulated for each proliferation rate. b, Diagrams of cell state transition probabilities used for benchmarking PATHpro (Supplementary Note). c, Comparison of transition probability inferences between PATHpro and SSE-MLE for systems shown in b, when the true proliferation rates are known. Inference error is the Euclidean distance between inferred and true transition probabilities. d, Comparison of transition probability and proliferation rate inferences for networks shown in b when proliferation rates are not known. Inference error is measured as the Euclidean distance between true/simulated and inferred transition probabilities or proliferation rates and values reported are rounded to the nearest thousandth. e, Comparison of PATHpro and SSE-MLE run times for the inferences shown in d, with the y-axis is scaled by log10(seconds). For all box plots, boxes represent the interquartile range (IQR); the center line represents the median; minima and maxima shown represent 1.5⋅IQR. For violin plots, white lines correspond to the median, and dashed lines represent the mean. Box and violin plots represent 100 simulated phylogeny replicates each.
Extended Data Fig. 5
Extended Data Fig. 5. Quantifying the heritability versus plasticity of EMT transcriptional states.
a, Tumor cell harvest site phylogenetic correlations. b, EMT bin phylogenetic correlations (z scores). Colors represent putative states. Full table of EMT bin phylogenetic correlations can be found in Supplementary Table 1. c, Single-cell phylogeny from Mouse 1, Clone 1 from Simeonov et al., containing 700 of 7,968 randomly chosen cells for visualization. Each leaf represents a single cell. Cells are colored by PATH-defined states (T1, T2, T3, M). d, EMT bin phylogenetic correlation (z score) heat maps using different bin sizes (0.5, 2, 3). e, Box and whisker plot of EMT bin phylogenetic correlations (z scores) across phylogenies that contain cells from only one harvest site. Dots correspond to EMT bins. (T1, n = 7 bins; T2, n = 11 bins; T3, n = 6 bins; M n = 1 bin). Bins are grouped and colored by transition state membership. f, PATHpro-inferred transition probabilities between states (T1, T2, T3, M) for branch lengths imputed using a death rate of 0, 0.01, or 0.02. Transition probabilities inferred for 100 iterations of subsampling 5,248 out of 10,495 cells for each imputation (Supplementary Note). For all box plots, boxes represent the interquartile range (IQR); the center line represents the median; minima and maxima shown represent 1.5⋅IQR.
Extended Data Fig. 6
Extended Data Fig. 6. PATH inferred cell state transitions and gene set enrichment in human glioblastoma.
a, Heat map of the phylogeny-replicate (n = 9) mean phylogenetic correlations (Methods) for the top 100 most heritable genes (determined by phylogeny-replicate mean gene phylogenetic auto-correlation z scores) in MGH115. Over-representation analysis (ORA) performed on the genes in each of the two clusters, defined by hierarchical clustering using Ward’s method, separately. Phylogenetic correlations were computed using an inverse-node-distance weighting (Methods). Only select gene sets are depicted for Cluster 2; remaining significantly enriched gene sets are in Supplementary Table 4. b, PATHpro-inferred transition probabilities for MGH115. Transitions and proliferations, for t=τ/2, depicted correspond to the median ± MAD from ML phylogeny replicates, with low transition probabilities (Pij<0.05) omitted. c, PATH-inferred transition probabilities P (Methods) from neurodevelopmental-like (Stem-/AC-like) cell states to the MES-like cell state in human patient-derived GBM samples MGH115 and MGH122. Points correspond to PATH inferences for each phylogeny ML replicate (n = 9) per sample. Significance determined by two-sided t-test for Stem-like vs AC-like in MGH115 and MGH122, respectively. Colors correspond to cell state. Box plots represent median, bottom and upper quartiles; whiskers correspond to 1.5 times the interquartile range.
Extended Data Fig. 7
Extended Data Fig. 7. Quantifying cell state heterogeneity in B-ALL using single-cell whole-genome sequencing.
Genome-wide copy-number deletion annotations projected onto the B-ALL single-cell phylogeny from Fig. 5a. 25-kb copy-number events detected in at least 5 cells were concatenated and displayed next to the phylogeny. Single-cell CNV events were colored based on chromosomes. chr4.q31.21, chr6.q16.3-chr6.q22.33, chr11.p11.2 and chr16.p13.12 represent the largest deletions.
Figure 1.
Figure 1.. Phylogenetic correlations quantify the heritability versus plasticity of single-cell phenotypes.
a, Diagram of highly heritable (categorical) cell state transition dynamics. Markov transition probabilities between states were simulated as Pαα=Pββ=0.9, and Pαβ=Pβα=0.1. b, Phylogeny containing 200 cells, simulated as a somatic evolutionary process (Supplementary Note), with transitions depicted in a, with birth rate = 1 and death rate = 0. c, Phylogenetic auto-correlations (Methods) for cell states derived from the phylogeny depicted in b. d, Phylogenetic cross-correlation (Methods) heat map for cell states depicted in b. Diagonals are equivalent to values shown in c. e, Diagram of highly plastic (categorical) cell state transition dynamics. Markov transition probabilities between states were all the same (Pαα=Pββ=Pαβ=Pβα=0.5). f, Phylogeny containing 200 cells, simulated as a somatic evolutionary process, with transitions depicted in e, with birth rate = 1 and death rate = 0. g, Phylogenetic auto-correlations for cell states depicted in e. h, Phylogenetic cross-correlation heat map for cell states depicted in f. i, Diagram of a three-state system in which states α and γ transition to each other at a rate higher than either transitions to state β. Markov transition probabilities between the three states were Pαα=Pαγ=Pγγ=0.5,Pαβ=Pβα=0,Pγα=0.45,Pβγ=0.1,Pγβ=0.05, and Pββ=0.9. j, Phylogeny containing 200 cells, simulated as a somatic evolutionary process, with transitions depicted in i, with birth rate = 1 and death rate = 0. k, Phylogenetic auto-correlations for cell states depicted in j. l, Phylogenetic cross-correlation heat map for cell states depicted in j.
Figure 2.
Figure 2.. Measuring heritability, plasticity, and cell state transition dynamics in somatic evolution.
a, Simulated cell state stability (Markov self-transition probability) versus measured phylogenetic auto-correlation under different sampling rates (103 simulations per sampling rate). Phylogenies contain 103 cells and cell state transition dynamics were randomly generated for three-state systems. Phylogenies simulated as a sampled somatic evolutionary process (Supplementary Note) with birth rate = 1 and death rate = 0. Lines colored by sampling rate depict LOESS regression lines with 95% confidence intervals (light gray). The dotted gray line shows z score = 2. b, Simulated versus PATH-inferred state stability for systems with phylogenetic auto-correlation z scores > 2. Colors represent sampling rates as in a. Linear regression line (black) with 95% confidence interval (gray) is shown. Spearman’s correlation coefficient p value < 2.2e-16 corresponds to a two-sided test and represents the precision limit in R. Plot depicts 5,902 points with 53 outliers, defined by their residuals falling outside ± 3 SD, removed. c, Comparing state transition inferences of PATH using two different node depth estimation methods: (light purple) using measured branch length distances, and (dark purple) using imputed branch lengths (Supplementary Note) from estimated cell sampling rates. For each barcode length, 100 phylogenies, each with 103 cells and three possible cell states, were simulated as a somatic evolutionary process and sampled at rate 10−2. Phylogenies were reconstructed by using the UPGMA algorithm on the cell pairwise Hamming distances between simulated lineage barcodes that were stochastically scarred at rate s = 0.01 (Supplementary Note). d, Comparing the state transition dynamic inference accuracy of PATH (light purple) with Maximum Likelihood Estimation (MLE; orange). Inference error is calculated as the Euclidean distance between inferred and simulated transition probability matrices, and the number of possible states in a simulated system is shown on the x-axis (Supplementary Note). Panel depicts simulations for 103 cell phylogenies, sampled at a rate of 10−2 with minimum auto-correlation z scores > 0 (corresponding to 967 two-state, 704 four-state, 408 six-state, and 258 eight-state simulations). e, Same as d but measuring compute time. f, Comparing PATH and MLE compute times while varying phylogeny size (number of cells; x-axis) fixing systems to four cell states and sampled at 10−2, and filtering as in d and e depicting 298 100-cell, 612 500-cell, and 705 103-cell simulations. Box plots represent the median, bottom and upper quartiles; whiskers correspond to 1.5 times the interquartile range, with outliers shown as points.
Figure 3.
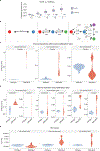
Figure 3.. Quantifying EMT plasticity during metastasis in pancreatic cancer.
a, Single-cell phylogeny from Mouse 1, Clone 1 from Simeonov et al., containing 1,000 randomly chosen of 7,968 cells for visualization (Supplementary Note). Each leaf represents a single cell. Leaves are colored by their harvest site. CTCs denote circulating tumor cells. Mets, metastases. b, Phylogenetic auto-correlation z scores of tumor cells annotated by harvest site. Samples are colored by harvest site, as in a. Box plots represent 1,000 subsampling iterations of 4,000 out of 7,968 cells. c, Single-cell phylogeny from a, with cells colored by EMT and cell cycle score (G2M score). d, Phylogenetic auto-correlation z score of EMT and cell cycle scores across all tumor cells. Box plots represent 1,000 iterations of subsampling 4,000 out of 7,968 cells. e, Phylogenetic auto-correlation z scores of EMT bin. Samples are colored by EMT transition state defined in Extended Data Fig. 5b (light blue, T1; dark blue, T2; light green, T3; dark green, M). Box plots represent 1,000 iterations of subsampling 4,000 out of 7,968 cells. Grey line denotes EMT scores associated with peak metastatic aggression from analysis in Simeonov et al. f, (top) PATHpro-inferred (Supplementary Note) transition probabilities between states (T1, T2, T3 and M) using cells (N = 10,495) from a phylogeny composed of all clones that contained at least 10 cells. Values rounded to the nearest thousandth. Transition probabilities inferred from 100 subsampling iterations of 5,248 out of 10,495 cells (Supplementary Note), showing mean and standard deviation. Transition probabilities < 0.005 are not depicted. (Bottom) Mean ± SD PATHpro-inferred proliferation rates, from 100 subsampling iterations of 5,248 of 10,495 cells, versus scRNAseq-based proliferation rate estimates (Supplementary Note). The p-value = 0.002 for Pearson’s correlation coefficient was computed using a two-sided test. All box plots represent median, bottom and upper quartiles; whiskers correspond to 1.5 times the interquartile range, with outliers as points.
Figure 4.
Figure 4.. Heritable transcriptional modules and cell state transition dynamics in human glioblastoma.
a, Human GBM sample (MGH105) single-cell consensus phylogeny containing 80 cells (20 from each tumor location) with tumor sample location projected onto leaves. Inset is a schematic of the four MGH105 patient tumor sample locations. b, Leaf-permutation test (106 permutations) of tumor sample location phylogenetic auto-correlation. Density plot depicts leaf-permutation auto-correlations and red lines show measured (non-permuted) phylogenetic auto-correlations. c, Human GBM patient sample (MGH115) single-cell phylogeny (replicate 6) containing 38 cells with GBM gene module scores and categorical cell states projected onto leaves. d, Dot plot of enriched pathways from GSEA of chemical and gene perturbation curated gene sets (C2:CGP) and six GBM gene modules (NPC1-/NPC2-/OPC-/AC-/MES1-/MES2-like)2 for patient sample MGH115, with genes ranked by their phylogeny-replicate mean phylogenetic auto-correlation z scores (Supplementary Note). Only select gene sets are depicted; other significantly enriched gene sets can be found in Supplementary Table 3. Dot sizes are proportional to GSEA normalized enrichment scores (NES). Adjusted p values derived using the Benjamini-Hochberg procedure for two-sided permutation-based p values using 105 permutations. e, GBM gene module phylogenetic auto-correlation z scores in patient sample MGH115 from 9 maximum likelihood (ML) phylogeny replicates. Box plots represent median, bottom and upper quartiles; whiskers correspond to 1.5 times the interquartile range, with outliers as points. f, Mean ML phylogeny replicate (N=9) gene module phylogenetic correlation heat map for patient sample MGH115. g, Median ± MAD PATH-inferred transition probabilities for patient sample MGH115 using ML phylogeny replicates (N=9). Probabilities shown are shown for P^τ/2 (Supplementary Note). Values rounded to the nearest hundredth. h, Replicate mean phylogenetic correlation z score heat map for gliomasphere GBM gene modules, using one-node weighting. GBM gene modules (NPC-/OPC-/AC-/MES-like) were shortened to (NPC/OPC/AC/MES).
Figure 5.
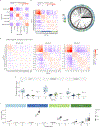
Figure 5.. Quantifying differentiation state heritability in B-ALL using single-cell whole-genome sequencing.
a, (Top left) schematic of single-cell whole-genome sequencing (scWGS) by primary template-directed amplification (PTA) of bone marrow isolated B cells sorted using six cell surface markers from a B-cell acute lymphocytic leukemia patient. Single-cell whole-genome sequences were used to construct a single-cell phylogeny. (Top right) Lineage tree constructed from single-cell whole-genome sequences from a B-ALL patient sample (N=82 cells; ~8x coverage). (Bottom) Genetic [allelic imbalance of germline heterozygous SNPs indicating a copy-number deletion at chr6; variant allele frequency (VAF) of single-nucleotide variant (SNV) of JAK2], Phenotypic (fluorescence of cell surface markers) and Random (sorting time) traits projected onto leaves. Cell surface markers used for cell sorting: CD34, CD10 and CD38 represent more immature B cell states, CD19, CD20 and CD45 represent more mature B-cell states. b, Phylogenetic auto-correlation z scores for genetic (copy-number deletion and SNV as in a), phenotypic (cell surface protein markers) and random (sorting time) factors. Box plots represent 500 maximum likelihood bootstrap replicates of 82-cell phylogenies (Supplementary Note), showing median, lower and upper quartiles; whiskers correspond to 1.5 times interquartile range, with outliers as points. c, Phylogenetic correlation z score heat map for heritable cell surface protein markers. d, Phylogenetic cross-correlation z scores for CD34 and copy number deletions. Phylogeny annotated with genome-wide copy number deletion map can be found in Extended Data Fig. 7. Chromosome 6 regions highlighted in purple. Box plots represent 500 maximum likelihood bootstrap replicates of 82-cell phylogenies (Supplementary Note), showing median, lower and upper quartiles; whiskers correspond to 1.5 times interquartile range, with outliers as points. e, Chromosomal regions of deletions in clones with high CD34 expression.

References

    1. Wu F et al. Single-cell profiling of tumor heterogeneity and the microenvironment in advanced non-small cell lung cancer. Nat. Commun. 12, 2540 (2021). - PMC - PubMed
    1. Neftel C et al. An integrative model of cellular states, plasticity, and genetics for glioblastoma. Cell 178, 835–849.e21 (2019). - PMC - PubMed
    1. Chaligne R et al. Epigenetic encoding, heritability and plasticity of glioma transcriptional cell states. Nat. Genet. 53, 1469–1479 (2021). - PMC - PubMed
    1. Barkley D et al. Cancer cell states recur across tumor types and form specific interactions with the tumor microenvironment. Nat. Genet. 54, 1192–1201 (2022). - PMC - PubMed
    1. Gavish A et al. Hallmarks of transcriptional intratumour heterogeneity across a thousand tumours. Nature 618, 598–606 (2023). - PubMed

Methods-only references

    1. Moran PAP Notes on continuous stochastic phenomena. Biometrika 37, 17–23 (1950). - PubMed
    1. Wartenberg D Multivariate Spatial Correlation: A Method for Exploratory Geographical Analysis. Geographical Analysis vol. 17 263–283 Preprint at (1985).
    1. Chen Y A new methodology of spatial cross-correlation analysis. PLoS One 10, e0126158 (2015). - PMC - PubMed
    1. Czaplewski RL & Reich RM Expected Value and Variance of Moran’s Bivariate Spatial Autocorrelation Statistic for a Permutation Test. (1993).
    1. Schiffman JS Landau-Lab/PATH: V1.0. (Zenodo, 2024). doi:10.5281/zenodo.13144052. - DOI