. 2024 Dec;27(12):2512-2520.
doi: 10.1038/s41593-024-01768-3. Epub 2024 Sep 24.

Single-cell m6A profiling in the mouse brain uncovers cell type-specific RNA methylomes and age-dependent differential methylation

Affiliations

Single-cell m6A profiling in the mouse brain uncovers cell type-specific RNA methylomes and age-dependent differential methylation

Matthew Tegowski et al. Nat Neurosci. 2024 Dec.

Abstract

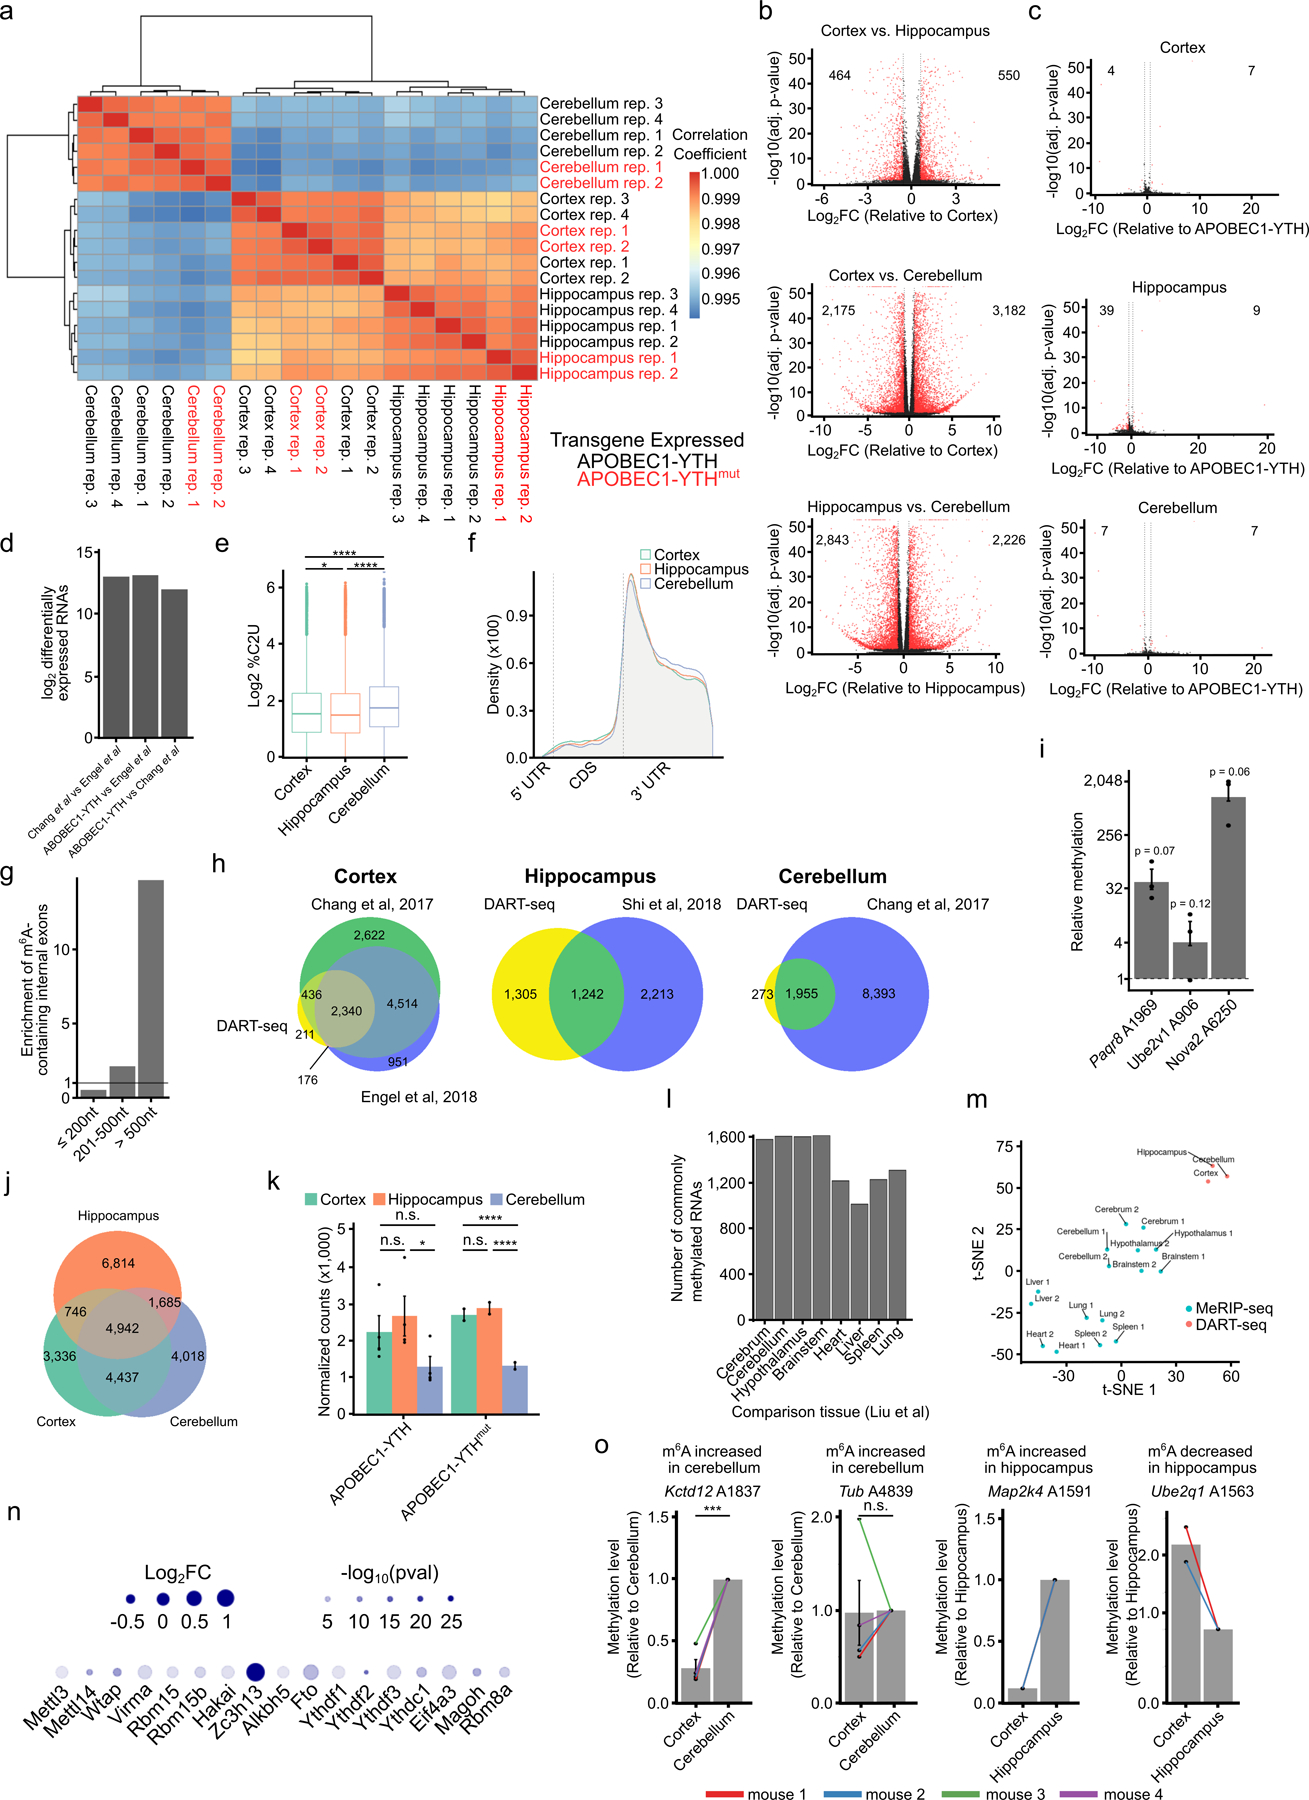
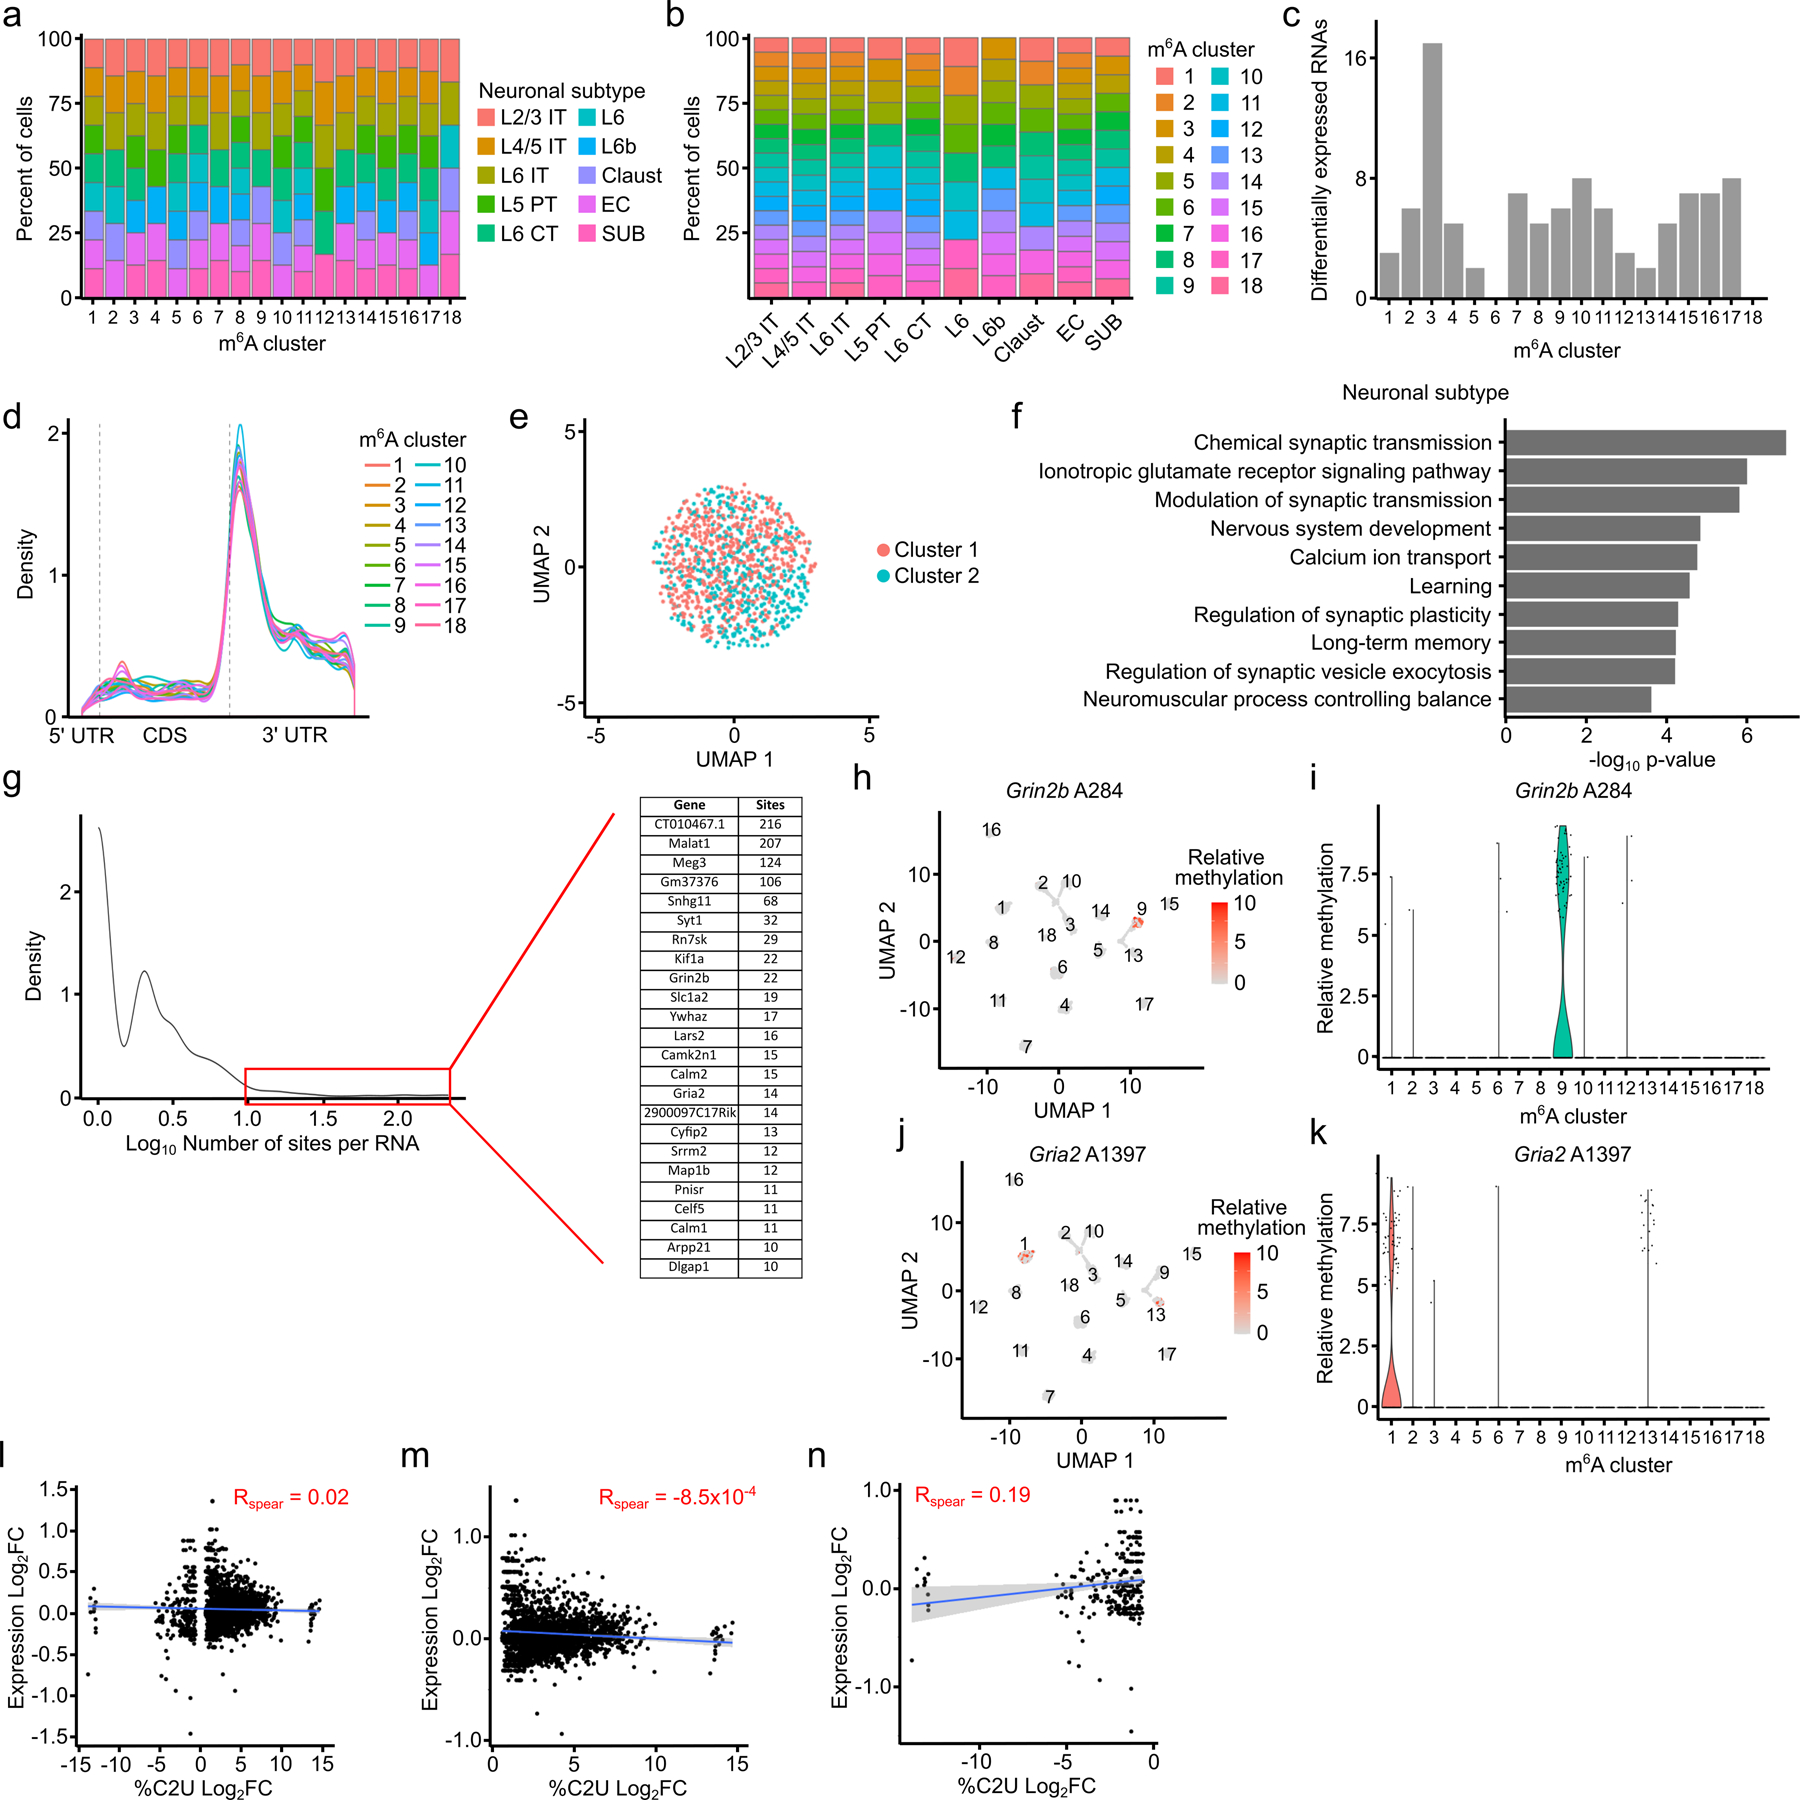
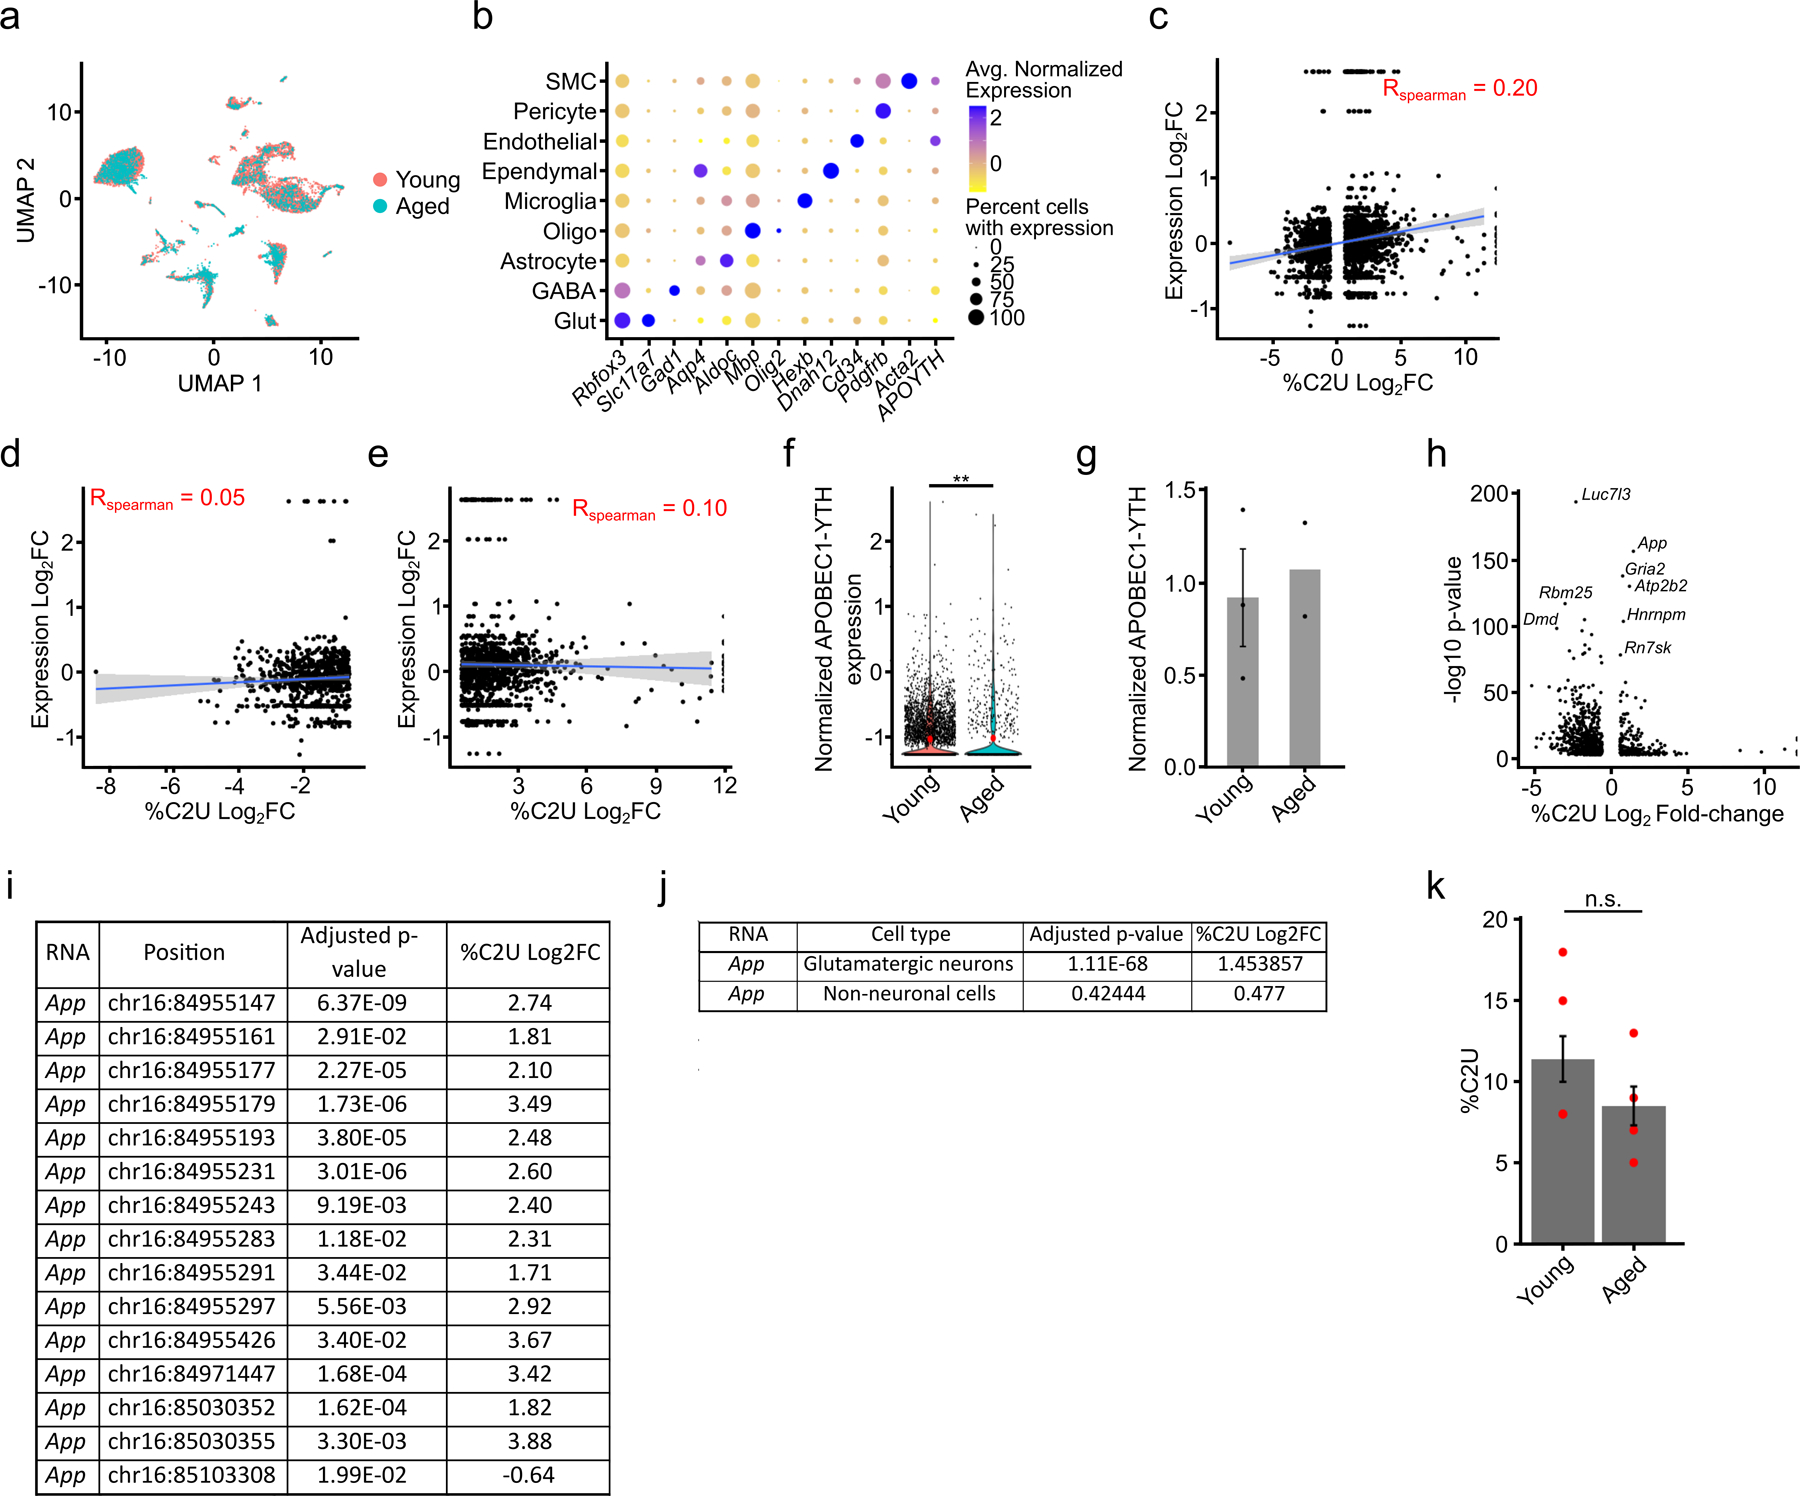
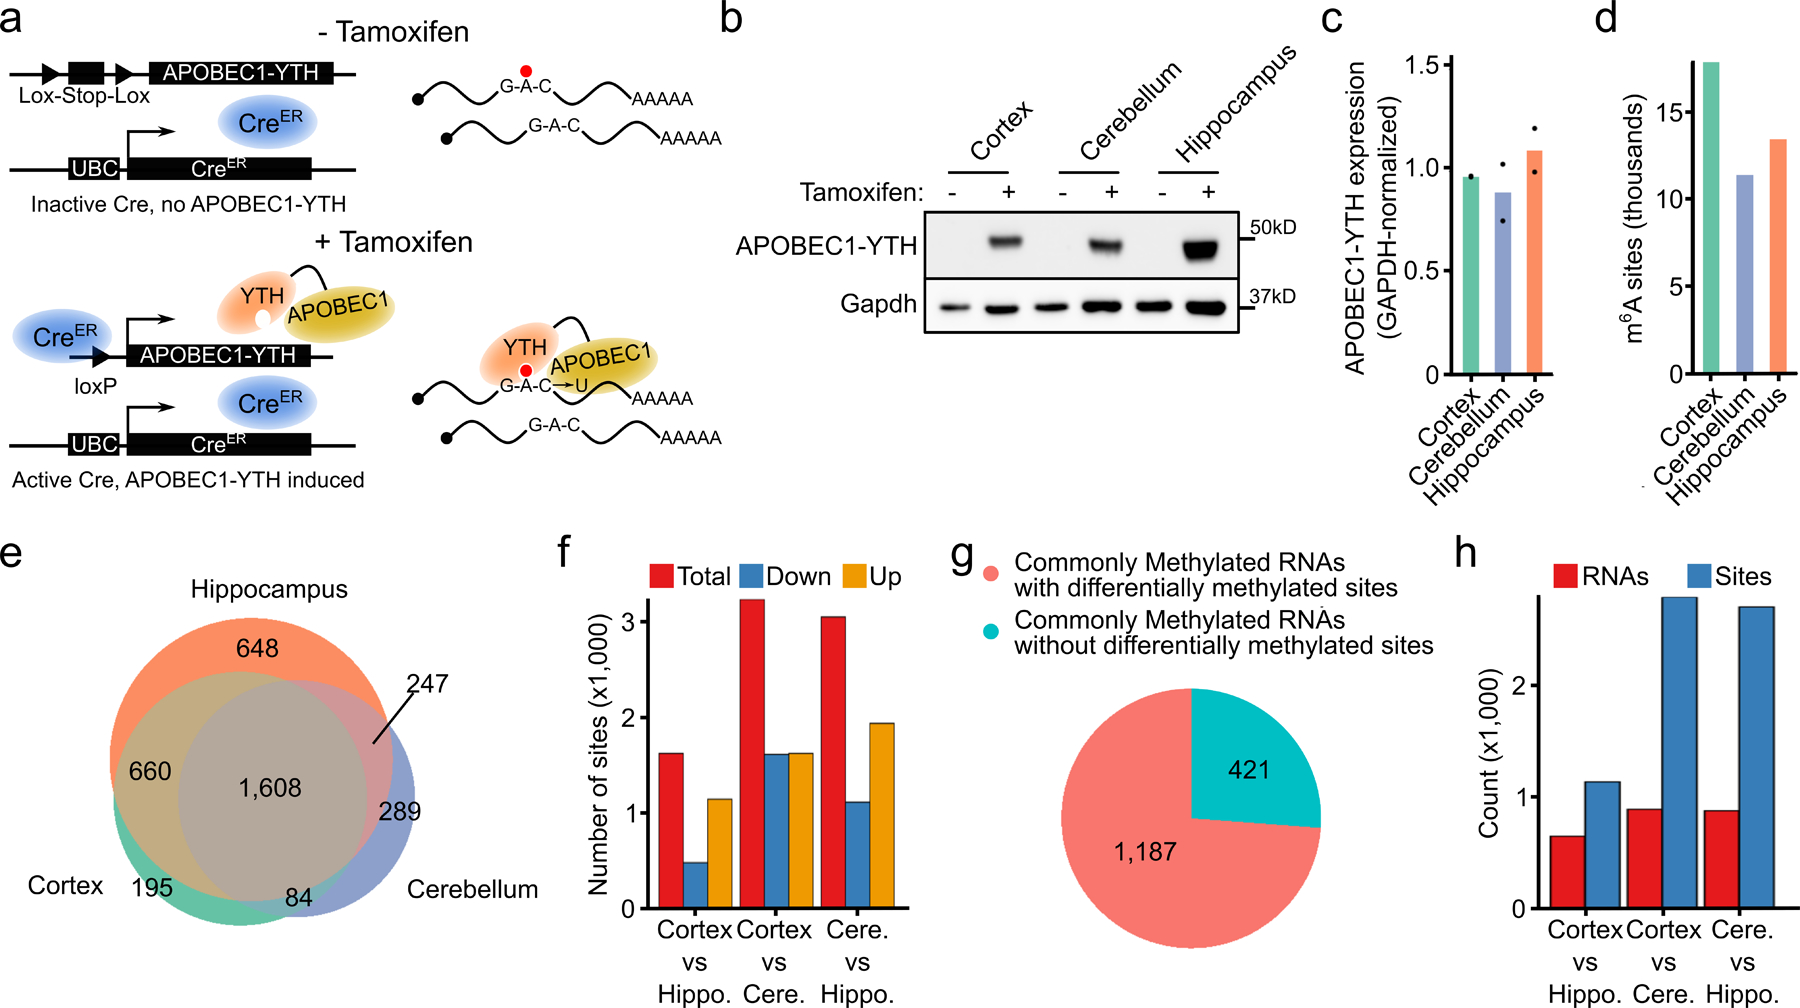
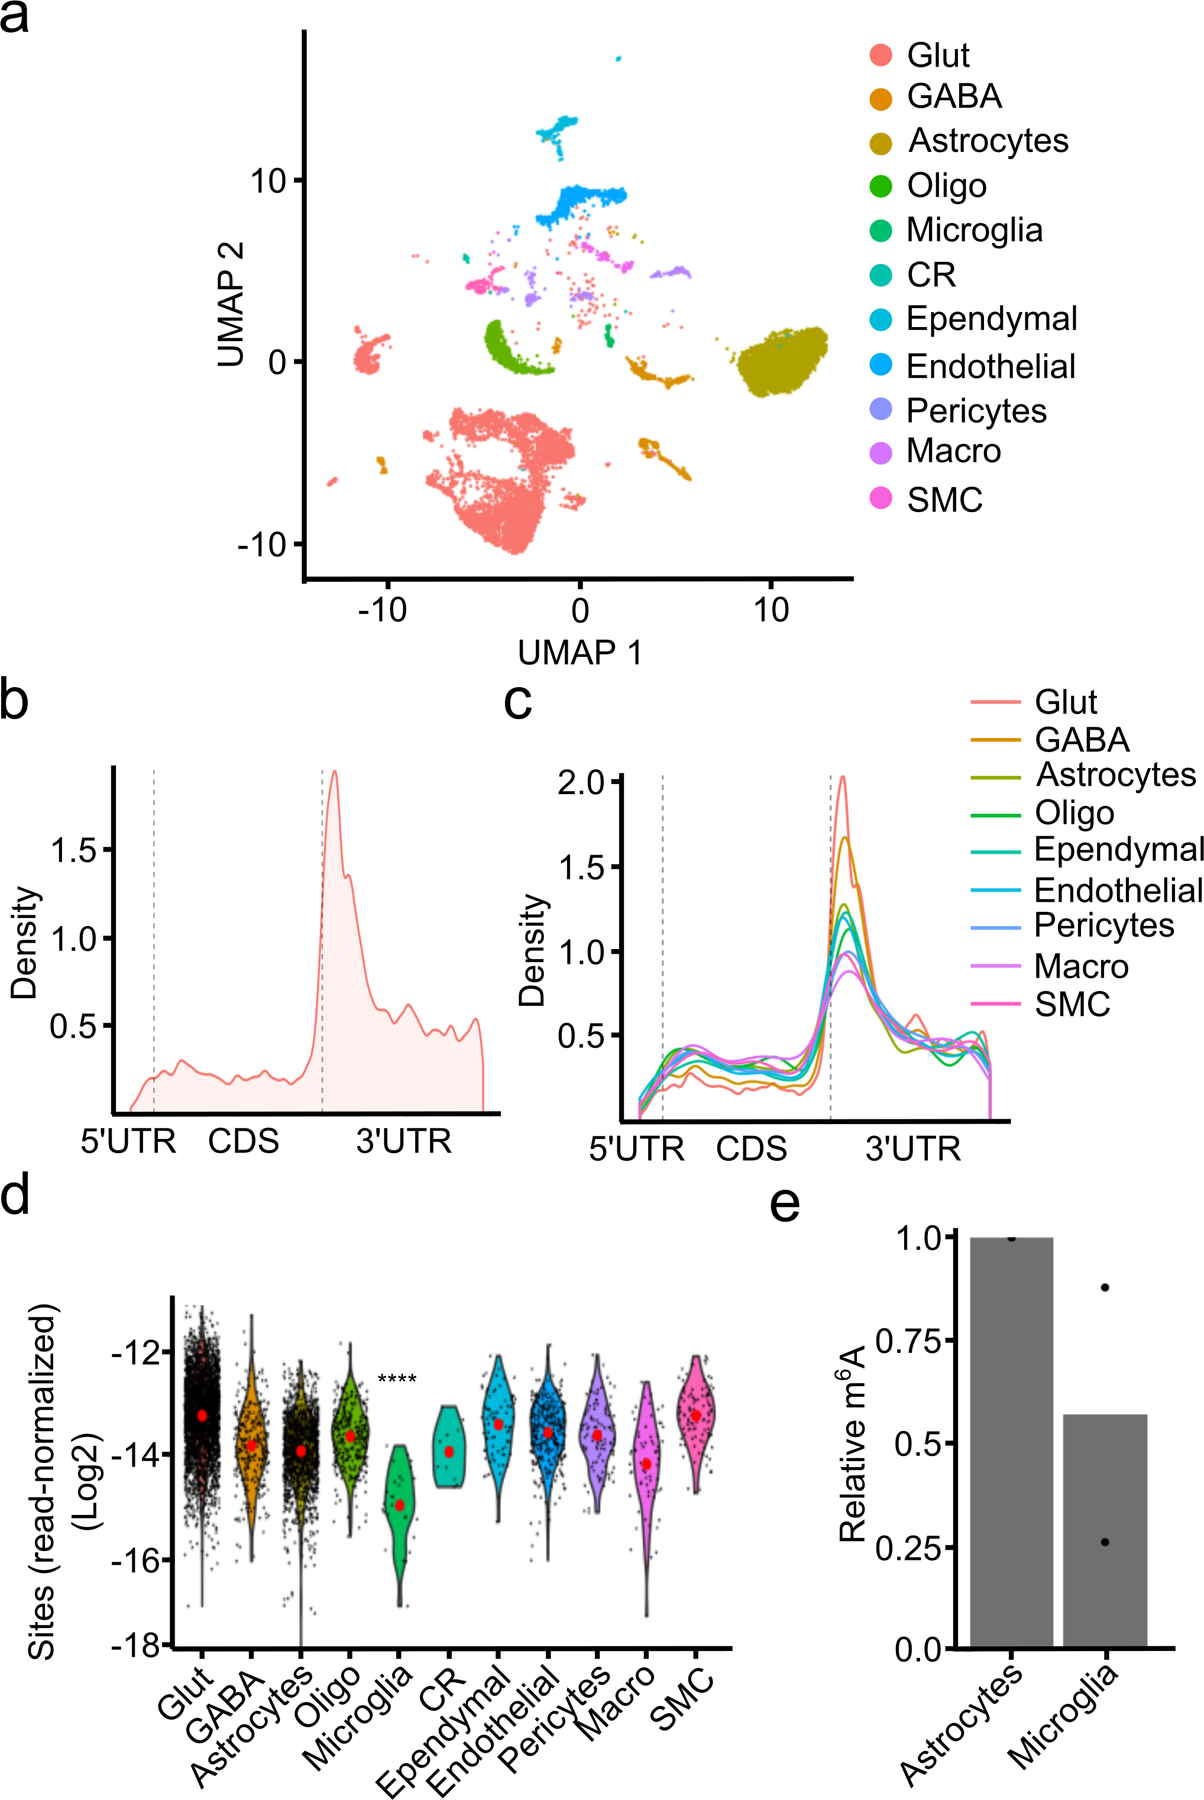
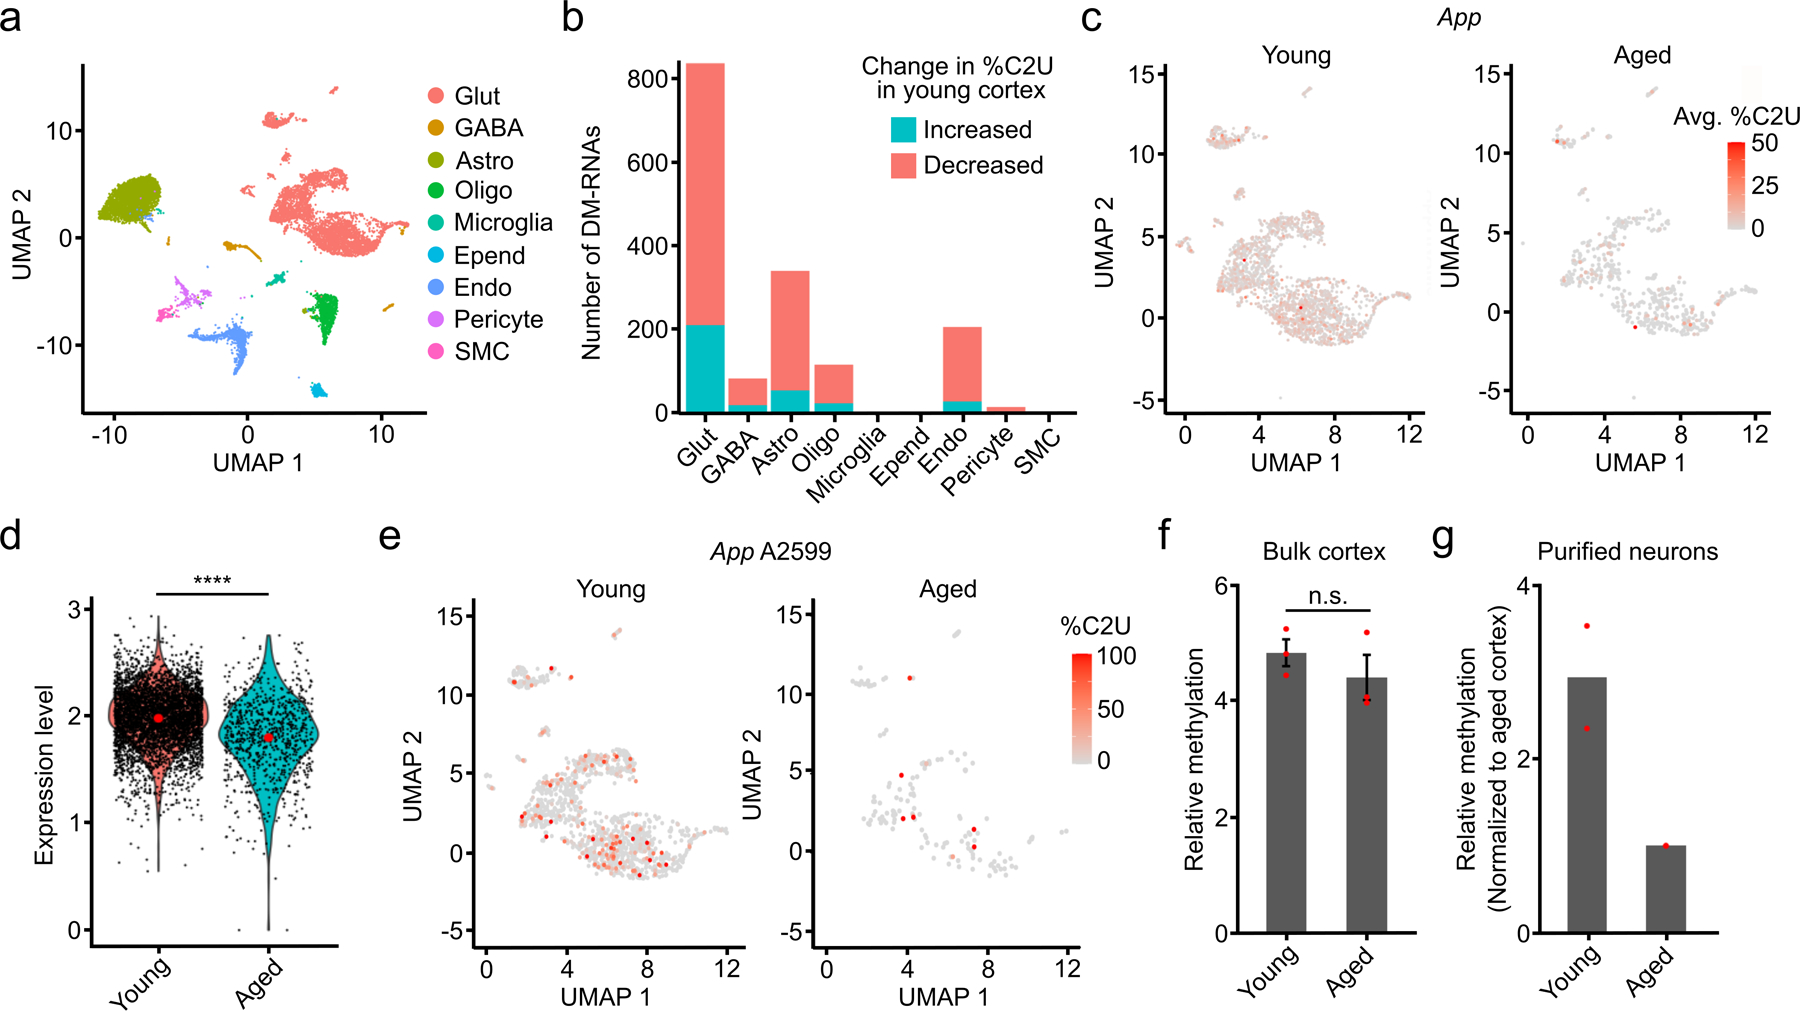
N6-methyladenosine (m6A) is an abundant mRNA modification in the brain that has important roles in neurodevelopment and brain function. However, because of technical limitations, global profiling of m6A sites within the individual cell types that make up the brain has not been possible. Here, we develop a mouse model that enables transcriptome-wide m6A detection in any tissue of interest at single-cell resolution. We use these mice to map m6A across different brain regions and within single cells of the mouse cortex and discover a high degree of shared methylation across brain regions and cell types. However, we also identify a small number of differentially methylated mRNAs in neurons that encode important regulators of neuronal signaling, and we discover that microglia have lower levels of m6A than other cell types. Finally, we perform single-cell m6A mapping in aged mice and identify many transcripts with age-dependent changes in m6A.


Conflict of interest statement

Competing interests: K.D.M. has filed a patent application for the DART-seq technology through Duke University. All other authors declare no competing interests.

Figures

Extended Data Fig. 1 –
Extended Data Fig. 1 –. Tamoxifen-inducible APOBEC1-YTH expression in DART mice.
a, Western blots from liver, lung, kidney, and heart showing inducible transgene expression in APOBEC1-YTH mice (DART mice; top row) and APOBEC1-YTHmut mice (bottom row). Blots are representative of n = 2 biological replicates. GAPDH was run concurrently on a separate identical blot. b, Immunofluorescence of APOBEC1-YTH expression in a coronal DART mouse brain section. Expression is induced across all layers of the cortex. Images are representative of data from n = 2 vehicle-treated and n = 3 tamoxifen-treated mice, each biological replicates). c, Western blot comparing APOBEC1-YTH expression after different induction protocols. Blots are representative of n = 2 biological replicates. GAPDH was run concurrently on a separate identical blot. d, Quantification of %C2U adjacent to Zhx1 A2295 after each induction protocol (n = 2 biological replicates for 4 days tamoxifen +1 and 5 days tamoxifen + 3; n =3 biological replicates for 5 days tamoxifen + 7). e, Western blot detecting METTL3 from the cortex of mice treated with corn oil or tamoxifen. Image is representative of n = 3 biological replicates. GAPDH was run concurrently on a separate identical blot. f, Quantification of western blots from (f). n = 3 biological replicates. Corn oil mean = 1. Tamoxifen mean 1.18. p = 0.44. Error bars represent standard deviation.
Extended Data Fig. 2 –
Extended Data Fig. 2 –. Characterization of tamoxifen-inducible C-to-U editing at m6A sites in vivo.
a, Sanger sequencing traces indicating C-to-U editing adjacent to m6A sites in five different mRNAs across tissue types following tamoxifen induction of APOBEC1-YTH. Arrows indicate cytidines adjacent to m6A sites. Data are representative of 3 biological replicates. b, Quantification of editing percentage (%C2U) in each tissue for sites in the Arl5a, Uba5, and Zhx1 mRNAs. Methylation at the indicated sites differs across tissues. Error bars represent standard error (n = 3 biological replicates). Mean values for Arl5a: Cortex = 25.33, Liver = 39.0, Lung = 17.67, Kidney = 24.0, Heart = 30.33. Mean values for Uba5: Cortex =18.33, Liver =19.33, Lung = 14.0, Kidney = 15.33, Heart = 34.33. Mean values for Zhx1: Cortex = 20.33, Liver = 26.67, Lung = 13.67, Kidney = 16.33, Heart = 27.33. c, Quantification of editing percentage (%C2U) in each tissue adjacent to m6A sites in the Chd4, and Man2b1 mRNAs. Methylation at the indicated sites is consistent across tissues. Error bars represent standard error (n = 3 biological replicates). Mean values for Chd4: Cortex = 42.67, Liver = 46.0, Lung = 40.0, Kidney = 44.67, Heart = 46.67. Mean values for Man2b1: Cortex = 35.67, Liver = 38.67, Lung = 44.33, Kidney = 44.67, Heart =33.0. d, Pie chart indicating the proportion of m6A sites in the cortex with non-adjacent editing events within a 25nt window. e, Histogram showing the number of non-adjacent editing events observed in each 25nt window for the 53% of m6A sites in (d) that contain non-adjacent edits.
Extended Data Fig. 3 –
Extended Data Fig. 3 –. C-to-U editing in vivo requires APOBEC1-YTH induction and m6A binding.
a, Sanger sequencing traces indicate a lack of C-to-U editing in the absence of APOBEC1-YTH induction. DART mice were injected with corn oil (vehicle control, n = 1 biological replicates) and RT-PCR/Sanger sequencing was performed to assess editing adjacent to m6A sites in four different mRNAs across tissue types. Arrows indicate cytidines adjacent to m6A sites. b-f, Quantification of %C2U values adjacent to m6A sites in cellular mRNAs from APOBEC1-YTHmut-expressing mice compared to APOBEC1-YTH-expressing mice. C-to-U editing is substantially reduced in APOBEC1-YTHmut-expressing mice, indicating that editing in DART mice depends on m6A recognition. Error bars represent standard error (n = 3 biological replicates). Mean values for APOBEC1-YTH samples are the same as Extended Data Fig. 2b.c. Mean values for APOBEC1-YTHmut samples are: Arl5a - Cortex = 3.67, Liver = 3.67, Lung = 4.33, Kidney = 3.33, Heart = 6.0; Uba5 - Cortex = 8.33, Liver = 7.67, Lung = 6.0, Kidney = 9.0, Heart = 9.0; Zhx1 - Cortex = 10.67, Liver = 6.67, Lung = 7.0, Kidney = 7.0, Heart = 10.33; Chd4 - Cortex = 1.33, Liver = 2.67, Lung = 2.67, Kidney = 1.67, Heart = 3.33; Man2b1 - Cortex = 6.0, Liver = 1.67, Lung = 3.33, Kidney = 2.33, Heart = 4.33.
Extended Data Fig. 4 –
Extended Data Fig. 4 –. Characterization of gene expression and m6A methylation in the cortex, hippocampus, and cerebellum.
a, Hierarchical clustering of gene expression similarity scores across samples from each brain region expressing either APOBEC1-YTH or APOBEC1-YTHmut. Samples primarily cluster by brain region, not by which transgene is expressed. b, Volcano plots indicating the number of differentially expressed genes between APOBEC1-YTH-expressing brain regions. Significance was determined using DESeq2 (negative binomal regression followed by Wald test and FDR-based p-value adjustment). c, Volcano plots indicating the small number of gene expression differences between APOBEC1-YTH and APOBEC1-YTHmut-expressing cells in each brain region. Numbers indicate the number of up/downregulated genes. Significance was determined using DESeq2 (negative binomal regression followed by Wald test and FDR-based p-value adjustment). d, Number of differentially expressed RNAs between the cortex of DART mice and wild type mice,. There are similar numbers of differentially expressed RNAs across all samples, indicating that APOBEC1-YTH expression does not substantially alter gene expression patterns. e, Distribution of %C2U values at m6A sites identified in the cortex (n = 17,878 sites from 4 biological replicates), hippocampus (n = 13,461 sites from 4 biological replicates), and cerebellum (11,391 sites from 4 biological replicates). Significance was determined using a two-sided Wilcoxon rank-sum test. Center line in box represents median, while the box represents the 25th–75th percentile. Whiskers represent the highest and lowest values (1.5x interquartile range), with outliers shown as dots. Cortex vs. Hippocampus p-value = 0.004. Cortex vs. Cerebellum p-value = < 2.2e−16. Hippocampus vs. Cerebellum p-value = < 2.2e−16. * = p < 0.05. **** = p < 0.0001. f, Metagene analysis showing the distribution of m6A sites identified in DART mice in each brain region. Significance was determined using a two-sided t-test with no p-value adjustment. g, m6A sites identified in the cortex of DART mice are enriched in long internal exons. Barplot indicates the number of methylated internal exons relative to the total number of internal exons within each group. Solid line at 1 indicates no enrichment. h, Overlap of methylated RNAs identified by in vivo DART-seq and antibody-based m6A profiling in each brain region. i, Independent validation of methylation at randomly selected m6A sites using RT-qPCR-based relative m6A quantification. Dotted line at 1 indicates no detectable methylation. n = 3 biological replicates. Error bars represent standard error. Significance was determined using a one-sided t-test comparing to 1. Mean for Paqr8 = 49.41, mean for Ube2v1 = 6.31, mean for Nova2 = 1,375. j, Overlap of individual m6A sites identified across all three brain regions. k, Comparison of APOBEC1-YTH transgene RNA levels across brain regions. The number of normalized counts mapping to rat APOBEC1 is shown. Significance was determined using DESeq2 (negative binomal regression followed by Wald test and FDR-based p-value adjustment). Error bars represent standard error (n = 4 biological replicates). Mean for APOBEC1-YTH samples: Cortex = 2,218; Hippocampus = 2,644; Cerebellum = 1,278. Mean for APOBEC1-YTH samples: Cortex = 2,680; Hippocampus = 2,855; Cerebellum = 1,304. * = p < 0.05. **** = p < 0.0001. l, Bar chart showing the number of overlapping methylated RNAs between DART-seq in the cortex and MeRIP-seq datasets (Liu et al 2020) across mouse tissues. m, Clustering of m6A methylation patterns from mouse brain regions and other organs using the DART-seq and Liu et al 2020 datasets. n, Gene expression analysis of m6A writers, readers, erasers, and core EJC components derived from RNA-seq data from Liu et al 2020. Log2FC represents brain relative to other tissues. o, Validation of differential m6A levels using RT-qPCR-based m6A quantification. Two sites identified with in vivo DART-seq as being differentially methylated between the cortex and cerebellum (n = 4 biological replicates) and two sites differentially methylated between the cortex and hippocampus (n = 2 biological replicates) are validated. Data are plotted as the relative methylation level detected in cortex, normalized to either cerebellum or hippocampus from the same animal. Individual data points are shown with lines indicating brain regions from the same animal. Error bars represent standard error. Significance was determined using a one-sided t-test comparing values to 1. *** = p < 0.01.
Extended Data Fig. 5 –
Extended Data Fig. 5 –. Characteristics of gene expression and RNA methylation in the adult mouse cortex.
a, Density plot showing the number of total RNA-seq reads per cell from replicate mice with the indicated genotype. b, Density plot showing the percentage of reads mapping to mitochondrial mRNAs in replicate mice with the indicated genotype. The vast majority of cells in all replicates show very low mitochondrial representation (< 2%). c, Metagene analysis of RNA-seq reads from bulk and scDART-seq data using split-pool barcoding. Although there is an enrichment of reads at the 3’ end of transcripts using split-pool barcoding scRNA-seq, good coverage is obtained across transcript length. d, Marker gene expression across individual cell types in the cortex. Dot color indicates average normalized expression in the indicated cell type. Dot size indicates percentage of cells that express the marker gene. e, Heatmap showing marker gene expression within different cell types in the cortex. f, Barplot showing the enrichment of m6A sites in long internal exons from scDART-seq analysis of the mouse cortex. Enrichment indicates the number of methylated internal exons relative to the total number of internal exons within each group. g, Overlap of methylated RNAs identified by scDART-seq and bulk DART-seq in the mouse cortex (left). Overlap of methylated sites identified in the cortex using scDART-seq and bulk DART-seq (middle). Overlap of methylated RNAs identified by scDART-seq and MeRIP-seq in the mouse cortex (right). h, Cumulative distribution plot as in (d), but showing each cell type separately. i, Cumulative distribution plot of all m6A sites identified in the mouse cortex and the percentage of cells in which each site is methylated. Only cells expressing the parent RNA were considered (n = 27,400). j, Cumulative distribution plot of methylated RNAs identified in the mouse cortex and the percentage of cells in which the RNA is methylated. Cells that do not express the RNA were excluded from the analysis (n = 3,991). k, Cumulative distribution plot as in (c), but showing each cell type separately. l, Overlap of methylated RNAs identified by performing nuclear DART-seq on mouse cortical neurons and those identified in neurons from the scDART-seq dataset. Glut = Glutamatergic Neuron; GABA = GABAergic Neuron; Oligo = Oligodendrocyte; Micro = Microglia; CR = Cajal-Retzius Cell; Macro = Peripheral Macrophage; SMC = Smooth Muscle Cell.
Extended Data Fig. 6 –
Extended Data Fig. 6 –. Analysis of m6A in microglia and other cortical cell types.
a, Total number of m6A sites per cell within the indicated cell types, not normalized to read counts. Red dot indicates the mean. b, Total number of reads detected per cell within each cell type. Red dot indicates the mean. c, All single-cell %C2U values for m6A sites identified within each cell type (Glut n = 280,790; GABA n = 11,214; Astro n = 19,370; Oligo n = 4,769; Micro n = 133; CR n = 211; Ependy n = 6,775; Endo n = 6,314; Peri n = 1,949; Macro n = 935; SMC n = 2,232). Boxes show 25–75th percentiles and the median, with whiskers for the highest and lowest values and outliers shown. d, Number of m6A sites per cell, normalized to read coverage, identified in microglia (n = 54 cells) and glutamatergic neurons (“All Glut”; n = 3,842 cells). 54 Glut represents 10,000 iterations of 54 randomly selected glutamatergic neurons within the scDART-seq dataset. Coverage-matched represents 10,000 iterations of 54 randomly selected glutamatergic neurons with similar reads per cell as microglia. Error bars represent standard deviation. Significance was determined using a two-sided Wilcoxon rank-sum test. p-value for all shown comparisons < 2.2e−16. **** = p < 0.0001. e, Violin plot of data in (d). Each dot represents the average number of read-normalized sites per cell obtained from 54 random glutamatergic neurons sampled. Significance was determined using a two-sided Wilcoxon rank-sum test. p-value for all shown comparisons < 2.2e−16. **** = p < 0.0001. f, Number of m6A sites per cell, normalized to read coverage, identified in microglia (n = 54 cells) and astrocytes (“All Astrocytes”; n = 1,952 cells). 54 Astrocytes represents 10,000 iterations of 54 random astrocytes within the scDART-seq dataset. Coverage-matched represents 10,000 iterations of 54 random astrocytes with similar reads per cell as microglia. Error bars represent standard deviation. Significance was determined using a two-sided Wilcoxon rank-sum test. p-value for all shown comparisons < 2.2e−16. **** = p < 0.0001. g, Violin plot of data in (f). Each dot represents the average read-normalized sites per cell obtained from each iteration of 54 random astrocytes sampled. h, Normalized expression of APOBEC1-YTH in microglia compared to all other cell types. Significance was determined using FindMarkers in Seurat (two-sided Wilcoxon rank-sum test was used, with Bonferroni p-value adjustment). i, Representative images of n = 2 biological replicates, comparing APOBEC1-YTH expression (magenta) in a microglial cell (marked by Iba1 staining, green) and an astrocyte (marked by GFAP staining, red). Merge shows the neighboring microglia and astrocyte, with external APOBEC1-YTH signal removed for clarity. j, Quantification of APOBEC1-YTH immunofluorescence intensity in microglia (n = 43 cells from 2 distinct animals) and astrocytes (n = 49 cells from 2 distinct animals) in DART mice. Significance was determined using a two-sided Wilcoxon rank-sum test. n.s. = not statistically significant. Boxes show 25–75th percentiles and the median, with whiskers for the highest and lowest values and outliers shown. k, Western blot showing APOBEC1-YTH and METTL3 expression within cortical microglia and astrocytes isolated by FACS. n = 1 biological replicate. GAPDH was run concurrently on a separate identical blot. l, Quantification of (k) showing the GAPDH-normalized expression of APOBEC1-YTH. m, Dot plot showing expression level and percentage of cells with expression of mRNAs for m6A methyltransferase components, m6A readers, m6A erasers, and EJC proteins. n, Heatmap showing the total number of differentially methylated sites identified between each pair of cell types in the cortex. Heatmap is colored by the number of differentially methylated sites identified in the reference cell type relative to the comparison cell type. o, Heatmap showing the number of differentially methylated sites with increased average %C2U in the reference cell type relative to the comparison cell type, colored by the number of differentially methylated sites. p, Heatmap showing the average log2 fold-change in %C2U for all sites found in non-coding RNAs (ncRNAs) within each region in the reference cell type relative to the comparison cell type. q, Heatmap showing the average log2 fold-change in %C2U for all sites found in 5’ UTRs within each region in the reference cell type relative to the comparison cell type. r, Heatmap showing the average log2 fold-change in %C2U for all sites found in 3’ UTRs in the reference cell type relative to the comparison cell type. There are no pairs of cell types with significant differential methylation within coding sequences.
Extended Data Fig. 7 –
Extended Data Fig. 7 –. Differential methylation between neurons and astrocytes in the mouse cortex.
a, Correlation between changes in methylation and gene expression for all DM-RNAs with increased %C2U identified across cell types. Blue line indicates linear regression, gray band represents 95% confidence interval. Spearman correlation coefficient is shown. p = 0.0013. n = 1,436. b, As in (a), except only DM-RNAs with decreased %C2U. Blue line indicates linear regression, gray band represents 95% confidence interval. Spearman correlation coefficient is shown. p < 2.2 x 10⁻¹⁶. n = 1,436. c, Comparison of log2-fold change in gene expression and %C2U values for DM-RNAs identified between glutamatergic neurons and astrocytes. Blue line indicates linear regression, gray band represents 95% confidence interval. Spearman correlation coefficient is shown. p = 0.77. n = 214. d, As in (c), except only DM-RNAs with increased %C2U. Blue line indicates linear regression, gray band represents 95% confidence interval. Spearman correlation coefficient is shown. p = 0.6325. n = 18. e, As in (c), except only DM-RNAs with decreased %C2U. Blue line indicates linear regression, gray band represents 95% confidence interval. Spearman correlation coefficient is shown. p = 0.08654. n = 196. f, Top 10 most significant Gene Ontology terms enriched among DM-RNAs identified between glutamatergic neurons and astrocytes. g, UMAP visualization of glutamatergic neurons and astrocytes colored by the mean %C2U value across all m6A sites identified in the Gria1 mRNA (n = 2,506). h, Density plot showing the distribution of the average %C2U value for all sites in Gria1 in single cells in glutamatergic neurons and astrocytes. i, Violin plot showing the normalized expression of Gria1 in glutamatergic neurons and astrocytes. Red dot indicates the mean. Significance was determined using FindMarkers in Seurat (two-sided Wilcoxon rank-sum test was used, with Bonferroni p-value adjustment). n = 6,162. p < 2.2e−308. **** = p < 0.0001. j, UMAP visualization of glutamatergic neurons and astrocytes colored by the mean %C2U value across all m6A sites identified in the Gria2 mRNA (n = 4,818). k, Density plot showing the distribution of the average %C2U value for all sites in Gria2 in single cells in glutamatergic neurons and astrocytes. l, Violin plot showing the normalized expression of Gria2 in glutamatergic neurons and astrocytes. Red dot indicates the mean. Significance was determined using FindMarkers in Seurat (two-sided Wilcoxon rank-sum test was used, with Bonferroni p-value adjustment). n = 6,162. p = 0.01. * = p < 0.05. Glut = Glutamatergic neurons.
Extended Data Fig. 8 –
Extended Data Fig. 8 –. Differential methylation in neuronal subtypes.
a, Expression of marker genes within each glutamatergic neuron subtype. Dot color indicates average expression level of the indicated mRNA. Dot size indicates percentage of cells in which the mRNA is expressed. b, Average %C2U value of all sites in the Fos mRNA in IT glutamatergic neurons from different cortical layers. Red dots indicate mean values. n = 320. c, Normalized gene expression of the Fos mRNA in IT glutamatergic neurons from different cortical layers. n = 2,930. d, Average %C2U value of all sites in the Nr4a2 mRNA in IT glutamatergic neurons from different cortical layers. Red dots indicate mean values. n = 360. e, Normalized gene expression of the Nr4a2 mRNA in IT glutamatergic neurons from different cortical layers. Red dots indicate mean values. n = 2,930. f, APOBEC1-YTH RNA expression within each neuronal subtype. Red dots indicate mean values. n = 3,823. g, Correlation of changes in %C2U and gene expression of DM-RNAs between neuronal subtypes. Spearman correlation coefficient is shown, blue indicates linear regression, gray band represents 95% confidence interval. p < 2.2 x 10⁻¹⁶. n = 1,034. h, As in (g), but only showing DM-RNAs with increased %C2U values in each neuronal subtype. p = 2.65 x 10⁻⁵. n = 512. Spearman correlation coefficient is shown, blue indicates linear regression, gray band represents 95% confidence interval. i, As in (g), but only showing DM-RNAs with decreased %C2U values in each neuronal subtype. p = 3.9 x 10⁻⁴. n = 522. Spearman correlation coefficient is shown, blue indicates linear regression, gray band represents 95% confidence interval. L2/3 = Layer 2/3; L4/5 = Layer 4/5; L6 = Layer 6; IT = Intratelencephalic; PT = Pyrimidal tract; CT = Corticothalamic tract; Claust = Claustrum.
Extended Data Fig. 9 –
Extended Data Fig. 9 –. Clustering by m6A reveals heterogeneous methylation in glutamatergic neurons.
a, Stacked bar plot showing the percentage of cells within each m6A cluster that belong to the corresponding neuronal subtype. b, Stacked bar plot showing the percentage of cells within each neuronal subtype belonging to different m6A clusters. c, Number of differentially expressed RNAs within each m6A cluster. d, Metagene plot showing distribution of m6A sites in each m6A cluster. e, UMAP visualization of m6A clustering using shuffled methylation data. %C2U values for all m6A sites were randomly shuffled across all cells. f, Top 10 Gene Ontology terms among all RNAs containing differentially methylated sites across m6A clusters. g, Density plot showing the distribution of the number of differentially methylated sites identified within each parent RNA. Highlighted region and inset indicate RNAs with at least 10 differentially methylated sites. h, UMAP visualization of relative %C2U values for site A284, the most significantly differentially methylated site in Grin2b, across m6A clusters. n = 2,246. i, Violin plot showing relative %C2U values for each cell within each m6A cluster for site A284 in Grin2b. j, UMAP visualization of relative %C2U values for site A1397, the most significantly differentially methylated site in Gria2, across m6A clusters. n = 2,246. k, Violin plot showing relative %C2U values for each cell within each m6A cluster for site A1397 in Gria2. l, Correlation between the log2-fold change in parent gene expression and the log2-fold change in %C2U for all differentially methylated sites found across m6A clusters. Blue line shows linear regression, gray band represents 95% confidence interval. Spearman correlation coefficient is shown. p = 0.40. n = 2,794. m, As in (l), but only showing sites with increased %C2U within each methylation cluster. p = 0.96. n = 2,533. Blue line shows linear regression, gray band represents 95% confidence interval. n, As in (l), but only showing sites with decreased %C2U within each methylation cluster. p = 0.002. n = 261. Blue line shows linear regression, gray band represents 95% confidence interval.
Extended Data Fig. 10 –
Extended Data Fig. 10 –. Differential methylation patterns in glutamatergic neurons during aging.
a, UMAP visualization showing that cortical glutamatergic neurons from young and aged mice cluster together based on marker gene expression. b, Dot plot showing marker gene expression in the indicated cell types for the integrated scDART-seq datasets from young and aged mice. c, Comparison of log2-fold change of gene expression and average %C2U values of DM-RNAs identified in glutamatergic neurons from young versus aged mice. Blue line indicates linear regression gray band represents 95% confidence interval. Spearman correlation coefficient is shown. p < 2.2 x 10⁻¹⁶. n = 2,055. d, As in (c), but only showing DM-RNAs with increased %C2U changes in neurons from aged mice. Spearman correlation coefficient is shown. Blue line indicates linear regression gray band represents 95% confidence interval. p = 0.149. n = 852. e, As in (c), but only showing DM-RNAs with increased %C2U changes in neurons from young mice. Spearman correlation coefficient is shown. Blue line indicates linear regression gray band represents 95% confidence interval. p = 0.000725. f, Normalized expression of APOBEC1-YTH RNA in glutamatergic neurons from young and aged mice. Significance was determined using FindMarkers in Seurat (two-sided Wilcoxon rank-sum test was used, with Bonferroni p-value adjustment). p = 0.003. ** = p <0.01. Red dots indicate mean values. Average log2 fold-change = 0.22. n = 5,401. g, Western blot densitometry quantification of APOBEC1-YTH protein level in young (n = 3 biological replicates) and aged (n = 2 biological replicates) DART mouse cortex, normalized to GAPDH. Error bars represent standard error. Mean for young cortex = 0.87. Mean for aged cortex = 1.29. h, Plot showing the −log10 of the adjusted p-value and %C2U log2-fold change from differential methylation analysis. The second most significant differentially methylated RNA is App. i, Adjusted p-values and %C2U log2 fold-changes for all differentially methylated sites in the App mRNA. j, Comparison of the adjusted p-value and %C2U log2-fold changes for differential methylation of App in glutamatergic neurons and non-neuronal cells between young and aged mice. k, In vitro DART-seq results showing the %C2U values adjacent to App A2599 in bulk cortex from young (n = 5) and aged (n = 4) mice. Significance was determined using a two-sided Wilcoxon rank-sum test with no p-value adjustment. p = 0.38. n.s. = not significant. Error bars represent standard error. Mean for young cortex = 11.4. Mean for aged cortex = 8.5.
Fig. 1 –
Fig. 1 –. Identification of m6A sites in vivo using DART mice.
a, Schematic of transgene expression in DART mice. APOBEC1-YTH is induced in all tissues upon tamoxifen treatment. b, Western blot showing induction of the APOBEC1-YTH and APOBEC1-YTHmut proteins after tamoxifen treatment in 3 different brain regions. n = 2 biological replicates. c, Quantification of APOBEC1-YTH protein from (b) by densitometry. GAPDH was run concurrently on a separate identical blot. d, Number of m6A sites identified in each brain region. e, Overlap of methylated RNAs identified in the cortex, hippocampus, and cerebellum. Only RNAs expressed in all three brain regions are shown. f, Total number of differentially methylated sites between each pair of brain regions. Red indicates total sites, blue indicates sites with a relative decrease in %C2U in the second listed region, and orange indicates sites with a relative increase in %C2U in the second listed region. Cere. = Cerebellum, Hippo. = Hippocampus. g, Number of RNAs that are methylated in all 3 brain regions that contain differentially methylated sites (pink), or no differentially methylated sites (blue). h, Total number of differentially methylated sites (blue) and RNAs (red) between each pair of brain regions within RNAs that are methylated in all 3 brain regions. Cere. = Cerebellum, Hippo. = Hippocampus.
Fig. 2 –
Fig. 2 –. Single-cell m6A profiling in the mouse cortex.
a, UMAP visualization of cell types identified in the adult mouse cortex. b, Metagene analysis of m6A sites identified by scDART-seq across all cell types in the mouse cortex. c, Metagene analysis of m6A sites identified within each cell type classification. Cell types represented by fewer than 100 cells are omitted. d, Number of m6A sites identified in each cell type normalized by the total number of reads in the cell. Red dot indicates the mean. Significance was determined using a two-sided Wilcoxon rank-sum test comparing microglia to all other cells. **** = p < 0.0001. p = 2.73e−14. e, UPLC-MS data showing decreased m6A/A ratio in mRNA purified from microglia compared to astrocytes. n = 2 biological replicates. Glut = Glutamatergic Neuron; GABA = GABAergic Neuron; Oligo = Oligodendrocyte; Micro = Microglia; CR = Cajal-Retzius Cell; Macro = Peripheral Macrophage; SMC = Smooth Muscle Cell.
Fig. 3 –
Fig. 3 –. Differential methylation of RNA subsets across cell types in the mouse cortex.
a, Correlation between changes in methylation and gene expression for all 502 DM-RNAs identified across cell types. Blue line indicates linear regression, gray band represents 95% confidence interval. Spearman correlation coefficient is shown. p < 2.2 x 10⁻¹⁶. n = 2,872. b, Number of DM-RNAs identified between each pair of cell types in the cortex. Heatmap is colored by the number of DM-RNAs identified in the reference cell type relative to the comparison cell type. c, Heatmap showing the number of DM-RNAs with increased average %C2U in the reference cell type relative to the comparison cell type, colored by the number of DM-RNAs. d, UMAP visualization colored by the mean %C2U across all identified m6A sites in the Ddx6 mRNA, showing higher %C2U in glutamatergic neurons compared to astrocytes. Only cells with expression and coverage of Ddx6 are shown (n = 4,082). e, Density plot showing the distribution of average Ddx6 %C2U values within single cells in glutamatergic neurons and astrocytes. Region in black box is highlighted on the right. f, Violin plot showing the normalized expression of Ddx6 in glutamatergic neurons and astrocytes. n.s. = not statistically significant. Glut = Glutamatergic Neuron; GABA = GABAergic Neuron; Oligo = Oligodendrocyte; Micro = Microglia; CR = Cajal-Retzius Cell; Macro = Peripheral Macrophage; SMC = Smooth Muscle Cell.
Fig. 4 –
Fig. 4 –. Patterns of m6A methylation across neuronal subtypes.
a, UMAP visualization of neuronal subtypes within the cortex. b, Metagene analysis of all m6A sites found in each neuronal subtype. c, Number of m6A sites identified in each cell normalized by the total number of reads in the cell and grouped by neuronal subtype. Red dot indicates mean value. d, Matrix showing the number of DM-RNAs identified between each pair of neuronal subtypes, ranging from 0 to 102. Boxes are colored by the number of DM-RNAs in the reference cell type relative to the comparison cell type e, UMAP visualization of neuronal subtypes colored by average %C2U of all sites identified in the Egr3 mRNA. Only cells with Egr3 expression and coverage are shown (n = 1,517). f, Violin plot showing the average single-cell %C2U values for all sites in the Egr3 mRNA in L2/3 IT and L4/5 IT neurons. Red dots indicate mean values. **** = p < 0.0001. Significance was determined using a two-sided Wilcoxon rank sum test with an FDR p-value adjustment. 5.79e−05. g, Violin plot showing the normalized gene expression values of Egr3 in L2/3 IT and L4/5 IT neurons. Red dots indicate mean values. Significance was determined using FindMarkers in Seurat (two-sided Wilcoxon rank-sum test was used, with Bonferroni p-value adjustment). p = 0.512. L2/3 = Layer 2/3; L4/5 = Layer 4/5; L6 = Layer 6; IT = Intratelencephalic; PT = Pyrimidal tract; CT = Corticothalamic tract; Claust = Claustrum; EC = Entorhinal cortex; SUB = Subiculum.
Fig. 5 –
Fig. 5 –. Distinguishing cells based on their m6A profiles.
a, UMAP visualization of glutamatergic neurons clustered by m6A methylation (n = 2,246). b, UMAP visualization of glutamatergic neurons clustered by gene expression but colored by m6A cluster (n = 2,246). c, UMAP visualization of glutamatergic neurons clustered by m6A but colored by neuronal subtype (n = 2,246). d, Number of differentially methylated sites and RNAs identified within each m6A cluster. e, UMAP visualization of relative %C2U values of A2148 in the Slc1a2 mRNA within individual cells of m6A clusters (n = 2,246). A2148 is the most significantly differentially methylated site in Slc1a2.
Fig. 6 –
Fig. 6 –. Analysis of differential methylation in the cortex during aging.
a, UMAP visualization of cortical cell types using integrated datasets from young and aged mice. b, Number of up- and downregulated DM-RNAs during aging in the indicated cell types. c, UMAP visualization of glutamatergic neurons from young and aged mice, colored by the average %C2U of all m6A sites identified in the App mRNA. Only cells with App expression and coverage are shown (young: n = 3,770; aged: n = 1,296). d, Normalized expression of App in young and aged neurons. Expression log2-fold change = −0.22 (young: n = 4,554; aged: n = 846). Significance was determined using FindMarkers in Seurat (two-sided Wilcoxon rank-sum test was used, with Bonferroni p-value adjustment). e, UMAP visualization of glutamatergic neurons from young and aged mice, colored by the %C2U value for site A2599 in the App mRNA. Only cells with App expression and coverage are shown (young: n = 1,876; aged: n = 335). f, Quantification of relative methylation at App A2599 in bulk cortex using RT-qPCR-based m6A quantification. n = 3 biological replicates. Significance was determined using a two-sided Wilcoxon rank-sum test. Error bars represent standard error. p = 1. g, RT-qPCR-based quantification of relative methylation at App A2599 in cortical neurons purified from young and aged mice. n = 2 biological replicates.

References

    1. Shi H, Wei J & He C Where, When, and How: Context-Dependent Functions of RNA Methylation Writers, Readers, and Erasers. Mol. Cell 74, 640–650 (2019). - PMC - PubMed
    1. Zaccara S, Ries RJ & Jaffrey SR Reading, writing and erasing mRNA methylation. Nat. Rev. Mol. Cell Biol 20, 608–624 (2019). - PubMed
    1. Meyer KD et al. Comprehensive Analysis of mRNA Methylation Reveals Enrichment in 3′ UTRs and near Stop Codons. Cell 149, 1635–1646 (2012). - PMC - PubMed
    1. Wang Y et al. N6-methyladenosine RNA modification regulates embryonic neural stem cell self-renewal through histone modifications. Nat. Neurosci 21, 195–206 (2018). - PMC - PubMed
    1. Yoon K-J et al. Temporal Control of Mammalian Cortical Neurogenesis by m6A Methylation. Cell 171, 877–889.e17 (2017). - PMC - PubMed