Comprehensive characterization of long QT syndrome-associated genes in cancer and development of a robust prognosis model
- PMID: 39317949
- PMCID: PMC11421991
- DOI: 10.1111/jcmm.70094
Comprehensive characterization of long QT syndrome-associated genes in cancer and development of a robust prognosis model
Abstract
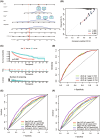
Cancer is the leading public health problem worldwide. However, the side effects accompanying anti-cancer therapies, particularly those pertaining to cardiotoxicity and adverse cardiac events, have been the hindrances to treatment progress. Long QT syndrome (LQTS) is one of the major clinic manifestations of the anti-cancer drug associated cardiac dysfunction. Therefore, elucidating the relationship between the LQTS and cancer is urgently needed. Transcriptomic sequencing data and clinic information of 10,531 patients diagnosed with 33 types of cancer was acquired from TCGA database. A pan-cancer applicative gene prognostic model was constructed based on the LQTS gene signatures. Meanwhile, transcriptome data and clinical information from various cancer types were collected from the GEO database to validate the robustness of the prognostic model. Furthermore, the expression level of transcriptomes and multiple clinical features were integrated to construct a Nomo chart to optimize the prognosis model. The ssGSEA analysis was employed to analysis the correlation between the LQTS gene signatures, clinic features and cancer associated signalling pathways. Our findings revealed that patients with lower LQTS gene signatures enrichment levels exhibit a poorer prognosis. The correlation of enrichment levels with the typical pathways was observed in multiple cancers. Then, based on the 17 LQTS gene signatures, we construct a prognostic model through the machine-learning approaches. The results obtained from the validation datasets and training datasets indicated that our prognostic model can effectively predict patient outcomes across diverse cancer types. Finally, we integrated this model with clinical features into a nomogram, demonstrating its potential as a valuable prognostic tool for cancer patients. Our study sheds light on the intricate relationship between LQTS and cancer pathways. A LQTS feature based clinic decision tool was developed aiming to enhance precision treatment of cancer.
Keywords: biomarker; cancer; long QT syndrome; prognosis.
© 2024 The Author(s). Journal of Cellular and Molecular Medicine published by Foundation for Cellular and Molecular Medicine and John Wiley & Sons Ltd.
Conflict of interest statement
The authors have declared that no competing interest exists.
Figures


Similar articles
-
Construction of a novel mRNA-signature prediction model for prognosis of bladder cancer based on a statistical analysis.BMC Cancer. 2021 Jul 27;21(1):858. doi: 10.1186/s12885-021-08611-z. BMC Cancer. 2021. PMID: 34315402 Free PMC article.
-
Novel gene signatures for prognosis prediction in ovarian cancer.J Cell Mol Med. 2020 Sep;24(17):9972-9984. doi: 10.1111/jcmm.15601. Epub 2020 Jul 14. J Cell Mol Med. 2020. PMID: 32666642 Free PMC article.
-
Exploring the significance of novel immune-related gene signatures in the prognosis and immune features of pancreatic adenocarcinoma.Int Immunopharmacol. 2021 Mar;92:107359. doi: 10.1016/j.intimp.2020.107359. Epub 2021 Jan 16. Int Immunopharmacol. 2021. PMID: 33465729
-
Long non-coding RNA profile study identifies a metabolism-related signature for colorectal cancer.Mol Med. 2021 Aug 3;27(1):83. doi: 10.1186/s10020-021-00343-x. Mol Med. 2021. PMID: 34344319 Free PMC article.
-
Unraveling Complexities in Genetically Elusive Long QT Syndrome.Circ Arrhythm Electrophysiol. 2024 Feb;17(2):e012356. doi: 10.1161/CIRCEP.123.012356. Epub 2024 Jan 24. Circ Arrhythm Electrophysiol. 2024. PMID: 38264885 Review.
References
-
- Siegel RL, Miller KD, Wagle NS, et al. Cancer statistics, 2023. CA Cancer J Clin. 2023;73(1):17‐48. - PubMed
-
- Ardalan B, Subbarayan PR, Ramos Y, et al. A phase I study of 5‐fluorouracil/leucovorin and arsenic trioxide for patients with refractory/relapsed colorectal carcinoma. Clin Cancer Res. 2010;16(11):3019‐3027. - PubMed
MeSH terms
Substances
Grants and funding
LinkOut - more resources
Full Text Sources
Medical

